BUYING LDO RETRACEMENTMy confluences are the breaker block, the fib ote and the daily bullish order block. Stop loss below today's low at 1.9. Lets see how this goes.
Market insights

LDO Buy SetupBINANCE:LDOUSDT is respecting the uptrend channel and I guess this buy trade setup will be successful
if bulls are Strong to pass the coming local resistance, we could see a nice pump


#ldousdtBINANCE:LDOUSDT is reached its trendline now and that would be 5% reject from there. lets take that 5%
$LDO bullishLDO is the governance token of Lido DAO, which is a multi-platform staking solution that allows users to access the benefits of staking their crypto without fully locking their tokens. It facilitates the staking platform’s goal of building a trustless liquid staking service and drives the decentralized ownership and decision-making of the independent structure of Lido, with governance decisions in the Lido DAO community conducted based on LDO

LDOUSDTLiquid staking derivative
Bullish high time-frame cfork
Rest of the market hinting a bullish month next month
We go up
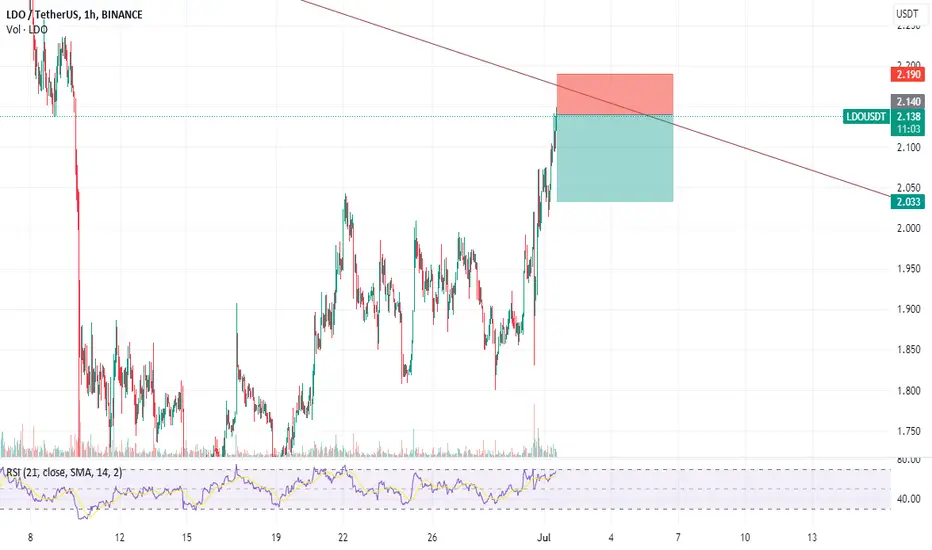
LDOUSDT.P on Bybit - Short in to a Long"Engaging in a SHORT that transitions into a LONG position. Short levels sit at 1.9450 with a stop loss at 1.9760, influenced by PoC of the range 2.04 - 1.80$, the 0.618 Fibonacci retracement level, daily and 2.618 fib retracement. Remember to take profit during the dip. As we approach the daily level of 1.7325, we could potentially see a reaction on both the NPOC at 1.7325 and the weekly at 1.7110. I'm keen to see an SFP of the 19/06/2023, 12:00 NY time lows."
Why we are using Bybit pairs?
We prefer to use Bybit charts over those from Binance or other exchanges, as in our experience, divergences are consistently respected in Bybit's platform.


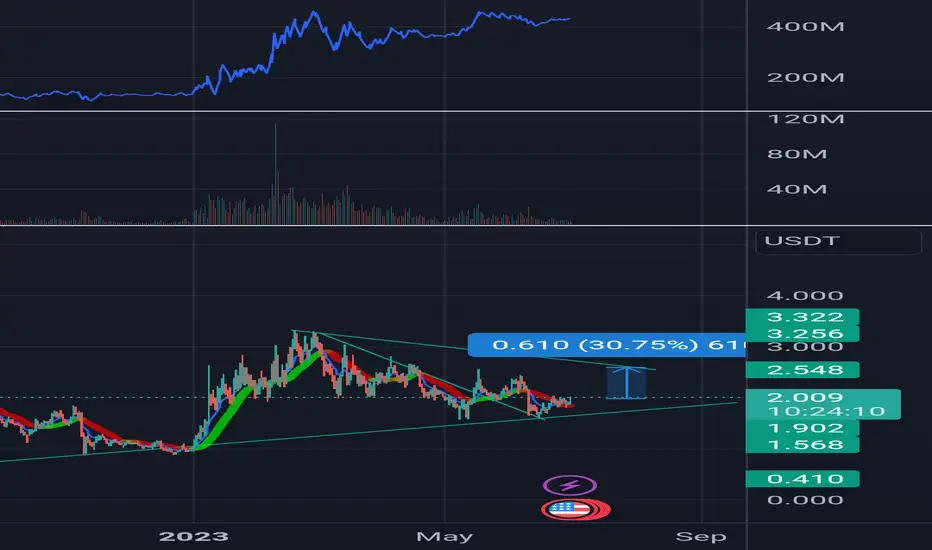
✴️ Lido DAO Bullish Regardless What HappensLido DAO is undergoing consolidation after a correction on a bullish phase that started January 2023.
The pair remains really strong as the correction is weak. The current price trades more than 150% above its Dec. '22 low.
There is a higher low short-term (mid-June vs mid-May) and prices have recovered above EMA10.
The RSI is moving up almost reaching 50... As long as the blue line/support holds, expect LDOUSD to resume the initial move and grow.
Breaking the support level would only signal more correction but followed by additional growth.
Namaste.

LDOUSDTTrend is bullish phase and there is no divergence in RSI LDOUSDT IS potentially printing HH and HL.

Lido DAO (LDO) formed Gartley for upto 52% rallyHi dear friends, hope you are well and welcome to the new trade setup of Lido DAO (LDO) with US Dollar pair.
Previously we caught a nice trade of LDO as below:
Now on a daily time frame, LDO formed a bullish Gartley move for another price reversal.
Note: Above idea is for educational purpose only. It is advised to diversify and strictly follow the stop loss, and don't get stuck with trade.

LDO achieved deal zone area. deal zone at top range.
long term target 0.9
price deviate higher yesterday night.

LIDO still needs more price correctionLido In its upward trend, it will continue to correct the price and it seems attractive to buy at the price of $1.17.(PRZ)😍
This analysis is only a personal opinion and is not an offer to buy or sell. Thank you for your support and comments.


#ldo long RR 17Currently this currency runs a liquidity risk in terms of liquidations, beyond that we can see a small support which can be used as something critical, let's go!

LDOUSDT SHORT UPDATE Scenarios:
If stopped out, reenter on trade 233
If goes through you entry, hold, don't plan exit
6/16/2023 11:38:16
Move SL:1.7964
Move Entry:1.7549
Move alarm:1.6349

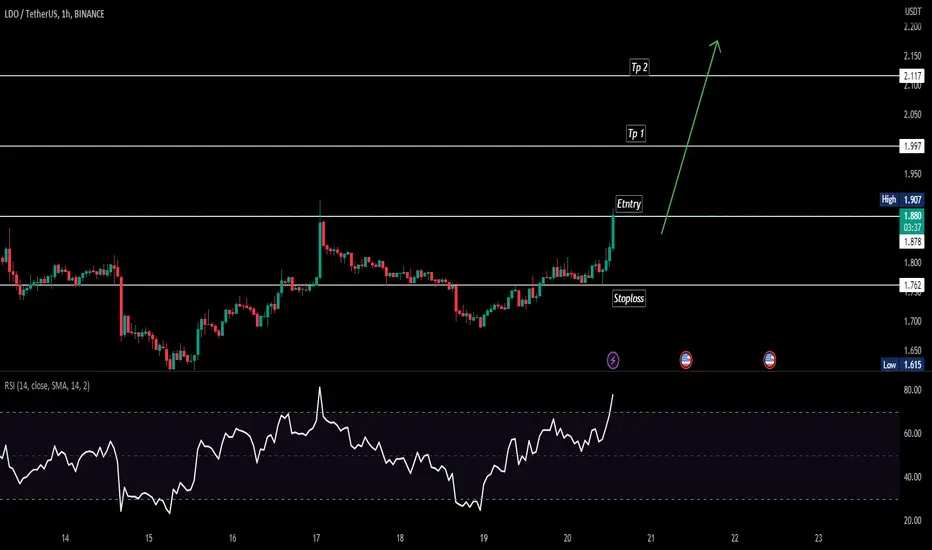
LDOUsdtldo need break trend line and come up that
now on bullish position
better wait after break resistance trend line and resistances point buy this
this is spot idea not for leverage
and targets for now change character and market back on sec entry point too this targets is correct but when come more bottom need little change
GL
EntryPoint:
1.694
1.513
Supports:
1.311
1.216
1.092
resistances:
1.813
1.851
Targets:
1.947
2.063
2.185
2.372
2.635
MidTime:
3.010
3.225
3.565
GL

LDOUSDTThe overall situation of LDO is as follows:
The general trend shows a large ascending channel with a gentle slope, but currently, it is in a corrective phase forming a descending channel towards the trendline support.
I prefer to disregard all these ups and downs and wait for the price to reach the trendline support indicated by the green color on the chart. Certainly, at that point, I would take a long position, but ultimately, everything depends on the overall market trend.
I had predicted this downward trend in the previous post, but apparently, some people didn't believe it.
⚠️"Daily crypto market analyses I provide are personal opinions & not financial advice. Trading carries risks, so do your own research & seek advisor's help."

LDOUSDT SHORT IDEAEntry Method: limit order
Move SL/Price alarm : 1.4935
Exit strategy: take 50% on first green line, the remaining 50% on the next

LDOUSDT SHORT UPDATEFROM
6/14/2023 18:36:43
Entry Method: limit order
Move SL/Price alarm : 1.4935
Exit strategy: setting to maximum percieved exit. Possibly wont reach. Exit on bounce
Or exit method: wait for peak and asses, then sell 50% accurate bounce, Remaining 50% on max

LDOUSDT ShortLDOUSDT Short
Momentum trade, details are presented in chart.
including potential price action
Entry Method: limit order
Move SL/Price alarm : 1.4935
Exit strategy: setting to maximum perseved exit. Possibly wont reach. Exit on bounce
Grade: 4.5
