Be careful with LINK !!!Unfortunately, the price has broken below the 200 moving average, which could act as a significant resistance and potentially push the price lower. In my view, the price may drop toward the PRZ (Potential Reversal Zone), and from there, it could resume its upward movement.
Market insights

Long According to the analysis of the waves and the help of the Gann method, it can be expected that the price will return to the green zone again.
This is my personal opinion. Please don't use it as your trading criteria. Good luck

LINK/USD – Holding Above 200-SMA, Eyes Higher Targets📈 Bias: LONG (uptrend resuming)
Chainlink trades at $18.25, staying above the SMA200 ($18.10) after a strong rebound from $17.69. RSI at 61 confirms momentum recovery, pointing to potential continuation.
Immediate resistance sits at $18.35–$18.50, with room to extend toward $18.90–$19.00. The structure remains bullish while holding $18.00 support.
📊 Key Levels:
Resistance: $18.35 / $18.90 / $19.00
Support: $18.00 / $17.69

LONG LINKI don't usually buy much crypto outside of the big coins... but this is a good setup, the trend progression is beautiful. Tested support, and looking to test the red horizontal resistance level. I'm just long coins... no leverage.
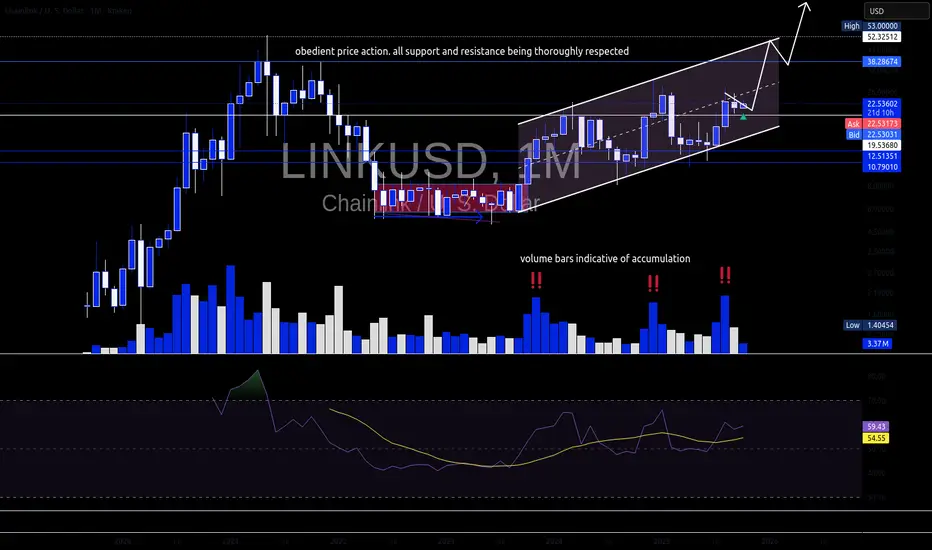
Chainlink path projectionI've had the horizontal support and resistance for months now. Recently added the parallel channel. Link has been a slow horse relative to the rest of the market, but once in clears previous highs I'm of the opinion that she sends. made initial buy at the bottom of previous range and been dcaing for 2 years. Notable exchange outflows and big wallets accumulating. SWIFT goes live end of November. You been notified
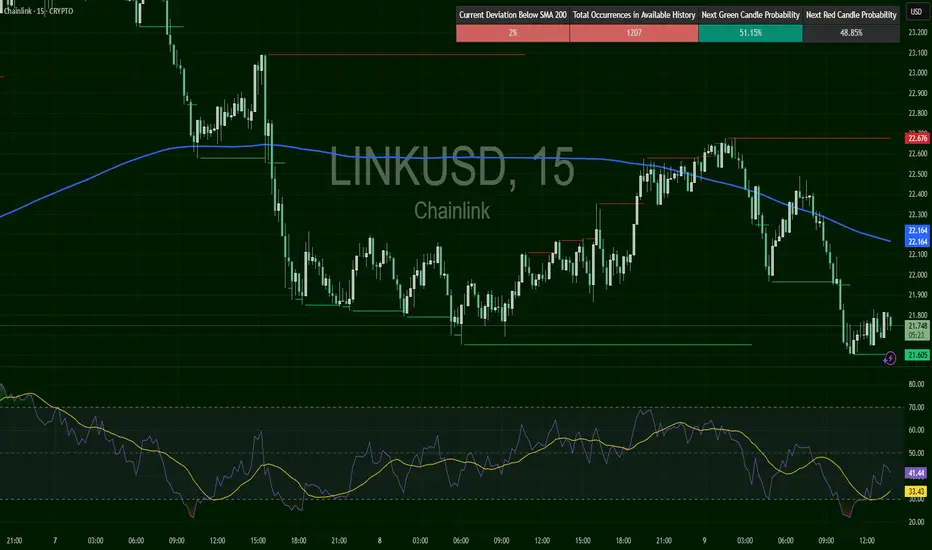
LINK/USD – Stabilizing After Sharp Drop🟠 Neutral momentum below SMA200 ($22.17)
Chainlink trades at $21.78, consolidating near support at $21.60. RSI 43, suggesting modest recovery after oversold zone. Resistance sits at $22.68.
📖 Keywords: #LINKUSD #Chainlink #AltcoinWatch #CryptoRebound
LINKUSD: At the Ascending Channel's EdgeLINKUSD: At the Ascending Channel's Edge
Chainlink (LINKUSD) on the 4-hour timeframe is currently trading within an "Ascending Channel," having recently tested its lower boundary with the price at approximately 22.016, following a rejection from previous resistance.
Bullish Scenario: A successful defense of the "Ascending Channel's" lower trendline would indicate a continuation of the upward momentum, targeting the "23 Initial Resistance" and subsequently the higher "24.5 to 24.8" resistance zone.
Bearish Scenario (Immediate): Conversely, a confirmed breach and sustained trading below the "Ascending Channel" would signal a weakening of the bullish structure, likely leading to a retest of the critical "20 Strong Support" level.
Disclaimer:
The information provided in this chart is for educational and informational purposes only and should not be considered as investment advice. Trading and investing involve substantial risk and are not suitable for every investor. You should carefully consider your financial situation and consult with a financial advisor before making any investment decisions. The creator of this chart does not guarantee any specific outcome or profit and is not responsible for any losses incurred as a result of using this information. Past performance is not indicative of future results. Use this information at your own risk. This chart has been created for my own improvement in Trading and Investment Analysis. Please do your own analysis before any investments.

LINKUSD - Breaking Out of Symmetrical TriangleA symmetrical Triangle on LINKUSD
These are considered a bullish pattern on this weekly timeframe
Looking for a breakout

Too early? - LINK weekly update Oct 7 - 13thLooking at Chainlink this morning, it shows us just another 1-2 setup to trade on. Watching this to develop top-down, we are in the 3rd wave of the cycle, the 3rd wave of the primary cycle and now the 3rd wave of the intermediate cycle starts. Within the intermediate cycle I suspect the minor cycle to from another 1-2 soon, presenting us a beautiful chance to buy in. Besides that, I can recommend taking a swing-long trade here aiming for 40$, with the stop loss at the red marked low. This scenario also fits the expectation for Ethereum as those coins correlate. The alternative scenario would mean to break the red marked low and drop further. The indicators also support this scenario, as the RSI rises from the oversold zone and momentum builds up. Funding rates are also at typical levels for this wave and the open interest shows inflows.
Have a meaningful week,
Phillip

Final bull stage brings link to previous ATH without breaking it130% Gain, then sell and never touch again. Flipped important resistance, now continue further on.

LINK could target $35 if the channel downtrend is broken, yet itInside the channel, there is support at $18, but without breaking the $22 resistance, $35 won’t come. For spot and long-term positions, it can be accumulated with a $35 target. Not financial advice.

LINK/USD – Stalling at Resistance🔴 Rejection risk below $22.86
Chainlink trades at $22.49, above SMA200 ($21.94) but fading after rejection at $22.86 resistance. RSI at 39, showing fading momentum and risk of pullback.
📖 Keywords: #LINKUSD #Chainlink #AltcoinWatch #CryptoResistance

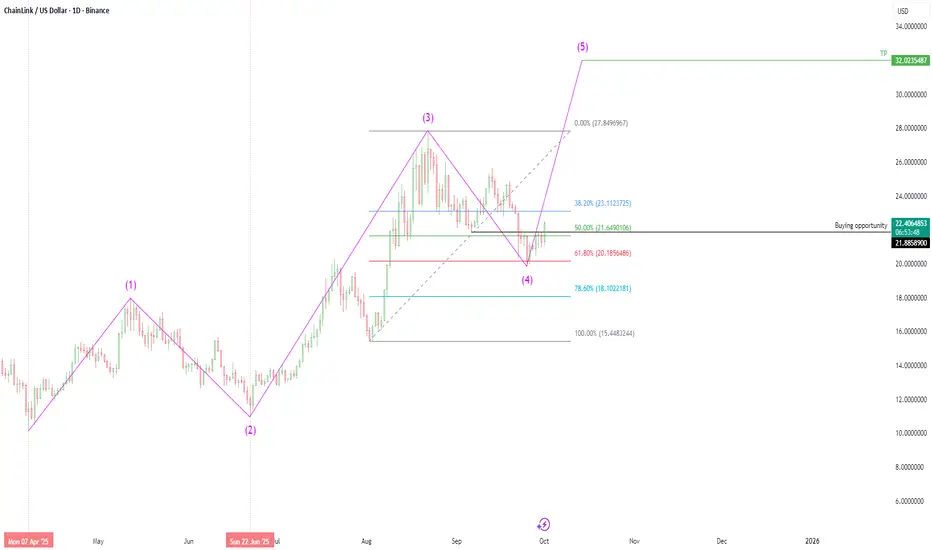
Chainlink (LINK/USD) - Elliott Wave AnalysisBased on Elliott Wave Theory, Chainlink (LINK/USD) appears to have successfully completed its corrective Wave 4, as evidenced by the recent stabilization and reversal patterns observed on the daily timeframe. This completion sets the stage for the anticipated impulsive Wave 5, which is now clearly visible on the daily chart. The structure suggests a continuation of the broader uptrend, with increased momentum likely to drive prices toward higher targets.
The WOW of th marketChain-link has been a beautiful pair to trade and will continue to do more....the technical aspect of what this pair is doing has shown itself as reliable.
last month chain-link topped out and started making new projections to the downside, creating an interesting pattern and so far so good is still playing out..
bear with me on my mic issues, still clearing that out,...like and follow for more as i keep practicing and getting better at this.. thank you

beginning trading, first time publish this idea is interesting, this is my first publish here and i intend to keep practicing and improving my analytical skills and ideas in making these videos

LINK Long ( Last Long In 25 )Buyers riding the bat are approaching the 1.138 level after accumulating at the 0.886 level, and are expected to bring the price to the triple target levels.
Additionally, there is a high probability that this buy order is the last buying opportunity, and after this, we anticipate a deep crypto crash. The buyers' future candle pattern in this idea provides more accurate information about the validity and accuracy of this claim.

LINK ShortLINKUSD is projected to experience a decline from its current level of $29, moving steadily toward its anticipated target. This movement is supported by the validation of a Crab pattern formation, which signals a potential reversal and aligns with technical analysis trends.

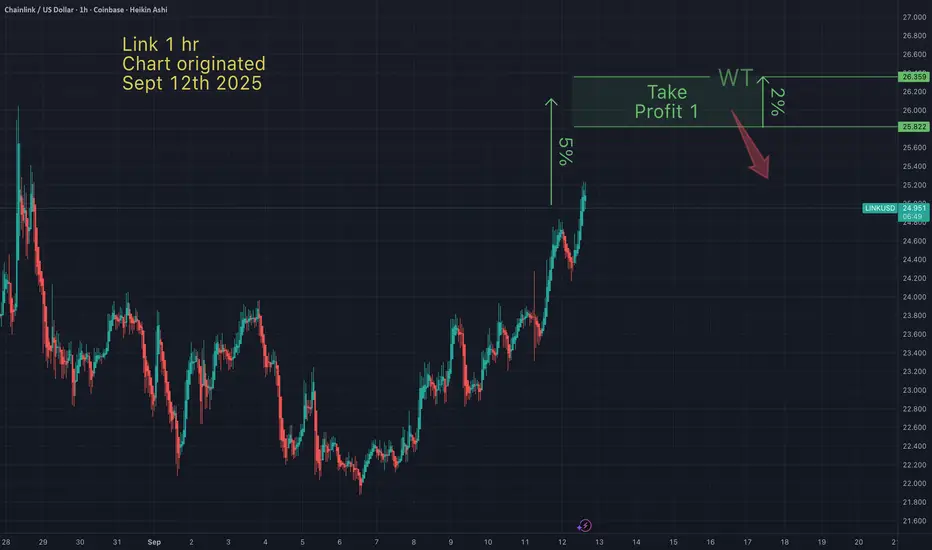
Link - Take profit targetI anticipate Link will hit my take profit this weekend. I bought the bottom last Sunday, so I'm happy with my profits, even if Link goes higher than my TP.
May the trends be with you.
**Technical Analysis of LINKUSD** LINKUSD is currently engaged **Technical Analysis of LINKUSD**
LINKUSD is currently engaged in intense trading around the critical support level of **$13.20**, which has been a significant psychological and technical threshold tested multiple times recently. The price continues to trade below both the 50-day (approximately **$14.50**) and 200-day (approximately **$15.10**) moving averages, indicating that the overall trend remains bearish. The lack of significant volume expansion during recent declines suggests that selling pressure may be gradually exhausting, though strong buying interest has also been absent.
From a technical indicator perspective, the daily RSI is hovering around **40**. While it has not entered oversold territory, it shows potential signs of a bullish divergence, warranting attention for a possible short-term technical rebound. The MACD remains below the zero line, but its fast and slow lines are flattening and converging, with weakening histogram momentum, indicating that downward momentum may be slowing.
Immediate resistance above lies at **$14.50** (50-day moving average), with stronger resistance around **$15.80** (a confluence zone of previous highs and Fibonacci retracement levels). Fundamentally, Chainlink continues to secure partnerships and integrations in the tokenization of real-world assets (RWA) among traditional financial institutions, reinforcing its long-term narrative. However, this has done little to offset broader macroeconomic sentiment in the short term.
If the **$13.20** support level is decisively broken, the next target could be the **$12.00** psychological barrier. Conversely, if the price can reclaim **$14.50** with strong volume, it may alleviate recent downward pressure and build momentum for testing higher resistance levels. Traders should closely monitor Bitcoin's movements, as it remains a key external variable influencing LINK's short-term price action.

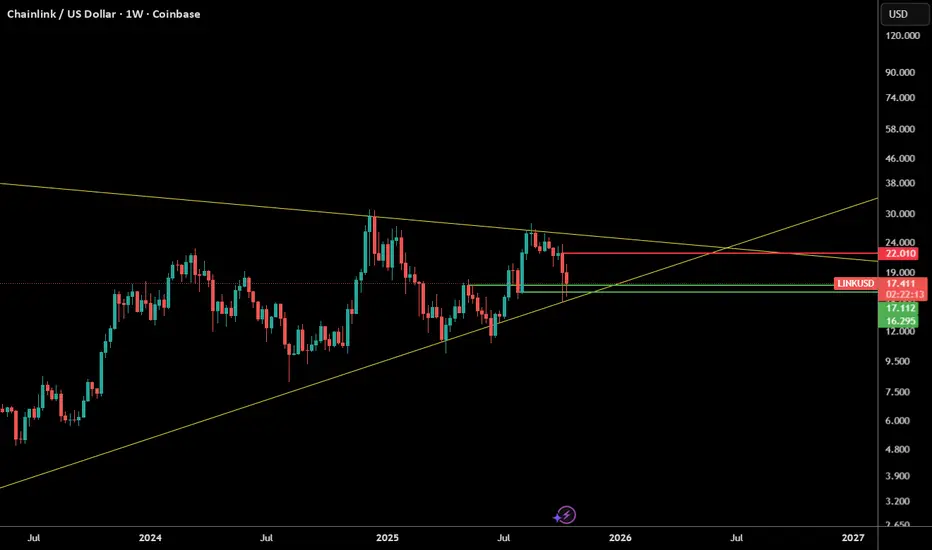
Technical Analysis – Chainlink (LINK/USDT)Chainlink has been consolidating for over 3 years inside a large symmetrical triangle on the weekly chart. Now it’s reaching the final stage of the pattern, close to a decisive breakout.
Chart highlights :
Ascending support since 2022, respected multiple times.
Major resistance around $25 – $27, the key breakout level.
A confirmed breakout could target $50 – $52, near the all-time high.
Ichimoku cloud shows a bullish bias, with price attempting to hold above it.
Main scenario : If LINK breaks above $25 – $27 with strong volume, it could trigger a rally toward the $40 – $52 zone.
Alternative scenario : A drop below $15 would invalidate the pattern and potentially drag price back to the $10 – $12 range.
What I think: Chainlink is about to make a major move after years of accumulation. The breakout direction will define the market trend for the coming months.

Link and Top AltsLINK poised to moon if BTC can maintain theses levels, which looks like NP as of late.
link has been in a very well rounded rebound pattern, remember, LINK crossed $50 only two years ago...

Potential patterns in recent LINKUSD movementsSince consolidating/accumulating from late 2024's bullrun, LINK has broken into a bullish pattern (following movements of BTC and ETH). I see a series of demand runs followed by small selloffs/rejections. If the pattern continue, as is likely with ETH retesting $5K, we could see the next leg up to about $36-$38.
If ETH blows past $5k with high volume, we could see LINK move even higher towards previous ATH's.
If ETH is rejected at $5k again, that could be a double top signal and send the whole market bearish until next cycle.
Thoughts?

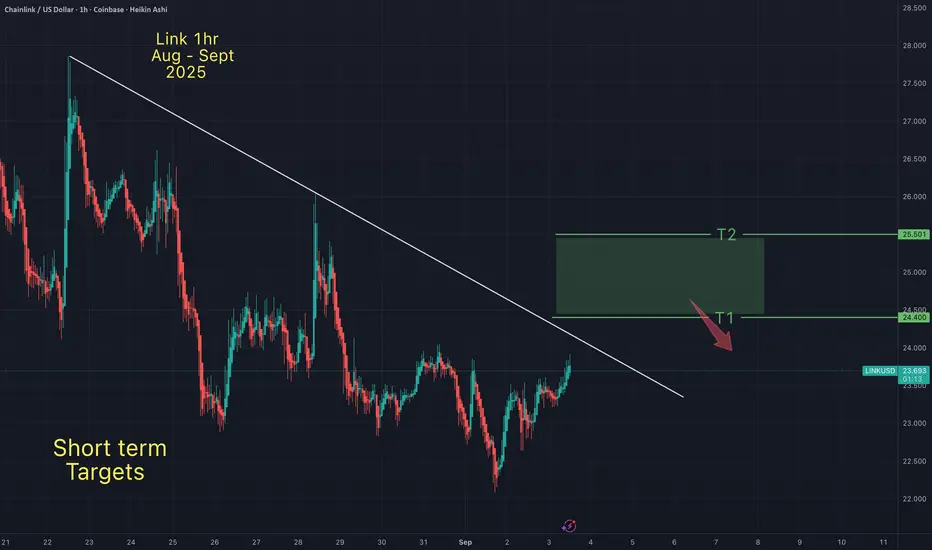
Link - Short term targetsI posted my midterm Link targets on my Aug 30th Link chart. These are my shorter term targets. I expect Link to follow Btc up to my Btc targets (see my Sept 2nd Btc chart). Then I expect both assets to retrace. At that point I will be on "lower low watch".
May the trends be with you.