LINKUSD trade ideas
Link: Major Wave 3 Bull Run Underway, Eyes New Highs My Elliott Wave analysis of Chainlink (LINK) suggests we're in a powerful major third wave. This is typically the most explosive part of a market trend, marked by strong upward momentum.
Rationale: The price has completed a corrective wave 2 and is now extending into wave 3. This indicates strong buying pressure and a potential move to new highs.
Invalidation Point: My bullish thesis is invalidated if LINK closes below $10.809. This level is critical. A break below it would suggest a different, more bearish, wave count is in play.
Strategy: I'm looking to be long on LINK, targeting significant upside. Always manage your risk with a stop-loss order below the invalidation point.
Disclaimer: This is for educational purposes and is not financial advice. Trade at your own risk.
Chainlink (LINK) Ascending Triangle — Eyeing $30 BreakoutPattern: Clear ascending triangle forming (higher lows + flat resistance near $26.8–27.0).
EMA: Price ($26.13) is slightly above EMA ($25.87) → short-term bullish tilt.
Volume: Increasing on up-moves, decreasing on pullbacks → bullish accumulation signal.
🔹 Key Levels
Support:
$25.5–25.8 (EMA + ascending trendline)
$24.7–25.0 (secondary support)
$23.7 (major breakdown level)
Resistance:
$26.8–27.0 (triangle breakout trigger)
$28.5 (next supply zone)
$30.0–30.5 (psychological + measured breakout target)
🔹 Breakout Targets (from triangle height)
Base of triangle ~ $23.7 → top $26.8 (~$3 range).
Breakout projection = $30.0 zone (matches your arrow).
🔹 Trade Outlook
Bullish Scenario:
Breakout above $27.0 with volume → run to $28.5 → $30.0.
Bearish Scenario:
Breakdown below $25.5 → retest $24.7, worst-case $23.7.
Targets: $28.5 → $30.0.
📌 Summary: LINK is consolidating inside an ascending triangle. Break above $27 = bullish continuation toward $30+. Breakdown below $25.5 flips structure bearish
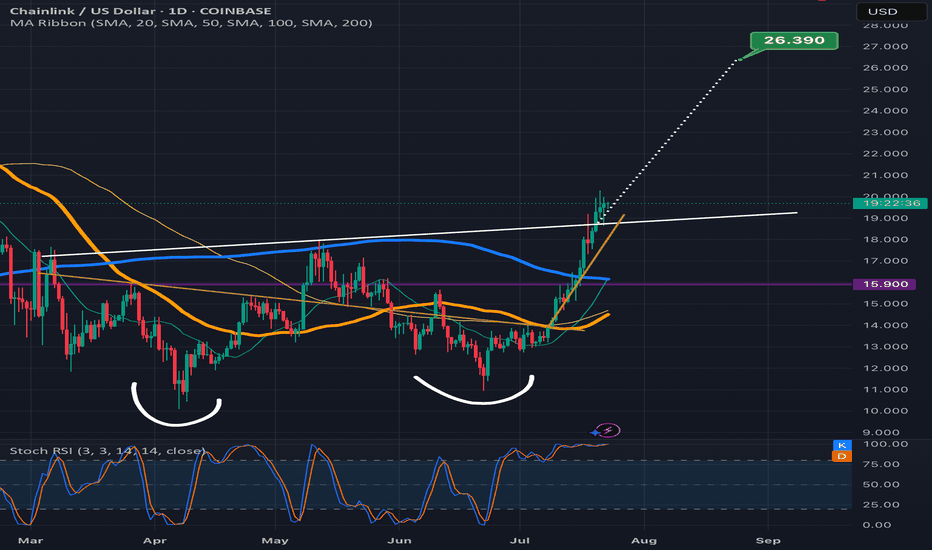
Chainlink climbing the measured move line staircaseLooks like Chanlink is ready to confirm the double bottom breakout here as the past few candles have already started to climb up the measured move line like a staircase.Always possible for a dip back below the neckline at this point but probability slightly favors the readout being validated instead for now. *not financial advice*
$LINK Setting Up for a RunCRYPTOCAP:LINK it's looking like it's breaking out from the downward trendline, if cleared I do see some resistance area that would be worth keeing an eye on, we've a Monthly level, plus the GB. Which could provide a slight pullback, but other than that, i don't see too much resistance beyond that, we do have the ATH to be aware of, but with enough possitive volume, we could see this thing, run.
Similar Paths, Different OutcomesLINK ADA THETA BOSON
Nigel picked out that LINK is looking positive.
Notice how LINK ADA THETA and BOSON all reflect each other in terms of structure but now with LINK the strongest and BOSON weakest.
Very interesting to see big gun THETA still doing nothing.
This coin is a real hodler favourite obviously because it did a x300 last cycle (and of course - great fundamentals 😅).
These 4 charts are a great example of how the market maker is making it difficult for non-technical buyers 🧐.
LinkUsdt ready to outperform EtheriumHi Everyone,
Looking at chart, chainlink is looking primed to close above 20 dollar. if that happens i would anticipate strong upward pressure taking the prices high to 28 dollar and extended target of 38 dollar.
As chart is suggesting strong trendline holding very well as support.
On daily, Macd is above 0 and looking to crossover, indicating strong momemtum might come if than happens.
I have also looked at chainlink against Etherium and it is at longterm trendline support.
Everything points to the fact that if chainlink price close above 20 on daily, strong upward pressure would come.
I have given same price analysis on Xrp in the past and it has performed very well within 3 days of posting the chart
look into my chart history and find xrp if you would like to understand the impact of these closures.
Not financial advise
Best of luck
Like and subscribe for more analysis
Chainlink (LINK)LINK doesn't need any introduction; it has a great project, a great community, and has also given great growth. It seems the corrective wave has ended at 0.382 Fibonacci retracement and now the price is about to break the consolidation triangle-shaped area. Let's see how things unfold.
Link Idea updateTimeframe later than initially anticipated
Price targets still intact
My Main TP still at $63
but expecting market TP around $33 $42 and ATH of $52 so look for reaction and TP in these areas
Being a strong alt in this tough alt market cycle LINK could see more growth than most and could exceed my expectations of $63 beyond to 80+ ultimately around $95
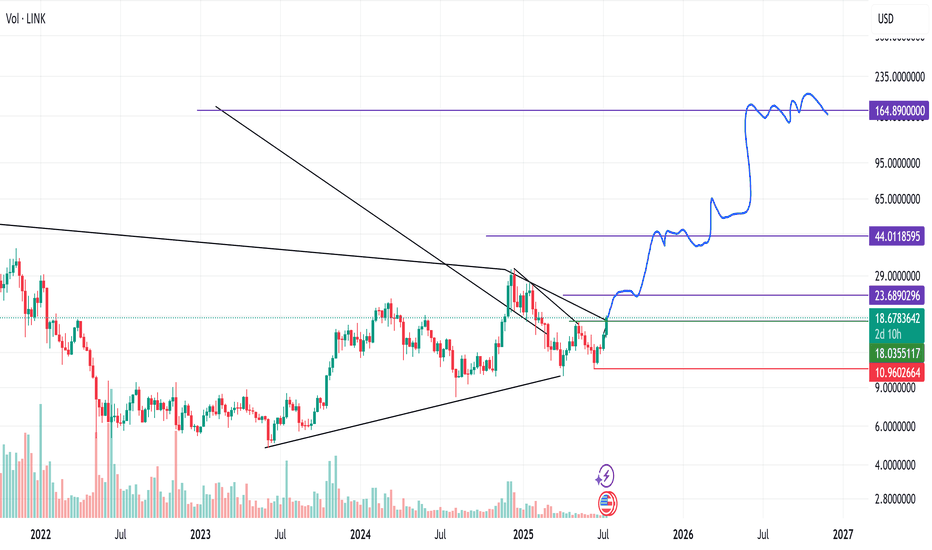
Chainlink Ignites: The Chain ReactionChianlink macro pattern triggered, fundamentally strong. Even though link is known for wild swings this is a spot hold to target $192.091. I've posted a similar idea a few weeks ago with a target of $164.89, though after seeing the similar pattern on Coinbase which has higher volume, I will use this setup. I would not enter this on leverage the stop is to far away - spot holding only for me.
Entry 20.284
Stop 15.430
Int1 23.517
Int2 54.684
Target 192.091
"Chainlink robbery in progress! Are you in or missing out?"🚨 LINK/USD "CHAINLINK vs U.S DOLLAR" HEIST PLAN 🚨
🔰 PLAN: BULLISH HEIST (STEAL & ESCAPE BEFORE COPS ARRIVE!)
💎 ENTRY: ANY PRICE (BUT THIEFS USE LAYERS!)
🤑 THIEF ENTRY STRAT (LAYERED LIMIT ORDERS):
"The vault is open! SWIPE THE LOOT IN LAYERS!"
📍 BUY LIMIT LAYERS:
👉 24.40 (First dip grab!)
👉 24.00 (Double dip!)
👉 23.50 (Triple steal!)
👉 23.00 (Last call before cops!)
(Add more layers if you’re a PRO THIEF!)
🛑 STOP LOSS (THIEF OG STYLE):
"If the cops breach @ 22.00, ABORT MISSION!"
(Adjust SL based on your risk—don’t be a reckless robber!)
🎯 TARGET: ESCAPE BEFORE POLICE BARRICADE @ 28.00!
"Take profits @ 27.50 & vanish like a ghost! 👻💰"
💣 THIEF TRADER RULES (MUST FOLLOW!):
✔ SCALPERS: Only rob LONG side! Use trailing SL to lock stolen cash!
✔ SWING THIEFS: Stack layers & escape before the blue ATR trap!
✔ NEWS ALERT! 🚨 Avoid fresh heists during high-impact news—cops (whales) set traps!
🔥 WHY THIS HEIST WILL WORK?
📈 Bullish momentum!
🔗 Chainlink whales loading!
💵 Weak dollar = MORE LOOT!
💖 SUPPORT THE HEIST SQUAD!
"Hit 👍 LIKE & 🔄 SHARE to boost our next robbery!"
"More boosts = More stolen money for YOU! 🤑🚀"
⚠️ WARNING (THIEF DISCLAIMER):
❌ Not financial advice!
❌ Risk management = Don’t get caught slippin’!
❌ Market changes fast—adapt or get REKT!
🚀 SEE YOU IN THE NEXT HEIST! STAY STEALTHY, THIEFS! 🐱👤💎
🔥 THIEF TRADER STYLE = MAX GAINS, MIN REGRETS! 🔥
(Boost this idea & let’s rob the market together!) 💰🎯🚨
LINK/USDTTechnical Analysis (LINK/USDT – 1H Chart)
Chainlink is currently trading around 23.65 after failing to hold above the short-term support. Based on the chart structure:
The price is expected to extend its decline towards the green demand zone at 22.00 – 22.20, where buyers are likely to step in.
A stop loss is placed at 21.20, just below the lower boundary of this demand zone.
From there, a potential rebound is anticipated, targeting the red supply zone at 24.30 – 24.90, which has acted as a strong resistance area previously.
Outlook:
Bearish move towards support first, followed by a bullish correction into the highlighted resistance zone.
LINK Macro signs pointing towards a buyHi,
This is a Macro analysis on the 1 Month timeframe for LINKUSD pair.
I've been looking for opportunities to trade in altcoin market. With BTC in price discovery mode and other signs appearing like altcoin only market cap charts point towards liquidity coming in, it is important now than ever to be spending time to scope out opportunities here.
I do think that not all altcoins will behave the same, im trying to use TA to find those with strong technicals.
LINKUSD sticks out due to several factors.
1. We are in an ascending channel, that i believe currently price action will eventually attempt to reach the upper trend line. (We could be at the very moment be attempting this.)
2. Momentum indicators are flashing bullish, though note that there is still a long way to go for the current monthly candle to close.
Both MACD and STOCH RSI are flashing buys in my opinion.
If our August Candle closes with:
MACD flashing histogram bar as deep green with bullish cross and
STOCH RSI flashing bullish cross and cross occurs above the 20 line.
This would indicate a potential for Macro Bullish move to the upside. ANd i believe that move to be at the very least to the previous highs, if not to new all time highs.
For the 1Month to stay bullish, we need to look for more bullish evidence such as in lower timeframes like the 1 week or 3 day to support 1 Month changes. And Bulls need to maintain dominance in those timeframes for 1 Month to print bullish.
Stay tuned for more updates.
Extreme greed - LINK weekly update August 12 - 18thFrom an Elliott Wave perspective, Chainlink is currently in Minor degree Wave 5 within Intermediate degree Wave 3. On a broader scale, LINK has completed a 1–2 structure at both the Primary and Intermediate degrees, similar to many other altcoins I have analysed recently, and is now advancing as part of Cycle degree Wave 1.
Liquidity positioning shows a substantial build-up below current price. The recent impulsive rally was largely driven by a short squeeze, as many traders opened short positions during Wave 4 and were subsequently liquidated. The order book also shows heavy order clusters above price, aligning closely with the key Fibonacci extension levels.
Funding rates, however, paint a more cautionary picture. They are currently at extremely high positive levels, while open interest has spiked sharply — suggesting that this leg higher is standing on shaky ground. Such conditions often precede volatility spikes or corrective pullbacks. Additionally, momentum indicators like the RSI are showing overbought conditions.
Given the current structure and liquidity alignment, the 1.618 Fibonacci extension remains my preferred target for the completion of this Minor Wave 5, as it coincides with a significant concentration of orders and fits the overall Elliott Wave projection. That said, the combination of overheated funding rates, elevated open interest, and extreme momentum readings warrants high caution for traders.
As always — do your own research, and trade safe.


