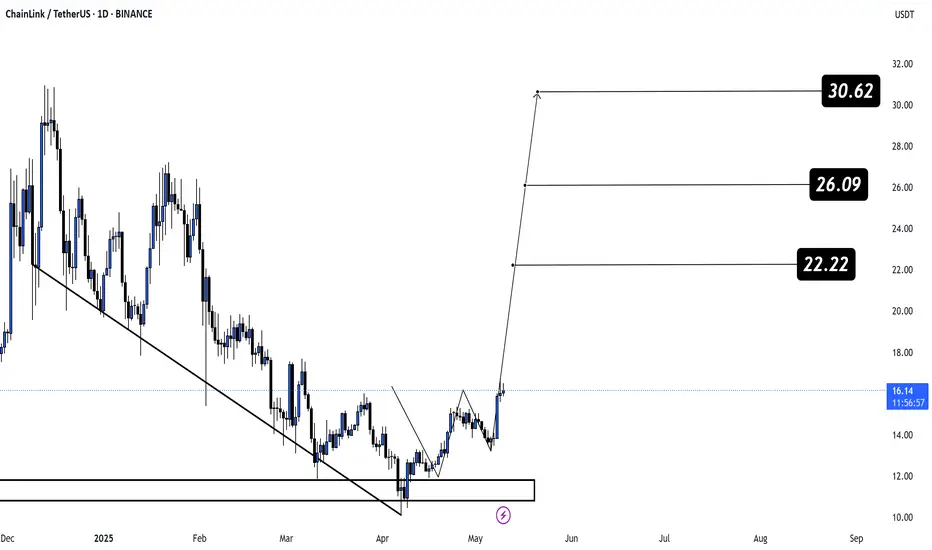
LINK — Time to Load Up!
CRYPTOCAP:LINK has just confirmed a bullish inverse Head & Shoulders breakout and smashed through the crucial $15.5 resistance — the strongest price level since late 2024!💥
This breakout unlocks massive upside potential:
🎯 Target 1: $22.22
🎯 Target 2: $26.09
🎯 Target 3: $30.62
Technicals are
TradeCityPro | LINK: Eyeing Breakout as RSI Signals Divergence👋 to TradeCity Pro!
In this analysis, I’m going to review the LINK coin. This project is one of the well-known DeFi and Cross-Chain platforms, and it's considered one of the top projects in these categories.
🔍 The LINK token currently has a market cap of $627 million and holds a ranking on CoinMar

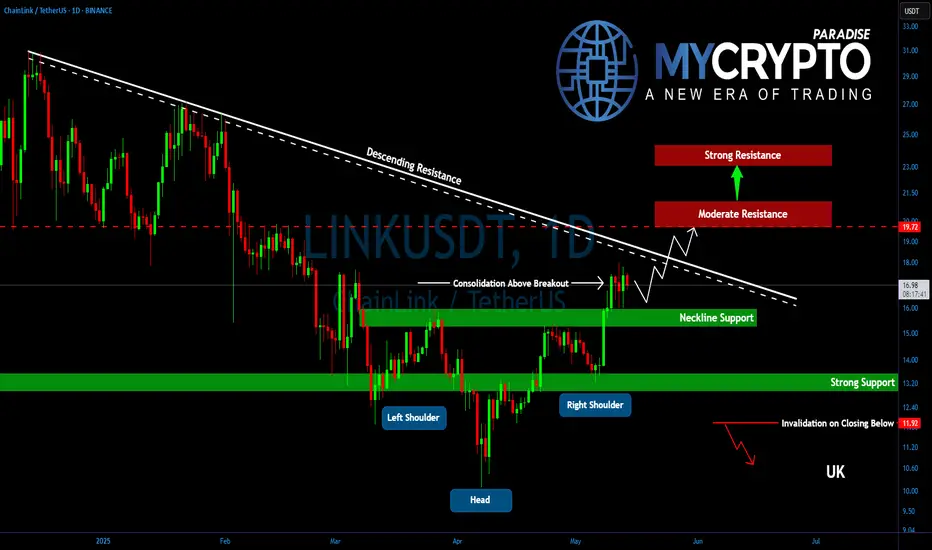
Is LINK Preparing for a Parabolic Rally? Key Levels to WatchYello, Paradisers! After completing its ABC correction, #LINK slipped into a sideways phase — but something significant is brewing beneath the surface. The recent formation of an inverse head and shoulders might be signaling the start of something much bigger.
💎LINK has now confirmed a breakout abo
LINK/USDT is Nearing The UptrendHey Traders, in today's trading session we are monitoring LINK/USDT for a buying opportunity around 15.20 zone, LINK/USDT is trading in an uptrend and currently is in a correction phase in which it is approaching the trend at 15.20 support and resistance area.
Trade safe, Joe.

LINKUSDT | Long Bias | Post-Spring Setup | (May 12, 2025)LINKUSDT | Long Bias | Post-Spring Setup + Money Flow Shift | (May 12, 2025)
1️⃣ Short Insight Summary:
Chainlink is completing a corrective phase after a strong three-wave move up. With money outflow showing on the lower timeframes, a pullback toward the $14 zone could offer a solid long re-entry.

LINK in coming Weeks ...The pattern has broken, and now I expect the price to rise to $36 . AB=CD.
previous analysis
Give me some energy !!
✨We spend hours finding potential opportunities and writing useful ideas, we would be happy if you support us.
Best regards CobraVanguard.💚
_ _ _ _ __ _ _ _ _ _ _ _ _ _ _ _ _ _ _ _

Daily down trend line just brokeOn the chart it is clear the daily candle is moving around my downward trend line meaning closing above it could lead us to new higher levels.
so here is my strategy for trade:
the price is moving into my base area trying to close above the daily trend line. if those conditions hold, then we can

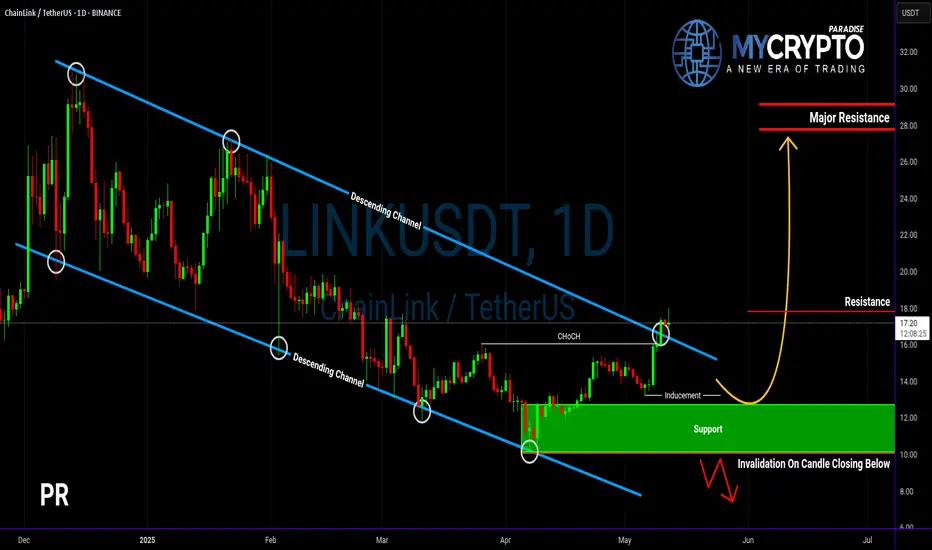
Will LINKUSDT Explode Soon — or Collapse Into a Trap?Yello Paradisers, are you prepared for the next big LINK move? The breakout you’ve been waiting for just happened — but before you jump in, let’s break down what’s really going on behind the chart.
💎LINKUSDT has officially broken out of its descending channel — a significant structural shift that i
$LINK 6H Chart AnalysisBIST:LINK 6H Chart Analysis
LINK is retesting the breakout zone from the ascending triangle.
Price is holding above key support around $16.20.
A bounce here could ignite a move toward the $22.85 target.
- Entry: CMP
- TP: $22.85/ $19.23 / 21.32
- SL: $15.26
Bullish continuation likely if supp

Chainlink Price - 12/May/2025Chanilink price has broken the Equal High Zone at 17.5$. It will retest to Order block zone (15.4$ - 15.8$) and need to break EQH ( 17.5$) again, before it visit next Equal High at 19$ zone.
Keep our eye on it. Long term focus is 100$ per coin #Chanilink #Topdifi

See all ideas
Summarizing what the indicators are suggesting.
Oscillators
Neutral
SellBuy
Strong sellStrong buy
Strong sellSellNeutralBuyStrong buy
Oscillators
Neutral
SellBuy
Strong sellStrong buy
Strong sellSellNeutralBuyStrong buy
Summary
Neutral
SellBuy
Strong sellStrong buy
Strong sellSellNeutralBuyStrong buy
Summary
Neutral
SellBuy
Strong sellStrong buy
Strong sellSellNeutralBuyStrong buy
Summary
Neutral
SellBuy
Strong sellStrong buy
Strong sellSellNeutralBuyStrong buy
Moving Averages
Neutral
SellBuy
Strong sellStrong buy
Strong sellSellNeutralBuyStrong buy
Moving Averages
Neutral
SellBuy
Strong sellStrong buy
Strong sellSellNeutralBuyStrong buy
Displays a symbol's price movements over previous years to identify recurring trends.