Chainlink 2025 All-Time High Price Projection At $130 & $82Chainlink market bottom after the last bull market happened June 2023. The orthodox end of the bear market was June 2022. Chainlink is a very strong project.
After reaching bottom in mid-2022, the pair immediately started trading sideways. LINKUSDT went sideways for an entire year—bottom consolidation/accumulation/opportunity buy zone—and finally entered a new uptrend. This uptrend is what we are witnessing up close.
After the rise in late 2023 ending March 2024 LINKUSDT settled for a wide consolidation channel with a bullish bent, with higher highs and higher lows. LINKUSDT has been moving in this channel for more than a year and we are seeing the unfoldment of a new higher high.
The way the chart is drawn, the candles and the patterns, the way the market is behaving and the rising volume are all pointing towards a major advance. It is already happening, but everything is about to speed up. It is already good, great, but it is about to get better.
The first target and immediate resistance is $35. This would produce the highest prices since November 2021 and open up the last stage of the 2025 bull market for this pair. Remember, each pair is different.
Then $82 is a strong target and very likely to be a troublesome resistance point. There can be a stop here... If my thinking is right, LINKUSDT can hit $130 in this cycle. The final target is between $82 and $130 but these might be conservative numbers.
Thank you for reading.
Namaste.
Trade ideas

Chainlink is up 160% since early April —What now?This is the perfect chart. This chart is perfect proof of where the market is at as a whole and where it is headed. Chainlink is moving higher and now trades at the highest price since January 2025.
Go a bit higher, a target of $32, and we have the highest prices since November 2021, the previous bull market. And LINKUSDT will achieve this target easily and move higher. I also predict that we are going to see a new all-time high in 2025. And this is a high probability prediction, there is just too much data in favor of.
It all starts with a low in April and then we have a higher low in June. The market goes sideways for at least four months (120 days) without any significant growth before turning extremely bullish. By the time we reach this week, the market has been green for an entire month, since 16-June.
Ethereum did something similar. A low in April followed by a small recovery then sideways consolidation. When the sideways consolidation ended the advance is still on going today and ETHUSDT almost hit a new all-time high.
Chainlink is moving forward and becoming stronger. Cardano is moving forward and many more projects are doing great. Slowly but surely, the altcoins market is starting to heat up and everything will change so fast, for the better.
One day we are buying, waiting, sharing, learning, holding and trading, the next day the entire market is up 300-500%. Then it keeps on growing.
Chainlink (LINKUSDT) is up more than 160% since its 7-April 2025 low. There is room for plenty of additional growth.
We will look at this pair again soon with 2025 all-time high projections. Make sure to follow to receive a notification when the post goes live.
Namaste.

LINK/USDT 20% CONFIRM MOVEBullish bias is strong: All major indicators (RSI, MACD, MAs) are aligned, pointing to continued upward movement.
Watch key zones: Holding above $24.7 would support further upside, while a drop to $19–$20 might offer a better entry point.
Realistic target range: $26–$28 in the short term; sustained momentum could open a path toward $30+
LINK IS ALREADY TESTING MAJOR FIB LEVEL WATCH OUT FOR RETEST ANND BUY WITH POTENTIAL TARGET of 31$ PREVIOUS HIGH. COULD MOVE UPTO $45+

link in upward mood
LINK is on an upward trajectory and has managed to achieve significant growth.
Support and resistance levels are clearly indicated on the chart.
$26 and $30 are important resistance levels."

LINK: The Sleeping Giant About to Wake Up...Hello Traders 🐺
In this idea I want to talk about LINK price targets, because I really believe that in the next 3 months we’re going to see a massive pump in the Altcoin section — and Chainlink will be one of those coins that surprises a lot of people. Let’s talk about it 👇
As you can see on the chart, LINK has formed a gigantic Triangle pattern over the years, and right now the price is sitting around the triangle resistance line. In my opinion, there’s a high chance to finally break above it — especially because ETH is currently pushing against its ATH around $4,900. If ETH manages to break above, the top 20 altcoins will most likely follow ETH as a leading indicator for the whole altcoin section.
🔑 Price Targets:
Using the Fibonacci trend-based tool (which works perfectly for triangle breakouts, especially on the log chart), we can clearly spot the most important levels for LINK.
First target: The current ATH around $53 → potential first take-profit zone.
But in my opinion, it’s too early to fully exit here. A much better target is around the 0.786 Fib level, where I would personally consider closing around 75% of my long positions, moving stop-loss to the ATH ($53), and letting the rest ride for even higher targets.
And as always, my friends, remember our golden rule:
🐺 Discipline is rarely enjoyable, but almost always profitable. 🐺
🐺 KIU_COIN 🐺

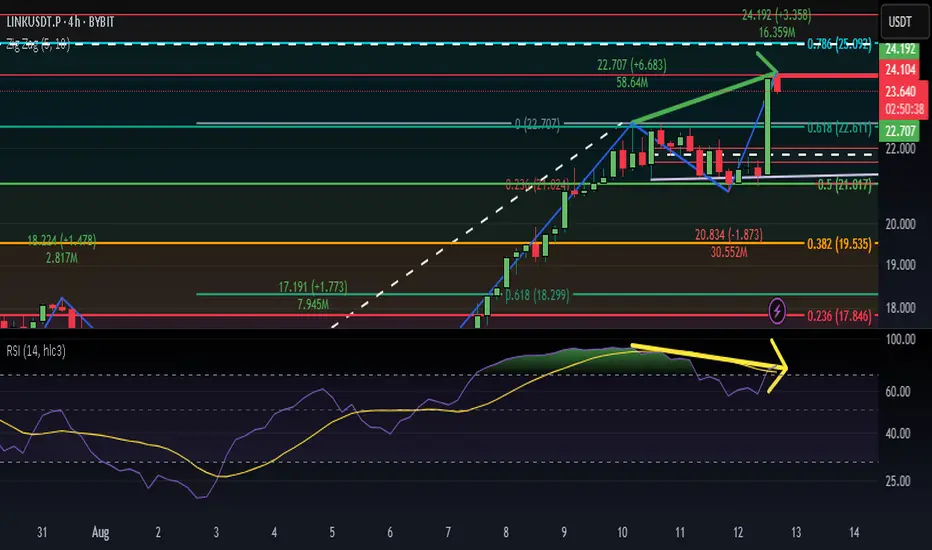
LINK Rally Cools Off — Next Long Opportunity at $20LINK has awakened with strength, rallying +60% in just 10 days. Price completed a clean 5-wave Elliott impulse, topping at the 1.0 trend-based Fib extension, which aligned with:
0.702 Fib retracement
Pitchfork upper resistance line
Key resistance zone
This perfect confluence marked the 5th wave top, followed by a -13% correction.
🔴 Short Opportunity
The current structure is forming a Head & Shoulders pattern.
➡️ Resistance zone: $23 – $23.5
🧩 Confluence factors:
Anchored VWAP (red line) from the 5th wave top
Fib speed resistance fan – Golden Pocket
➡️ Target: $20 support zone.
🟢 Long Opportunity Zone
The $20 zone offers the strongest confluence for a long entry:
Yearly Open (yOpen): $20.02
0.5 Fib retracement: $20.09 (of the 5 Elliott waves)
Pitchfork golden pocket
Anchored VWAP (green line): $20.28 (swing high)
Fair Value Gap (FVG) / imbalance fill
Liquidity pool
$20 psychological level
Trade Plan:
Entry: $20.5 – $19.5
Stop Loss: Below $19
Take Profit: $25
Potential gain: +25%
R:R: ~1:5
🔍 Indicators used:
DriftLine — Pivot Open Zones → For identifying key yearly/monthly/weekly/daily opens that act as major S/R reference points
➡️ Available for free. You can find them on my profile under “Scripts” and apply them directly to your charts for extra confluence when planning your trades.
_________________________________
💬 If you found this helpful, drop a like and comment!

Short LinkI am Stiller bullish on crypto alts, but i think link will make a LH then continue to uptrend

LINK 1D – Pullback Toward Demand Zone in UptrendLINK has pulled back from descending resistance after an aggressive rally, with price now approaching the $19–$20 demand zone that aligns with ascending trendline support. A bounce here could set up another attempt at the $24–$25 descending resistance, where a breakout would open targets toward $28+. Failure to hold the demand zone risks a deeper retracement toward the $16–$17 area. Stoch RSI remains elevated but is beginning to roll over, signaling that momentum could cool before the next leg.

LINK/USDT - LONGdaily chart analysis highlights strong bullish momentum, marked by a sharp upward move. The price is expected to perform a pullback to the 18$–15$ support zone before resuming its bullish trend, potentially reaching 27$–32$.
Chainlink correctionIn my view current short term correction could stop @ 17,9$ area where bullish trend could restart to target 33-34$ area

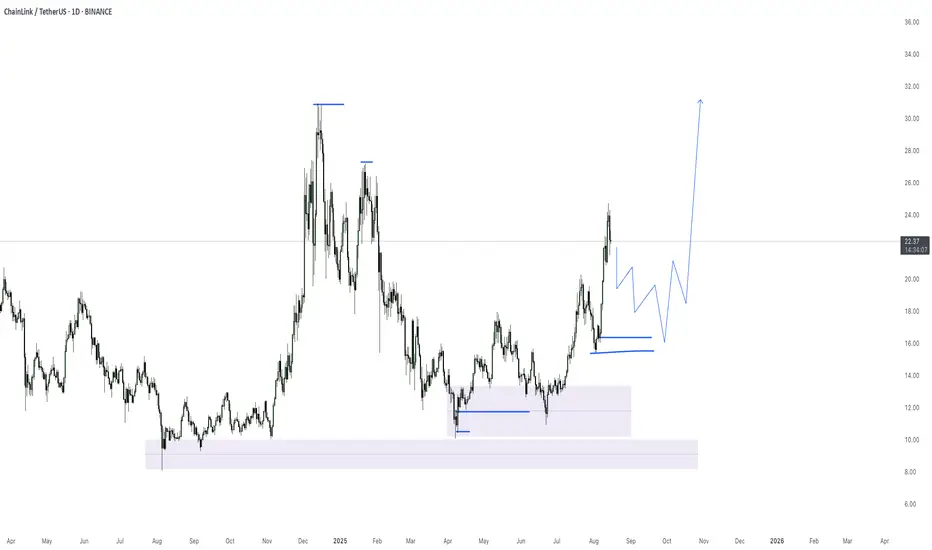
Chainlink Bullflag on Weekly ChartA huge bullflag pattern has formed on the weekly chart, if this breaks to the upside we could be looking a face melting targets, with the most bullish targets exceeding $1000.
I've added horizontal ray lines with highlighted price targets to the left, colour coded to the corresponding price range. Once the price breaks out of the triangle, I've also added a confirmed breakout level, which is the previous resistance line touch point.
Hopefully this plays out and we'll all buying yachts :)
LINK to 1000 USDTChainlink (LINK) is setting up for a major breakout. Based on my technical analysis, the current market structure and momentum indicators suggest an accelerated move toward the $1,000 level is on the horizon. Key support holds strong, volume patterns are aligning with historical rally setups, and macro sentiment in the crypto space is turning bullish. This idea outlines my chart-based reasoning for why LINK could reach four figures sooner than many expect.

$LINK / USDT – Indicators Not Maxed, Big Picture Thinking.ChainLink is hovering just above Buy Zone 2 — price hasn’t tapped it yet, but it's close. This zone around $13.21 to $12.50 remains the key area of interest. If the market gives us that dip, it could be a solid spot for high-conviction entries.
Looking at the 3D timeframe, indicators like the MACD, stochastics, and other oscillators are nowhere near overheated. We’re not seeing blow-off tops or maxed-out momentum — which tells us this market still has room to run. At the same time, it’s not “cheap” forever.
If you're thinking longer-term, this is the kind of setup where reasonable, staggered accumulation makes a lot of sense — especially in utility-heavy, fundamentally proven projects like ChainLink. You don’t need to go all-in, but building exposure in anticipation of a reaction from these zones is a rational approach.
Key Levels:
🟢 Buy Zone 2: Untouched, watching $13.21–$12.50
🟢 Buy Zone 3: $11.95–$10.00 (big bids if BTC corrects)
🔴 TP1: $15.15
🔴 TP2: $19.50
🎯 Final Target: $22.25–25.00
📈 We may not have the entry yet — but the structure is shaping up.
📡 Follow @BahtMover on X for real-time entries, updates, and volume-driven setups.

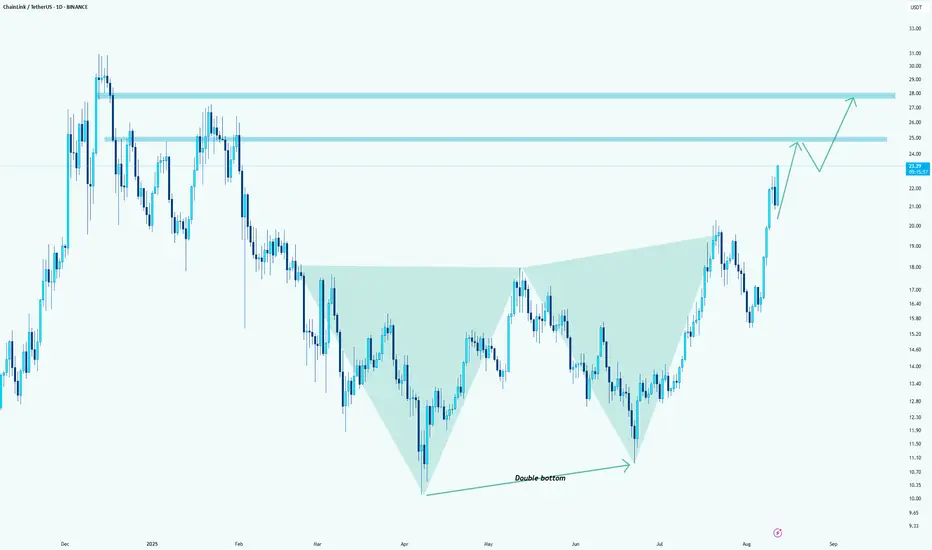
Link: it formed a double bottomHello guys.
Link formed a double bottom and a divergence at the same time!
You can count on longs here.
Target1: 25
Target2: 28
The pressure from buyers is high! I hope you can get it on the pullbacks
LINKUSDTThis chart is in a bullish trend, but it broke a new high at $22.7. If BINANCE:LINKUSDT can keep the price above $20, we can expect it to reach a higher high.
Please control risk management.⚠️

LINK 4H – Holding Above $21 Support After BreakoutChainlink surged above the $21 resistance, flipping it into support and consolidating near $23.80. The breakout aligns with strong bullish momentum from early August, with the $21 zone acting as a key defense area for bulls. Stoch RSI is mid-range, leaving room for further upside if momentum picks up. A push above $24.50 could target $26, while losing $21 risks a pullback toward the $15–$16 support region.

Chainlink Wave Analysis – 12 August 2025- Chainlink broke the resistance zone
- Likely to rise to resistance level 26.00
Chainlink cryptocurrency recently broke the resistance zone between the round resistance level 20.00, the resistance trendline of the daily up channel from April and the 50% Fibonacci correction of the downward impulse from December.
The price just reversed up from this price zone (acting as the support zone after it was broken) and continues to rise inside the active impulse wave (3).
Chainlink cryptocurrency can be expected to rise further to the next resistance level 26.00, which is the former strong resistance from January.

i see divegenceif 24.1 is one of the top a HH i see a devigence beetven rsi and price action i think 23 is support and 24.2 is resistance what you think??
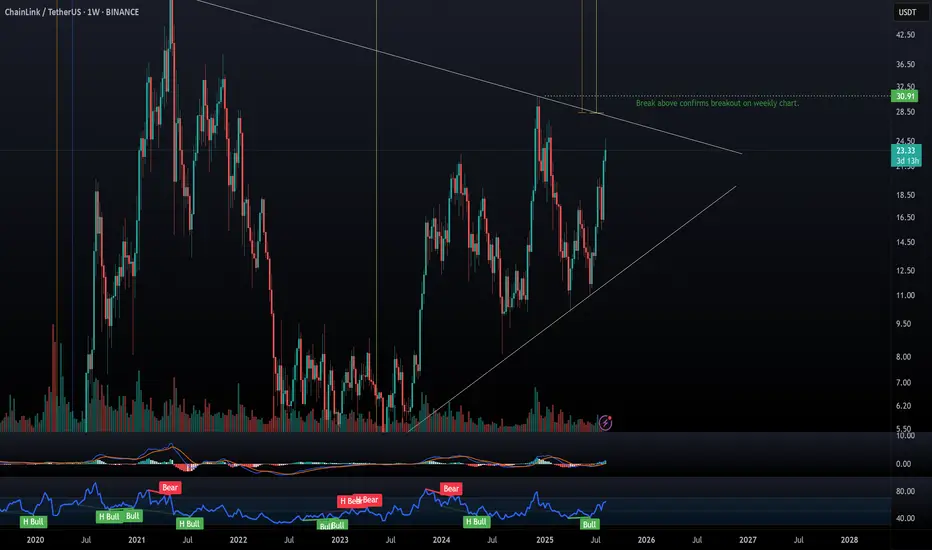
Why I'm long on LINK 3 reason backed by chart LINK/USDT – Monthly Chart Analysis
Chainlink is currently testing a multi-year resistance line that has capped price since the 2021 peak. The asset has been forming a large ascending triangle pattern with higher lows since mid-2022, showing accumulation pressure building up.
Resistance Zone: $27–$35
Current Price: $23.94
Support Trendline: Holding strong since 2019 lows
Structure: Bullish compression into resistance
Key Takeaways:
A monthly close above the resistance line could trigger a breakout towards $35–$50 in the medium term.
Until the breakout is confirmed, expect possible rejections and retests of the $20–$21 zone.
The risk/reward is attractive for spot investors looking for a breakout play.
📌 Watch the monthly close carefully — confirmation above resistance could mark the start of a strong LINK rally.

Chainlink (LINK): Break of Structure | Looking For 35% Push Chainlink has done pretty well; in the first BOS we failed to maintain the price above the area, yet we had a good bounce from EMAss, where buyers showed once again the dominance and now the price is back in another BOS.
We are looking for another 35% of market price movement from here, with the price near BOS being our DCA zone, in case we fall.
Swallow Academy

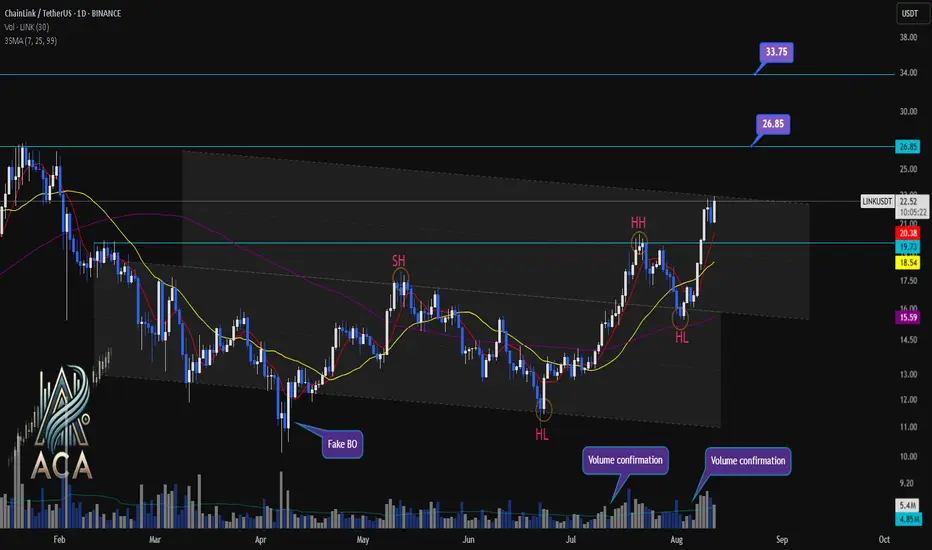
CHAINLINKUSDT Daily Chart Analysis | Channel BreakoutCHAINLINKUSDT Daily Chart Analysis | Channel Breakout & Bullish Momentum
🔍 Let’s dive into the ChainLink/USDT spot chart, analyzing key swings, channel dynamics, and fresh momentum signals for a bullish scenario.
⏳ 1-Day Overview
The daily chart shows LINKUSDT surging toward the RR1 (Risk-Reward 1) of its channel pattern, marked by powerful volume confirmations that help validate the move. Price has decisively broken above prior resistance zones and continues to print higher highs (HH) and higher lows (HL). The chart’s swing structure is clear: a series of ascending pivots signaling a bullish reversal from past lows.
🔺 Channel, Swings & Momentum:
- Price action is respecting the well-defined channel; current breakout and move to RR1 highlights bullish control.
- Swings are established: recent HL and HH confirm upward structure.
- Volume spikes on breakouts further confirm buyer strength, supporting the move out of consolidation.
- 3SMA (7, 25, 99) alignment shows short- and medium-term averages crossing above the long-term trend—often a leading indicator for the start of a strong uptrend.
- Next targeted levels stand at $26.85 and $33.75, while the long-term target remains a fresh All-Time High (ATH), should momentum persist.
- Past “Fake BO” (breakout) risk now superseded by true volume-backed move supported by technical confirmations.
📊 Key Highlights:
- Channel breakout with confirmation at RR1, swing HH/HL structure for bullish momentum.
- Volume surges on upward moves—critical for authenticating breakout strength.
- 3SMA configuration points to the potential beginning of a major trend extension.
- Upside targets: $26.85 for the next level, $33.75 as extension, and new ATH as the bold long-term bull case.
🚨 Conclusion:
ChainLink’s breakout above channel resistance signals bullish intent with strong volume and swing confirmation. Eyes on next targets: $26.85 and $33.75. If volume and trend continue, new ATH is on the horizon.
LINKUSDT 4H BULLISH SETUP. LINKUSDT | 4H Bullish Setup
✅ Price broke structure and created a clean FVG + Retest POI just below current levels.
✅ SSL liquidity resting near the demand zone.
🔍 Price is pulling back and may tap into 20.50 – 20.80 POI/FVG zone for demand mitigation.
📌 Trade Idea: Wait for price to reach POI and confirm bullish signals before entering.
🎯 Potential upside continuation after liquidity sweep.

chainlink short to $20.29Just now opened up a short position on chainlink. Aiming for $20.29 based on dtt analysis.
Scaling out 70% at $20.48
Full close at $20.29
Sl: 22.04
Sized up a bit as this trade is higher probability than normal
