LINKUSDT UPDATE#LINK
UPDATE
LINK Technical Setup
Pattern: Falling Wedge Pattern
Current Price: $13.15
Target Price: $19.50
Target % Gain: 50.40%
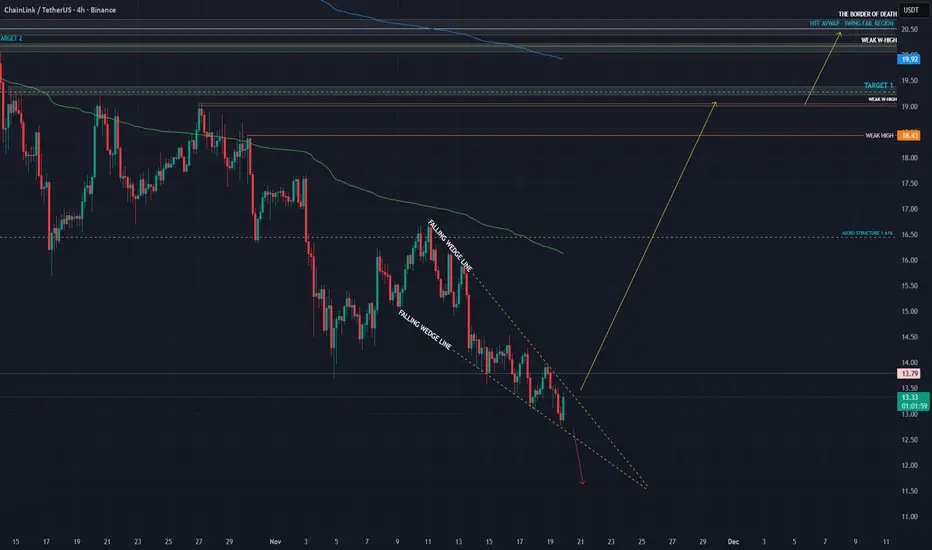
Technical Analysis: LINK is breaking out of a falling wedge pattern on the 4H chart, signaling a potential bullish reversal. Price has pushed above the descending resistance trendline and is holding above the breakout zone, indicating improving bullish structure. If momentum continues, price is likely to expand toward the upper resistance and measured move target zone shown on the chart.
Time Frame: 4H
Risk Management Tip: Always use proper risk management.
Trade ideas

LINKBIST:LINK is setting up for a move of more than 350 percent in the short term and that is only the first target. Price action is compressing inside the triangle and momentum is building. Imagine what the second target will be once this breakout fully unfolds.

LINK USDT SHORT SIGNAL---
📢 Official Trade Signal – LINK/USDT
📉 Position Type: SHORT
💰 Entry Price: Market
---
🎯 Take-Profit Targets (Partial Exits):
• TP1: 12.550
• TP2: 12.310
• TP3: 12.157
• TP4: 11.966
• TP5: —
• TP6: —
---
🛑 Stop-Loss: 13.10
📊 Timeframe: 15m
⚖️ Risk/Reward Ratio: 2.8
💥 Suggested Leverage: 5× – 10×
---
🧠 Technical Summary
LINK is showing bearish pressure with clear weakness on short-term structure.
A market entry aligns with downside liquidity levels at 12.55 → 12.31 → 12.157.
As long as price stays below 13.10, bearish continuation remains probable.
---
⚙️ Trade Management Rules
✔ Partial exit at TP1
✔ Move SL to Break-Even after TP1
✔ Trail SL into higher targets
✔ If SL is hit → no re-entry
✔ Confirm structure before entering
---
📌 TradingView Hashtags
#LINKUSDT #LINK #CryptoSignal #ShortSetup
#TradingView #FuturesTrading #Altcoins #TA
---

Will LINK recover after the information about the ETF?📌 1. Main trend
• A clear downward trend, confirmed by a strong, long-term downward trend line (black).
• The price is testing this line from below for the first time in a long time → a key moment.
If the price breaks it and retests, the trend structure changes.
⸻
📌 2. Current situation
Price currently: ~13.02 USDT
Upcoming levels:
Support
• 12.71 – local support (yellow line).
• 11.75 – strong support, here a demand reaction appeared.
• 9.95 – the greatest support on the chart (red line).
Resistances
• 1:30 p.m.–1:50 p.m. – trend line test; key resistance.
• 15.25 – the first significant resistance in the upward trend.
• 17.78
• 19.77
• 21.70
⸻
📌 3. Stoch RSI (at the bottom of the chart)
• The oscillator is high, approaching the overheating zone (80+).
• This signals a possible short-term correction, unless the downtrend breaks out - then it may stay high for a long time.
⸻
📌 4. Key setup
🔵 Bullish (upward scenario)
Confirmation of growth appears only if:
✔ The price will break the black downtrend line
✔ Will close the 12H candle above approximately 1:50 p.m
✔ Will retest and bounce up
Targets after breakout:
1. 15.25
2. 17.78
3. 19.77 - only here it will encounter stronger resistance
⸻
🔴 Bearish (downside scenario)
If the price does not break the trendline and is rejected ↓:
❗ Downside targets:
• 12.71 (local support – first test)
• If it breaks → 11.75
• And in case of market panic → 9.95
The latter is a powerful level - the level of accumulation from earlier months.
⸻
📌 5. What looks best?
Currently:
• The market rebounded from the support at 11.75 – healthy demand response.
• However, the price is below a strong trendline, so this is a place where it may be rejected.
➡ If I were to indicate the most likely short move:
Light correction → retest 12.71 → decision.
⸻
📌 6. Summary
• A key moment for LINK - it decides to break the downward trend.
• Only a close above 1:50 p.m. gives a real upward signal.
• Failure to break the trendline = possible return to 12.71 → 11.75.

LINKUSDT 1D#LINK is moving inside a falling wedge pattern on the daily chart and has bounced off a strong support zone. Consider buying a small bag here and on the support. If price breaks above the wedge resistance, the potential upside targets are:
🎯 $14.21
🎯 $15.82
🎯 $17.12
🎯 $18.42
⚠️ Always remember to protect your capital with a proper stop-loss and disciplined risk management.

LINKBIST:LINK is holding support extremely well and the structure looks strong. If an ETF gets approved, it will be the catalyst that sends price breaking out and reaching the target with ease. Momentum is building and the chart is primed for expansion.

Long trade
Trade Journal Entry
Pair: LINKUSDT.P
Trade Type: Buyside Trade
Date: Sat 22nd Nov 25
Time: 3:00 pm
Session: NY Session PM
Timeframe: 15 min
1. Trade Parameters
Entry: 11.975
Profit Level: 12.922 (+7.99%)
Stop Level: 11.922 (−0.43%)
Risk-to-Reward: 18.06 R
2. Context & Structure
The setup follows a three-session accumulation sequence (Tokyo → London → NY), forming a descending wedge within the discount range of the prior bearish leg.
The London session sweep of liquidity below 11.80 marked the final inducement before NY expansion.
The Daily Open acted as a midpoint magnet where price consolidated before displacement.
BOS (Break of Structure): confirmed on NY PM session with clear displacement above the Asian high.
EMA alignment:
50 EMA crossed above 200 EMA, signalling intraday structural reversal.
Both EMAs now serve as dynamic support zones.
3. Liquidity Story & Smart-Money Model
The sell-side liquidity beneath the 11.70–11.80 range was swept before bullish expansion.
Imbalance/FVG blocks between 11.83 – 12.18 were efficiently filled on the breakout, leaving new unmitigated FVGs below for potential re-entries.
PD Array narrative:
The price transitioned from a discount (accumulation) to equilibrium, with current targets aimed at premium inefficiencies (12.80–12.95). Multiple internal FVGs (12:18 → 12:45 → 12:68) act as continuation stepping zones.
4. Wyckoff / SMC Alignment
Wyckoff Phase Observation ICT / SMC Equivalent
Phase C London sweep of the range lows, Liquidity inducement
Phase D NY displacement through range high Break of Structure (BOS)
Phase E Retest of bullish order block & continuation
FVG + OB confluence entry
5. Volume & Confirmation
Noticeable increase in volume during the breakout of the wedge — signalling institutional participation. Volume distribution shows progressive expansion on bullish candles and contraction on retracements, consistent with smart-money accumulation → expansion behaviour.

link spot planssimilar to many altcoins ex like LTC who are in the last stages of their triangle completion I just love trading these patterns on HTF
supports and tps are mention in the chart

LINKBIST:LINK is sitting on major support and the structure looks primed for a strong move. In the very short term there is a potential 400 percent gain from the current price once momentum shifts. This is a high quality entry zone.

Types of delivery pricesUnderstanding the conditions in which the price is at the moment gives us the context within which we will use the tools.
Its just a 4 most common price moves on a charts what you can find on different timeframes
Expansion - It's an impulse growth or fall in the price.
Reversal - Change in the direction of price movement, opposite to the trend
Correction - It's a movement within the structure
Consolidation - Sideways price movement; conditions under which it is impossible to clearly define the direction
The first thing to define before opening a position is the context.
Taking into account the structure and liquidity zones, determine where the price is now and where it is most likely to go.
When the direction is clear, look at the points of interest (POI) from which you can expect a reaction. Inside the zone of interest, we are waiting for confirmation to enter the position.
Confirmation is a change of structure in a later period, which confirms the validity of the POI.
Thanks for reading

LINK TECHNICAL ANALYSIS — 1D📊
1. MARKET STRUCTURE
Long-term trend
The price is currently approaching this line, but has not yet tested it directly.
This is a key support level for the entire LINK market.
2. SUPPLY & DEMAND ZONE
Demand Zone — $9.6 – $4.8
The large red area. This is
a historical accumulation zone,
an area where LINK has been repeatedly defended,
an area to which the price has returned with each major dump.
Supply Zone — $15 – $20
The green area from which:
the price has been rejected repeatedly,
this is the selling wall from 2021,
a key target for bulls after the rebound.
3. CRITICAL LEVELS
Very important support
Type Level Description
Trendline ~11.5–12.2 USD We are very close to a test.
Horizontal 9.63 USD First major historical support.
Horizontal 4.84 USD Final low (strongest demand).
If the trendline breaks, the → ** LINK will almost certainly fall to 9.63**, and if that breaks too, → 4.8 USD is very likely.
4. MOMENTUM – STOCH RSI
On the Stoch RSI chart:
is extremely oversold,
similar to previous lows (2023, 2024),
signaling the possibility of a rebound within a few days/weeks.
5. PRICE SCENARIOS
🟢 BULLISH (bounce)
Condition: Maintaining the trendline
Expected movements:
Bounce around 11.5–12.5
Target 1: USD 15
Target 2: USD 18–20
Possible breakout → USD 22–24
This scenario is realistic if Bitcoin doesn't make another strong dump.
🔴 BEARISH (falling)
Condition: Breakout of the trendline with a daily candle below ~11.5
Expected movements:
A quick drop to USD 9.63
This could result in:
a bounce to ~12
or a continuation of the decline
If 9.63 falls → a practically certain target of USD 4.8
This level represents a significant historical accumulation and will not fall without a fight.
➤ Price is currently hanging by a thread.
The trendline is one of the most important support levels on the LINK chart.
Momentum is oversold → signal for a short squeeze/bounce.
But the local structure remains bearish.
➤ If the trendline holds → a thick long swing.
➤ If it collapses → we fall to 9.63 and possibly 4.8.

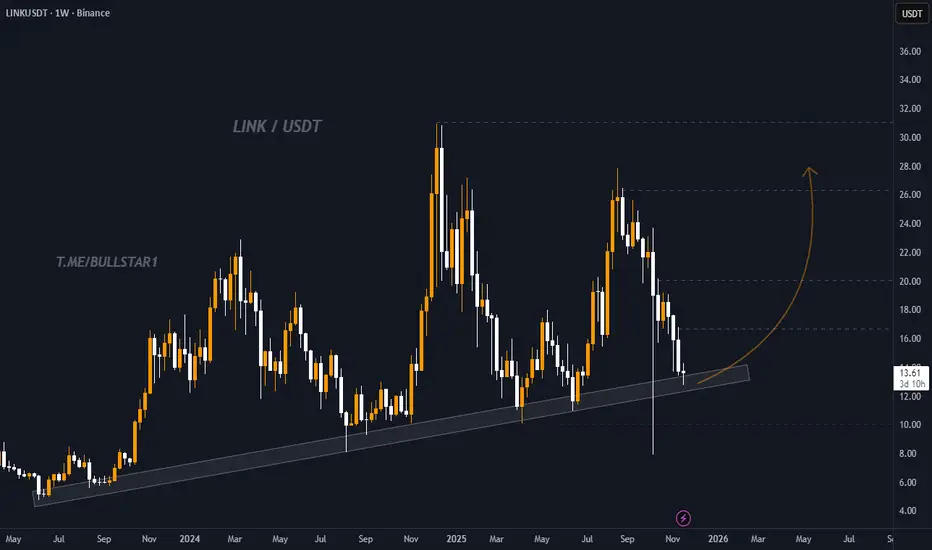
Chainlink at Weekly Trendline Support, Preparing for a Strong ReChainlink is currently retesting a long term weekly ascending trendline that has acted as a major support area since mid 2023. Every time price has touched this trendline in the past, it has generated a strong bullish reaction.
Price has once again returned to this key level around the 13 zone, showing early signs of stabilization. As long as the weekly structure holds above the trendline, LINK maintains a bullish macro outlook.
I expect a gradual rebound from this support area, followed by continuation toward the next major resistance levels. The bullish scenario becomes stronger if weekly candles close above recent local highs.
Key levels to watch on the upside are near 18, 22 and 26. A breakdown below the trendline would invalidate the setup and open the door to deeper downside, however the current structure favors the bulls.
This idea is based on long term trendline support, higher timeframe structure, and the repeated historical reaction from this level.
LINK USDT LONG SIGNAL📢 Official Signal – LINK/USDT
📈 Trade Type: LONG
💰 Entry Point:
13.589
🎯 Targets (with withdrawal management):
TP1 = 13.827
TP2 = 14.108
TP3 = 14.367
TP4 = 14.685
TP5 = —
TP6 = —
🛑 Stop Loss. 13.190
📊 Timeframe: —
⚖️ R/R: 3.2
📌 Recommended Leverage: 5x or 10x
⚠️ Money Management Required — Please Enter After Checking the Chart
📌 Very Important Explanation About Risk Management
✔️ As soon as the price hits the first target (TP1), the stop loss is moved to the entry point.
This is a standard risk management rule to protect capital.
❗ Therefore, it is normal that sometimes after reaching the first target, the price will reverse and hit the stop at the entry point.
This is not considered a failure; it means that the trade has been closed without loss and the risk has become zero.
🔐 Our goal is always to preserve capital before making big profits.
---

LinkEntry Zones (WHERE TO BUY):
Tier 1 - IMMEDIATE BUY (Current Zone):
$13.20-$13.80 ←
Allocation: 40% of capital
Rationale: On-chain data confirms accumulation at these levels
Tier 2 - AGGRESSIVE BUY:
$12.50-$13.20
Allocation: 35% of capital
Rationale: Bottom support + stronger confluence
Tier 3 - MAX ACCUMULATION:
$11.80-$12.50
Allocation: 25% of capital (reserve)
Rationale: Unlikely but would be extreme value
Risk Management:
Stop Loss: Daily close below $11.50 (invalidates bullish thesis)
Take Profit Targets:
TP1: $15.08 (+10%)
TP2: $18.20 (+32%)
TP3: $22.00-$24.00 (+60-75%)

CHAINLINK - LOADING A SUPER SWEEP UP! - Traders,
In my last $CHAINLINK analysis
I wrote out two scenario’s.
Scenario 1 did not play out. Scenario 2 was simple: a dump into the next 1.618 extension, and from there the hunt for a fresh long setup begins. That 1.618 was at 12.90$
And here we are.
Pixel perfect.
So are we wrong? This is why having your levels outlined and being patient matters more than anything. When one path closes, structure reveals another. The chart always speaks.
But only those who wait can hear it.
What we are looking at
$CHAINLINK dumped straight into the 12 to 13 dollar zone.
This zone is not random. It is technically one of the most important pockets on the chart.
Let’s break down why.
Mathematical Levels – The Spot Chart
To avoid distortion caused by the 10 October liquidation wick, we start with clean mathematical levels on the spot chart.
At 12.886 we have the high timeframe 0.886 Fibonacci retracement. This is the deep retrace zone where momentum often shifts. Price tends to exhaust here because 0.886 represents the final Fibonacci rotation before structural invalidation. It is where the last sellers usually throw in everything they have.
At the same time, this level lines up with the 1.618 extension of the first structure after the 10 October crash. The initial high to low is marked with a yellow arrow in your chart.
This means one thing:
The downside auction has mathematically completed.
Both the retracement leg and the extension leg have landed in the same pocket.
This is real confluence.
The HTF AVWAP Confluence
Chart:
On 06 August 2024, LINK printed a new significant low.
This low kicked off a bullish wave with strong volume behind it.
That wave marked the beginning of a long uptrend, which means the AVWAP anchored to this low carries real weight.
Now here is the fascinating part:
The lower band of the anchored AVWAP aligns perfectly with:
The HTF 0.886 retracement
The 1.618 extension
The current price zone
The mathematical exhaustion pocket
This is not normal.
This is precision level confluence.
What this means
When AVWAP, Fibonacci, and wave extensions align, it signals that institutional cost basis, market memory, and auction math are all pointing to the same zone as fair value.
This is where smart money steps in.
Falling Wedge – The Technical Cherry
The final ingredient:
LINK has printed a clean, textbook falling wedge.
A falling wedge is a bullish reversal pattern where momentum compresses and the final sellers run out of strength. It represents exhaustion, not continuation.
Combine that with AVWAP, Fibonacci, and mathematical symmetry, and you have a powerful structural reversal setup.
Order Flow Confirmation
The order flow confirm the technical story:
Spot CVD has been trending down, but price is no longer following with the same intensity.
Stablecoin and coin margined CVDs are still pushing lower, but again, price is resisting the pressure.
Open Interest increased into the lows. New shorts opened into exhaustion.
Funding remains small and neutral.
Price is holding the key zone.
This is absorption. When shorts push and price refuses to break, the market is loading a spring.
Conclusion
The 12 to 13 dollar range is not random noise.
It is a high timeframe confluence zone made of:
The 0.886 Fibonacci retracement
The 1.618 extension completion
The lower AVWAP band from the August trend origin
A falling wedge structure
Order flow absorption
New shorts entering into weakness
LINK is setting up for a powerful sweep if this zone holds.
Targets.
$19.30
$20.50
$38.00 if we move higher.
Breaking out of the wedge pattern invalidates the idea.
--------
The chart is whispering again. Patience turns whispers into signals.
--------
If you like this kind of analysis, drop a like and leave a comment. Everything here is shared for free so more people can cut through the noise and finally see what is actually happening under the surface. No hopium. No fear. Just real data, real structure, and real order flow.
The goal is simple. To help traders stop guessing and start understanding what the market is actually saying.
Stay sharp.
Stay objective.
And remember… the chart whispers long before it speaks.
- ThetaNomad
LINKUSDT: Long Setup on Major Support Retest - Targeting $21!Chainlink (LINK) is entering a critical support zone between $13.00 and $14.00, a level that has previously acted as a strong base for bullish reversals. Price action is showing signs of slowing down its downtrend, and we're now closely watching for stabilization or reversal signals before entering a spot long position.
📌 Entry Zone: $13.00 – $14.00
🎯 Take Profit Targets:
• TP1: $15.50 – $16.50
• TP2: $19.00 – $21.00
🛑 Stop Loss: $12.50

CHAINLINK buy time!!!CHAINLINK hits its lowest in the final quarter of the year, and it is time to buy. The price will varies until at least the end of next year before it goes to higher highs.

LINK USDT LONG SIGNAL---
📢 Trade Signal – LINK/USDT
📈 Position Type: Long
💰 Entry Price: 13.420
---
🎯 Take-Profit Targets (Partial Exits)
TP1 = 13.40
TP2 = 13.78
TP3 = 14.180
TP4 = —
TP5 = —
TP6 = —
---
🛑 Stop-Loss: 13.00
📊 Timeframe: —
⚖️ Risk/Reward Ratio: 2.0
💥 Suggested Leverage: 5× – 10×
---
🧠 Technical Analysis Summary
LINK is reacting from a strong support zone near 13.00 – 13.20, forming a bullish short-term structure.
Price is holding above local liquidity and showing signs of reclaiming the mid-range level around 13.40.
Momentum indicators are signaling early bullish continuation, with room to expand into the resistance cluster at 13.78 – 14.18.
A clean break and hold above 13.78 can trigger stronger upside.
---
⚙️ Trade Management
Take partial profit at TP1
Move SL to Break Even after TP1 hits
Trail stop gradually if price moves toward TP2/TP3
Avoid re-entry if price breaks below 13.00
---
⚠️ Disclaimer
This signal is for educational purposes only. Always manage risk properly.
---
📌 Hashtags for TradingView
#LINKUSDT #Chainlink #CryptoSignal #TradingView #FuturesTrading #Altcoins #TechnicalAnalysis
---

Chainlink (LINK): Looking For Bullish Breakout From 100EMALINK is hovering near a key support area, not sitting firmly on it yet. For now we’re watching if buyers can take back control over this zone and give us a clear MSB. Only after that, a breakout through the 100 EMA would make sense for a long, with the main focus on that unfilled zone above. If this area gets lost instead, the whole idea is off the table.
Swallow Academy

LINKBIST:LINK is approaching a major support level and the structure has been holding strong. From the current price, the setup supports a potential 300 percent plus move once momentum shifts. This is a high quality zone for strategic positioning.


Lingrid | LINKUSDT Bearish Momentum ContinuesThe price perfectly fulfilled my previous idea . BINANCE:LINKUSDT is sliding lower after failing to reclaim the mid-range resistance near 15, keeping price capped beneath the descending trendline. The structure remains firmly bearish with a clear downward channel guiding lower highs and lower lows. As long as price stays under the 15.00 rejection zone, the outlook favors continuation toward the 11.35 support area. Broader momentum still leans to the downside as compression breaks are consistently resolving lower and sellers maintain control.
⚠️ Risks:
A sudden reclaim of 15.00 could invalidate the channel-driven bearish outlook.
Strong BTC recovery may lift overall market sentiment and reduce downside pressure on LINK.
Upcoming macro data or unexpected market volatility could trigger short-term squeezes against the trend.
If this idea resonates with you or you have your own opinion, traders, hit the comments. I’m excited to read your thoughts!

LINKBIST:LINK has come down to support and the price action is starting to compress inside the triangle. This is a strong setup and short term there is a potential 300 percent plus gain from the current price once the breakout triggers.
