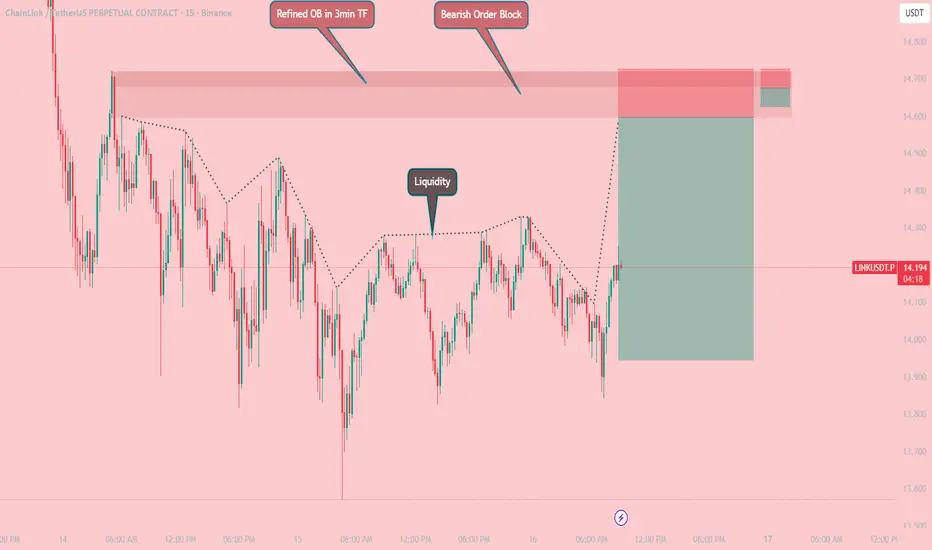
AVAXUSDT – Bearish Order Block + Liquidity Sweep Setup (SMC AnalMarket is clearly in a downtrend, continuously forming impulsive drops followed by corrective pullbacks. Price recently created Equal Highs and Equal Lows, which act as visible liquidity pools.
A Major Pullback Order Block is identified at:
Bearish OB (15m): 14.721 – 14.594
To improve precision and maximise probability, the OB is refined on the 3-minute timeframe to:
Refined OB (3m): 14.721 – 14.676
This refined zone aligns with a premium area of the range, making it a high-probability entry for a short setup. Price is expected to tap into the refined OB, sweep liquidity above equal highs, and then continue the downtrend.
📉 Trade Setup – SHORT
Entry: 14.676
Stop Loss: 14.726
Take Profit: 14.626
Trade ideas
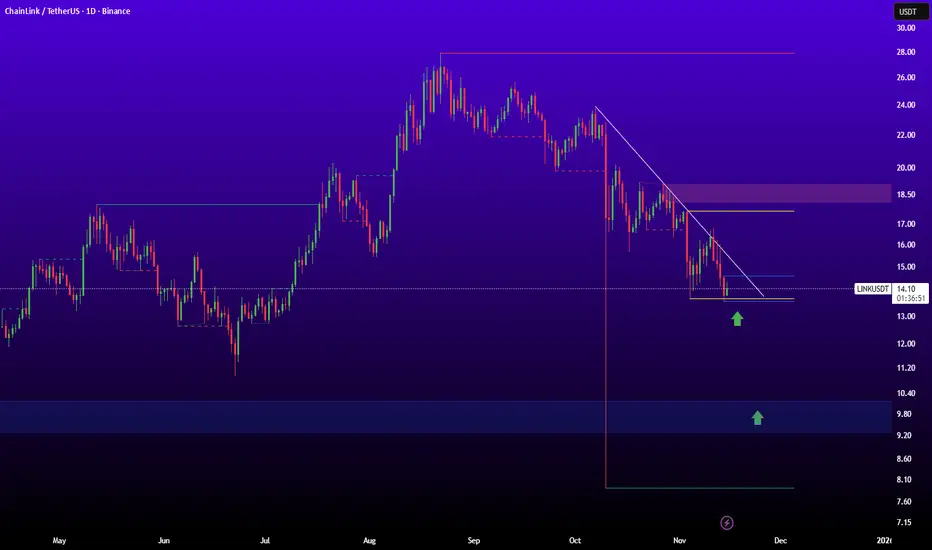
LINKPrice is still trading below the descending trendline, and the lower highs and lower lows structure suggests bearish momentum remains dominant. If the 14 دلار support breaks, the move toward 12.50 دلار becomes likely, while a breakout above the trendline may open the path to 15.30 دلار.
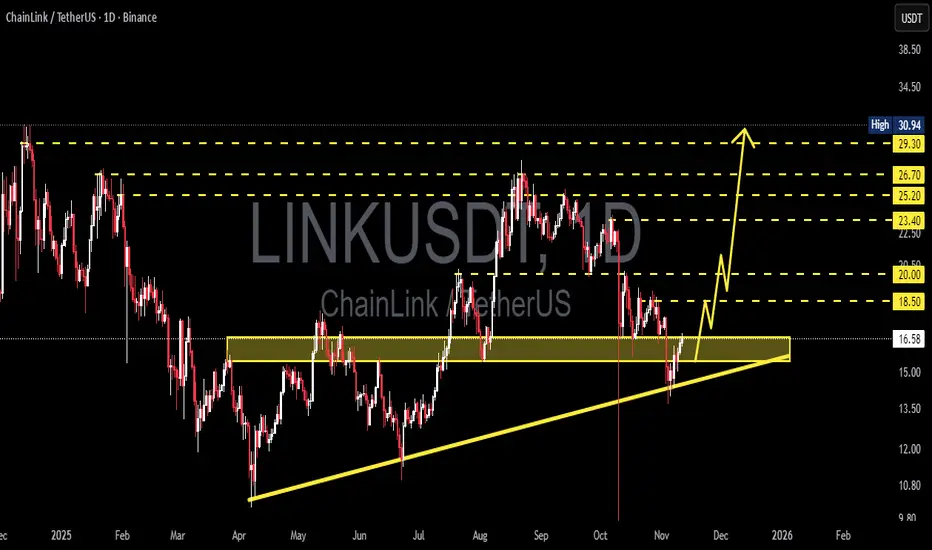
LINKBIST:LINK is starting to compress inside the triangle as price gets squeezed between resistance and support. The price action shows clear tightening, which is a strong sign a breakout is coming. From current levels to the target, there is a potential 300 percent plus gain on the table.

#LINKUSDT:minor correction first | major bullish move towards 40The LINKUSDT price is expected to decline to a range between 11.72 and 14.72 before resuming its upward trend. This price range has historically seen significant trading volume, indicating that a drop within this range is likely in the near future.
Once a trading position is initiated, there are three primary targets to consider. The first target is set at 25, which is highly achievable due to its proximity to the current price levels. The second target is at 35, which is also within reach with favourable market conditions.
The final target is at 45, which may require more time to achieve and will depend on strong fundamental support and positive market developments.
Good luck and trade safely.
Team Setupsfx_

Chainlink (LINK): Waiting For Perfect Setup | BullishLINK had its first BOS where buyers showed dominance, and now we’re waiting for the confirmational BOS to form. That would be the key step for continuation towards the unfilled zone above. For now, just watching how price reacts here — if buyers hold it, we’ve got a clean setup forming.
Swallow Academy

LINK/USDT - Ready to Explode? Uptrend Structure Tested?Chainlink (LINK) is now positioned at the most crucial zone in its mid-term technical structure — the 16.6–15.5 USDT area is not just a simple support, but a confluence zone between horizontal support and an ascending trendline that has been holding since April 2025.
Currently, price is reacting positively within this area, indicating that market participants are still defending the broader uptrend structure. However, if this zone fails to hold, the structure may collapse — paving the way for a deeper correction.
---
Pattern & Market Structure
Ascending Trendline Support: formed since April and still holding selling pressure.
Yellow Demand Zone (16.6–15.5): a strong accumulation area, tested multiple times this year.
Range-to-Trend Formation: price attempting to break out from sideways range into trend continuation.
Layered Resistances Above: 18.5 → 20.0 → 23.4 → 25.2 → 26.7 → 29.3 acting as step-by-step upside targets if the trend continues.
---
Bullish Scenario — Potential Reversal from a Strong Base
If price manages to hold and bounce strongly from the 16.6–15.5 zone, it opens the door for forming a new higher low that could become the foundation for the next rally.
Bullish confirmation: Daily close above 16.6 with reversal candle (hammer/bullish engulfing) and increasing volume.
Step-by-step upside targets:
18.5 → first psychological resistance.
20.0 → prior supply reaction area.
23.4–25.2 → potential breakout continuation zone.
Extended target: If momentum sustains, the ultimate target sits around 29.3–30.9, the yearly high.
Strategy:
Gradual buy within support zone with disciplined stop loss below 15.0. Additional confirmation entry if daily close >18.5.
---
Bearish Scenario — Breakdown as the Start of a Deeper Correction
However, if price breaks below 15.5 with strong volume, the bullish structure will be invalidated.
Bearish confirmation: Daily close below both trendline and 15.5.
Downside targets:
13.0 → previous horizontal support from May.
10.8 → macro base from 2024.
Additional signals: RSI breakdown, or failed retest below 16.6 after the break.
Strategy:
Wait for a failed retest around 15.5–16.0 for a short/hedge setup targeting 13.0.
---
Technical Perspective
The market is currently in a strategic neutral zone — between a potential major reversal and a confirmed breakdown. This is a decision phase, where volume and daily candle patterns will dictate the next dominant direction.
From a mid-term perspective, holding the ascending trendline means maintaining the macro uptrend structure, which could drive LINK back toward the 25–30 USD region. Conversely, losing this support may shift the structure into a new downtrend toward the long-term accumulation area below 13 USD.
---
Final Note
The 16.6–15.5 zone is more than just a number — it’s the psychological boundary between conviction and doubt.
Short-term traders look for a bounce, while long-term investors await directional confirmation.
Watch the daily close, volume, and trendline reaction closely. This is where the market decides: rebound toward 20+ or fall back to 13.
---
#Chainlink #LINKUSDT #CryptoAnalysis #TechnicalAnalysis #SupportAndResistance #Trendline #CryptoSetup #PriceAction #CryptoMarket
LINK is Waking Up—But Is This a Bull Trap or the Real Deal?Yello, Paradisers! Did you catch the breakout on LINKUSDT? It looks good at first glance, but there’s a critical detail that could make or break this move—don’t skip this analysis if you’re thinking about jumping in.
💎LINKUSDT has just broken out of a well-defined descending channel, a structure that often marks the end of a downtrend phase. What adds weight to this breakout is the presence of bullish divergence on both the MACD histogram and the Stochastic RSI, two reliable momentum indicators. This confluence significantly increases the probability of a bullish continuation, but that doesn’t mean it’s time to enter blindly.
💎For a higher-probability trade setup, what we want to see next is a small pullback. Ideally, the price should return to the breakout zone, allowing former resistance to flip into solid support. If this area holds, that’s where the opportunity lies—targeting the next major liquidity zones and resistance levels above.
💎However, caution remains essential here. If price breaks back down and closes a candle below the invalidation level, it would invalidate the bullish setup entirely. In that case, it’s far better to remain on the sidelines and wait for a cleaner structure to form, rather than forcing a position during uncertain conditions.
🎖Strive for consistency, not quick profits. This market rewards patience, discipline, and tactical execution. The next big opportunity is always around the corner—but only for those who stay focused and follow the strategy without emotional interference. Be a pro.
MyCryptoParadise
iFeel the success🌴

#LINKUSDT Analysis — Testing Channel Breakout📈 #LINKUSDT Analysis — Testing Channel Breakout
🗓 Published: April 23, 2025
🕰 Timeframe: 1D | 📊 Exchange: Binance
🔍 Technical Overview
Chainlink has been trading inside a falling channel since December 2024, with lower highs and lower lows. Price is now attempting a breakout from the upper trendline, signaling a potential trend shift.
📌 Pattern: Falling Channel
📌 Attempting Breakout at $14.79
📌 Support base held well at ~$12 zone
📈 Break + Retest = Key Confirmation Setup
🟩 Potential Entry Zone
📍 $12.55 – A strong support and re-entry zone if price rejects the first breakout attempt and retests.
🔻 Panic Level (Invalidation Zone)
📉 $9.5 – Breakdown below this level would invalidate the bullish setup and may trigger a sharp sell-off.
🎯 Upside Targets (If Breakout Confirmed):
TP1: $15.67 – Local structure resistance
TP2: $18.85 – Range mid-point
TP3: $22.37 – Channel high
TP4: $27.07 – Full recovery zone
TP5: $30.76 – Last breakout top
Ultimate Target: $35.19 (Cycle top)
⚠️ Targets should be scaled into — not all at once
🧠 Strategy Insight
This is a classic breakout-retest setup from a falling channel.
🟢 Ideal strategy: enter small now, add on retest of breakout line (~$13–14 zone).
Use tight stops under $12.14, or wider structure-based stop under $9.42 for position trades.
📊 High reward if trend shift confirms. Patience is key.
🗣 What’s Next?
Watch for volume on breakout, and monitor if BTC remains strong — altcoins like LINK can quickly outperform if the setup holds.
📢 A key decision point. Don’t chase — plan your risk and let price prove the breakout.
Please keep in mind that this is not financial advice and the purpose of these charts is to provide an idea of coin movement, not buy or sell signals. The cryptocurrency market is highly volatile and not suitable for everyone, so be aware of the potential risks before making any investment decisions. The information presented here is a personal effort and is subject to success or failure, and we welcome constructive criticism.
Good luck to all.
🙏we ask Allah reconcile and repay🙏

LINK LONG — FROM MATH TO MARKET STRUCTURE: An Extensive AnalysisTraders,
In my latest BINANCE:LINKUSDT analysis I started my thesis with " I BELIEVE THE CRYPTO MARKET IS SETTING UP FOR A BIG, BIG, BIG DUMP! NOT JUST LINK! "
It wasn’t coincidence that I wrote those words in caps lock. The market was whispering louder than usual: not in price, but in data. Every metric pulsed in rhythm, like the heartbeat of a system about to release its tension. The numbers weren’t random; they were poetry in motion, quietly syncing toward one inevitable point. Sometimes, data doesn’t just inform — it sings. And when it does, your fingertips start typing before your mind even realizes what the melody means.
Now we’re back — same chart, same logic, but a different side of the market.
I’m going to analyze it the same way I did before — step by step, math-backed, structure-based, and logic-driven.
Only this time, it’s even more extensive.
For free. For nothing. So that you, the people who actually care to learn, can start to see how markets truly work. How they breathe, trap, rotate, rebalance — and how every candle hides intent.
I believe the BINANCE:LINKUSDT dump might be over — for now, at least — and that the market is slowly starting to build upward momentum. This post is not a quick “looks bullish” statement. It’s a structured walkthrough from mathematical foundation to market structure, liquidity, and order flow, showing why the $20–$21 region might become the next key target before a rotation lower.
Let’s go step by step.
Step 1 – Is There a Mathematical Reason to Say the Current Auction Might Be Finished?
By “auction,” I mean the move from a clear swing high to a clear swing low where sellers were in control. Markets move in auctions — from high to low, then pull back, then extend again. To determine whether a sell auction is finished, we measure how far it has retraced and extended.
After the 10 Oct liquidation event, price printed a clean new high — more valid than the liquidation spike. That’s point A (~20.15). From there, it sold off to point B (~15.70).
So our first auction is:
A → B | Direction: Down
Step 2 – Measuring the Retrace
Since the move was downward, I drew a Fibonacci retracement from A to B (high → low). nThat gives us retracement levels above price on TradingView.
Price retraced almost perfectly to the 0.786 level (~19.23) — not shallow (0.382 or 0.5), not extreme (0.886), but deep enough to classify as a “normal” yet decisive retrace.
That means sellers regained control after a 0.786 pullback, a key ratio in the Fibonacci family.
Step 3 – What Does a 0.786 Retrace Usually Lead To?
Here’s where the Fibonacci logic becomes meaningful. The 0.786 level is derived from the square root of the golden ratio inverse: √(1/φ). Its natural mirror on the other side of price is √(φ), or 1.272.
That’s why 0.786 retraces often project toward 1.272 extensions — the two are mathematically linked. Beyond that, the next probable extensions are 1.414 and 1.618.
So, for a 0.786 retrace, the Fibonacci extension ladder is:
Primary: 1.272
Intermediate: 1.414
Extended: 1.618
Step 4 – Did BINANCE:LINKUSDT Reach One of These Fibonacci Targets?
To check that, we reverse the Fibonacci — draw it from B to A (low → high). That prints the extension levels below the swing low.
Price hit the 1.414 extension almost perfectly before structure began shifting:
Lower lows stopped forming
Higher lows began to appear
Small higher highs emerged on lower timeframes
That’s a structural sign the sellers exhausted their leg — a textbook confirmation that the 1.414 zone completed the auction.
Step 5 – Confirming the Auction
The A → B auction retraced to 0.786, extended to 1.414, and then reversed in structure. This matches the Fibonacci expectation for a completed wave.
If the retrace had been 0.886 instead, we’d likely expect continuation to 1.618 — but since it was 0.786, the 1.414 tap followed by reversal fits perfectly.
✅ 0.786 retrace → 1.272 / 1.414 / 1.618 extension
✅ 1.414 tapped → structure reversed
We can reasonably call this auction finished.
Step 6 – Confluence from the Smaller ABC Swing
After the main leg, the market made a small rally and a lower high — point C. Using the Fibonacci Extension tool (A → B → C), we project this smaller swing.
Interestingly, the ABC projection lands exactly on the same 1.414 zone as the larger A → B measurement. That’s two independent Fibonacci constructions converging on the same price.
From a math perspective, this isn’t coincidence — both patterns use the same ratio family.
It’s proportion — the geometry folding back onto itself.
Nature’s Geometry on a Price Chart
This is where Fibonacci goes beyond numbers. The same proportions that define growth patterns in seashells, tree branches, sunflowers, hurricanes, and galaxies are present in the market’s structure.
Two distinct swings produce the same 1.414 target.That’s natural proportion — mathematical harmony showing up in price behaviour.
It’s not random. It’s geometry repeating itself.
Part 2 – The Structural Context: Liquidity and Value
We’ve identified our Potential Reversal Zone (PRZ) using Fibonacci confluence. Now let’s look inside the structure and the market’s underlying “memory.”
We’ll answer three questions:
Where does liquidity sit — which levels might the market hunt next?
What is the order flow showing — is there absorption or continuation?
What do the next extensions project mathematically?
1. Liquidity via TPO (Market Profile)
TPO (Time Price Opportunity) shows how much time price spent at each level. Clusters = acceptance and value. Gaps = imbalance and rejection.
Around $19.00, during TPO periods G, H, N, and O, price built acceptance but didn’t explore higher. That created a weak high — a level that often acts as a magnet for future liquidity hunts.
Another, slightly weaker high sits near $20.00, which is still unfinished.
And as James Bond said, “I never leave loose ends.” Neither does the market.
2. Anchored VWAP Confluence
Anchoring VWAP from the major swing high shows the blue AVWAP aligning almost perfectly with that $20.00 region. That gives strong confluence between volume-weighted value, liquidity, and structure.
3. Low Volume Nodes (LVNs) and Imbalance
Using the Fixed Range Volume Profile (FRVP) from A → B reveals clear low-volume zones — “air pockets” where price moved too fast to build volume.
Between $20.00 and $20.50, there’s a notable LVN, meaning price skipped over it during the selloff.Such zones often act as magnets — the market tends to revisit them to rebalance unfinished business.
Now we have three layers of confluence:
Weak high at $19.00–$20.00
Anchored VWAP aligning with $20.00
LVN pocket at $20.00–$20.50
That defines a clear liquidity and target zone.
Structure and Confluence Summary
PRZ established through Fibonacci symmetry
Structure showing higher lows and early accumulation
Confluence cluster between $20.00 and $20.50, combining:
Weak highs
Low-volume node
Anchored VWAP
Market Profile imbalance
The setup aligns across math, volume, and structure.
Part 4 – Order Flow: What Lies Beneath the Candles
From the outside, price action looks calm — clean candles, defined Fibonacci levels, and structure that seems perfectly balanced. But the real story is hidden underneath, inside the Order Flow.
Every candle represents a battle — between aggression and absorption, buyers and sellers, liquidity and imbalance. Understanding who is winning that battle tells us whether a move is genuine strength or a trap waiting to unwind.
Order Flow allows us to look beneath the surface and see where transactions are actually happening — where volume clusters, where buyers are absorbed, and where sellers are defending. It’s the market’s heartbeat.
The Current Picture
Here’s what we see right now on BINANCE:LINKUSDT :
CVD (Cumulative Volume Delta) — across both spot and futures (stablecoin- and coin-margined contracts) — is making lower highs, showing persistent sell aggression.
Yet price itself is not breaking down. Instead, it’s holding steady and even forming higher lows.
Meanwhile, the A/D (Accumulation/Distribution) line is rising, indicating that despite heavy selling pressure, buyers continue to absorb and accumulate.
That means one thing:
aggressive sellers are being absorbed by large passive buyers quietly taking the other side.
Recognizing the Setup
Let’s break down the pattern:
CVD ↓ → sustained sell aggression
OI ↑ → new short positions entering the market
Price ↔ or ↑ slightly → absorption and accumulation taking place
When these three align:
It often signals a short trap forming.
Sellers feel in control because CVD shows selling dominance.
In reality, their aggression is being absorbed by larger passive buyers.
Once that liquidity runs out and buyers stop absorbing, shorts are trapped.
Those trapped shorts must cover — triggering a fast, aggressive short squeeze upward.
Also: CVD on Stablecoin Margined Contracts remains flat while Stablecoin Margined Open Interest rises — showing aggressive shorting being absorbed by larger buyers. Price stability suggests accumulation, not weakness. Since OI stays high, those shorts are still in the game, meaning their positions haven’t been closed yet. If price starts to move up, they’ll be forced to cover — setting up the conditions for a short squeeze.
Absorption in Context
Absorption isn’t random — it’s the footprint of strong hands quietly taking in sell pressure without letting price break down. While most see weakness, they’re actually witnessing controlled accumulation.
Here, price holds steady as CVD trends flat and OI stays high — meaning aggressive shorts are still in the game, being absorbed by larger buyers. Every new short adds fuel to the spring.
When that pressure releases, it doesn’t drift — it snaps. Shorts are forced to cover, triggering a sharp, emotional squeeze toward the next liquidity zone around $20–$20.50, where Fibonacci confluence and a weak high align.
This is where microstructure meets the macro picture — absorption building the base for a violent move higher.
Part 5 – Fibonacci Extension Confirmation
To justify the $20–$21 target mathematically, we apply one more Fibonacci extension —
from the last swing low to the recent high, projected forward.
The 1.618 extension aligns almost perfectly around $20.00, adding strong mathematical confluence to our previously defined liquidity and structure zone.
That makes $20.00–$20.50 a textbook target cluster — a Fibonacci, liquidity, and volume alignment.
Final Outlook – The Path Ahead
Based on all the combined data:
Fibonacci structure shows completion and new expansion potential
Market Profile and VWAP reveal unfinished business around $20–$20.50
Order Flow confirms absorption and hidden accumulation
The 1.618 Fibonacci projection reinforces this level as a natural mathematical destination
I believe the market will squeeze upward toward $20–$21, taking out the weak high and the LVN pocket — and once that liquidity is collected, rotate back down to restore balance.
The setup is mathematically justified, structurally valid, and order-flow supported — a complete picture of how Fibonacci geometry, structure, and liquidity align to reveal where the next phase of this auction may unfold.
If price slips lower instead, the key level to watch is $12.90 — the latest 1.618 extension from the initial wave we measured earlier. That remains the deep liquidity and structural boundary where balance could be restored.
Last words.
Everything we have mapped — Fibonacci structure, confluence, liquidity, and absorption — means nothing without the psychology behind it. The market is not just math and candles; it is a mirror of collective emotion. Every trapped short, every breakout chase, every hesitation is human behaviour written in numbers.
When confidence is at its peak, risk is usually greatest.
When fear dominates, opportunity hides in plain sight.
That is why sentiment often reaches its extreme just before reversals. Most traders only see what is already visible, not what is quietly building beneath the surface.
So next time you scroll through social media or read the news about what everyone expects, remind yourself of this:
When everyone sees the same breakout, the trade was over hours ago.
And the markets whisper long before they speak.
From the depths of the sands,
ThetaNomad
------------------------------------
If you enjoy this kind of analysis, leave a like and drop a comment. I don’t ask for anything — I just want to help more people learn to look behind the charts, to see the story that price and volume quietly write together.

LINK - Approaching Breakout From Descending TrendlineChainlink (LINK/USDT) is currently trading near a key support zone around $15.00–$15.20, where price has shown multiple bounces. The chart also shows a descending trendline acting as resistance. Price is beginning to push up from support and is approaching this trendline again.
A breakout above the descending trendline could signal a shift in momentum, potentially leading to a bullish move toward the next resistance levels around $15.60 and then the projected target zone near $16.20–$16.40.
Overall, the chart suggests a possible trend reversal scenario, but confirmation would come from a clean breakout and retest of the descending trendline.


$LINK (DAILY): HIDDEN BEARISH RSI divergences persistMy last BIST:LINK update on Oct 25 played out pretty well. It was around $17.9 back then, fighting to hold the 200 MA sitting on top of the Golden Pocket.
Now at $15, and the $14.6 level I mentioned as one of two targets has been holding so far.
There have been 6 previous HIDDEN BEARISH divergences on the RSI — each one followed by a CRASH. I’ve marked the horizontal lines to show those rare but powerful hidden signals that almost never fail during broader market declines.
At this point, $14.6 remains the key SUPPORT to watch. If it breaks, the next stop is $12.6 — the 200 MA on the weekly chart.
I’m watching closely for another hidden bearish divergence to form at or near RESISTANCE on a LOWER HIGH. One more of these could offer a high-probability short entry.
Still, the OBV remains bullish, and that’s the only thing keeping me from fading this setup.
No shorts as long as CRYPTOCAP:BTC stays above $103K (the 1W 50 MA) — that’s my main market filter for now.
💙👽


Hidden GapLINKUSDT - Short Setup | Hidden Gap & Order Flow Break
Timeframe: 15m
Exchange: Binance
Market Structure
Price has been following a bearish structure, forming consecutive lower highs (LH) and lower lows (LL). Recently, price created a minor pullback to a premium zone, tapping into an Order Block before resuming bearish momentum.
The market broke two significant floors (demand zones) — one representing Order Flow, and the other confirming a Hidden Gap imbalance — signaling strong bearish intent and liquidity sweep behavior.
Key Concepts in Play
MPL (Most Probable Liquidity): Two MPL points mark liquidity highs swept before the drop.
Hidden Gap: Acts as an imbalance zone left unmitigated — perfect entry confirmation once the price fills it and rejects.
Order Flow Break: The structure confirming sellers are in control.
Order Block (OB): The last bullish candle before a major bearish displacement. This is our short entry zone.
Trade Setup
Entry: 14.90 – 15.00 (inside Order Block / Hidden Gap zone)
Stop Loss: Above Order Block → ~15.20
Take Profit 1: 14.30 (previous structural low)
Take Profit 2: 14.00 (next liquidity zone)
Risk/Reward (approx): 1:3 – 1:4
Confluence Factors
✅ Break of structure confirming bearish order flow
✅ Mitigation of premium Order Block
✅ Hidden Gap fill and rejection
✅ Double floor break (liquidity cleared below)
✅ Continuation with overall bearish trend
Bearish Bias Summary
The market is maintaining a bearish order flow with a clear liquidity grab above the Order Block followed by aggressive selling pressure. As long as the price remains below 15.20, the bearish momentum is expected to continue.
Idea Summary:
Shorting from premium after a liquidity grab at the Order Block and Hidden Gap area. Looking for continuation toward new lows after confirming bearish order flow break.

LINK USDT LONG SIGNAL---
⚠️ Disclaimer:
This analysis reflects personal market observation and is not a buy or sell signal.
Always analyze the chart yourself and apply strict risk management before taking any trade.
📢 Signal Alert
🔹 Pair: LINK / USDT
📈 Trade Type: Long
💰 Entry Price: 14.774
🎯 Take-Profit Targets:
TP1 = 15.406
TP2 = 16.104
TP3 = 16.761
🛑 Stop-Loss: 14.375
📊 Timeframe: 1H
⚖️ Risk/Reward Ratio: 5.0
📌 Suggested Leverage: 5x–10x
🔄 After reaching TP1, move Stop-Loss to Entry to secure profits.
---
🧠 Technical Analysis Summary:
LINK is showing bullish momentum after bouncing from the support zone near $14.40–$14.50, which aligns with the trendline support and EMA50 on the 1-hour chart.
The pair has formed a higher low structure, suggesting continuation of the uptrend toward the next resistance at $15.40–$16.10.
The entry zone ($14.77) coincides with a demand area that has repeatedly rejected price decline, confirming strong buyer interest.
Momentum indicators (RSI > 50, MACD crossover) also support upward pressure.
Stop-loss ($14.37) is set below the last swing low, protecting capital while allowing natural volatility.
⚙️ Trade Management Tip:
Wait for a bullish confirmation candle close above $14.80 before entry.
Take partial profits at TP1 and trail stops to maximize gains as price approaches upper targets.
---

Chainlink (LINK) – SmartCon 2025 + Key Support TestLINK is in focus as SmartCon 2025 kicks off today, drawing attention to the broader Chainlink ecosystem. Historically, this event has sparked major announcements and partnerships, often impacting LINK price action. Traders are now watching for potential bullish catalysts during the event.
Technically, LINK is breaking down into a key support zone between $14.50 and $15.00. This zone has held in the past and could act as a launchpad for a reversal bounce, especially if event-driven sentiment kicks in. Failure to hold this zone opens the door to deeper retracements.
🛠️ Trade Setup (Idea Only):
Entry Zone: $14.50–$15.00
Take Profits: $20 / $22 / $25
Stop Loss: $13
Bias: Short-term bullish if support holds

LINKUSDT → A trap? Grabbing liquidity before the fall...BINANCE:LINKUSDT is forming a correction after a bearish run. A false breakdown of support is triggering a correction before a possible continuation of the decline.
The coin is testing the support of the trading range within the downtrend. The reaction to the false breakdown of support is a pullback to the zone of interest. After a strong downward distribution, a correction to the break-even zone is forming. A false breakout of resistance at 17.45 could trigger a continuation of the decline due to a weak market and a liquidity pool formed above 17.450, which is likely to stop the pullback on the bearish trend.
Resistance levels: 17.450
Support levels: 16.53, 15.77
The downtrend may continue. A retest of resistance may end in a fall and an update of the local minimum, as well as reaching the zone of interest at 15.77.
Best regards, R. Linda!

LINK – Calm Before the Storm?Chainlink is currently consolidating within a neutral accumulation range between $15.5–18.9, showing clear volatility compression on declining volume.
The chart structure combines a downtrend channel, Fibonacci retracement, and a projected volatility cone, all converging toward a potential breakout window around mid-November.
A daily close above FIB 0.236 could trigger the next wave toward $19.9; $21.9; $23.3. While on the other hand, losing $15.5 would likely send LINK back into a deeper correction.
RSI and EMAs are still neutral, so patience is key here.
Sibos conference (Nov 4–5) could be the catalyst that wakes the price up, especially if Chainlink or partners reveal new integrations or institutional news.
Right now, it’s all about patience — volatility is loading, and this looks like the calm before the storm.
Breakout > $18.9
Breakdown < $15.5

LINK USDT LONG SIGNAL ---
📢 Signal Alert
🔹 Pair: LINK / USDT
📈 Trade Type: Long
💰 Entry Zone: 17.188 – 17.496
🎯 Take-Profit Targets:
TP1 = 17.700
TP2 = 18.240
TP3 = 18.520
🛑 Stop-Loss: 17.000
📊 Timeframe: 1H
⚖️ Average Risk/Reward Ratio: ≈ 1 : 4
📌 Suggested Leverage: 10x
---
🧠 Technical Analysis Explanation
LINK is showing strong bullish continuation after defending the 17.0 support zone, which previously acted as a key demand area.
Price has formed a double bottom pattern with a higher low on shorter timeframes, signaling potential reversal strength.
The entry zone (17.188–17.496) aligns with the retest of a breakout area above EMA 50, while RSI shows a bullish divergence, supporting upward momentum.
Targets are placed near local resistance levels and Fibonacci extensions derived from the latest impulse wave.
The stop-loss at 17.0 protects against invalidation of the bullish setup.
---
⚙️ Trade Management Rule
After TP1 is reached, move Stop-Loss to Entry to secure capital.
Confirm entry only after a bullish candle close above 17.20.
Always apply strict risk management and avoid overleveraging.
---

LINK/USDT – Upside Target in Focus!Chainlink (LINK) is showing bullish momentum after rebounding from the 16.66 support zone.
If the price sustains above 17.57 the next potential targets are 18.37 📈

Lingrid | LINKUSDT Follow Through Pattern FormingBINANCE:LINKUSDT price action shows continued rejection from the descending trendline inside a well-defined downward channel. The structure remains bearish, with lower highs forming under resistance near $18.00. As long as this rejection holds, price could revisit the support area toward $15.00 before potential stabilization. Overall momentum aligns with a continuation of the broader downtrend.
⚠️ Risks:
Unexpected dovish shift in Fed tone boosting overall crypto sentiment
Strong BTC recovery above $120K improving altcoin structure
Short-term liquidity spikes causing false breakouts above $18.00
If this idea resonates with you or you have your own opinion, traders, hit the comments. I’m excited to read your thoughts!

LINK USDT SHORT SIGNAL ---
📢 Signal Alert
🔹 Pair: LINK / USDT
📉 Trade Type: Short
💰 Entry Zone: 17.65 – 18.256
🎯 Targets (Take Profits):
TP1 = 17.18
TP2 = 16.63
TP3 = 16.10
🛑 Stop-Loss: 19.10
📊 Timeframe: 1H
⚖️ Risk/Reward Ratio: 3.4
📌 Suggested Leverage: 5x – 10x
---
🧠 Technical Analysis Explanation
After several rejections near the $18.9 resistance, LINK shows clear signs of weakness.
Price action has formed lower highs within a short-term descending structure, signaling that sellers remain in control.
The RSI has turned below 50, confirming bearish momentum, and volume has increased during red candles — another sign of active selling pressure.
The entry zone (17.65–18.90) corresponds to a retest of the previous supply zone, offering a favorable short opportunity.
Targets are based on key support levels from previous swing lows and Fibonacci retracement zones.
The stop-loss at 19.10 is placed just above the previous swing high to protect against a fake breakout.
⚠️ Note: Always wait for a bearish confirmation candle or rejection wick near the entry zone before executing the trade. Proper risk management is essential.
-

LINK It has good growth potential in midtermWhat I see now is that the price could correct to the PRZ and then pump again, and currently, there is no specific bullish pattern in the chart. which could cause the price to drop below 13.5 dollars.
Best regards CobraVanguard.💚
