Predicting Intraday CRASHES 10%+ w/ 5 Easy Steps1️⃣ Daily imbalance above has been rebalanced.
2️⃣ Price is rejecting from premium arrays (above equilibrium of the daily dealing range).
3️⃣ Intraday displacement (#4) aligns perfectly with that macro rejection.
4️⃣ Volume and spread expand on the breakdown — that’s real order-flow, not stop-hunts.
5️⃣ There’s untouched liquidity resting below the daily lows. That’s where the algorithm’s draw is.
Trade ideas

LINK - BULLISHCRYPTOCAP:LINK - holding nicely! 📈
100$+ per tokens in 2026 still programmed!
Fundematals are too big. 💎

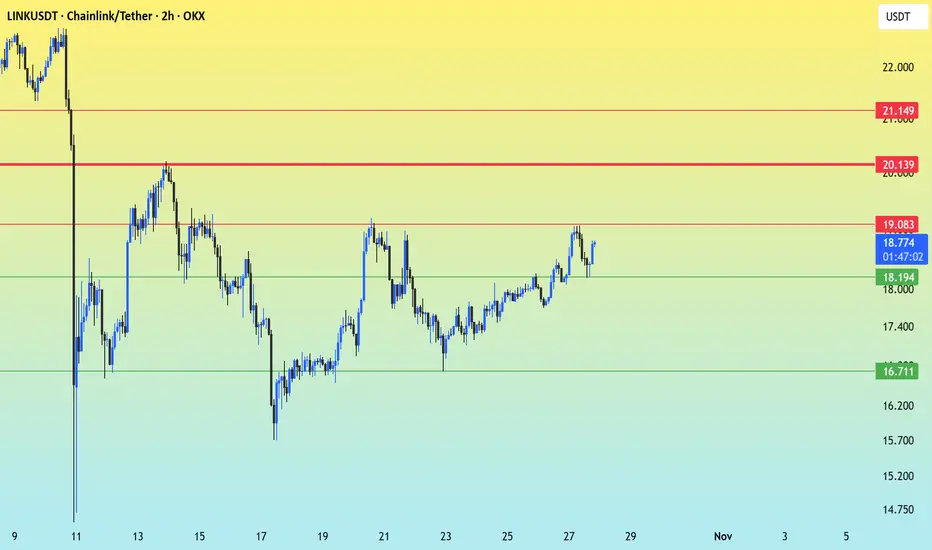
Chainlink at the Breaking Point: Is $19.08 the Gateway to $21.00LINK/USDT is in a recovery and consolidation phase after a sharp decline, currently testing the upper boundary of its range with increasing bullish pressure. Following a significant drop around October 9th-11th, the price has been in a horizontal channel, showing higher lows since the $14.75 low. It is now challenging the major ceiling around $19.08, signaling buyer control.
Support Levels:
- Immediate Support: $18.194 - Must hold to maintain momentum; break risks testing $16.711.
- Major Support: $16.711 - Strong consolidation floor; critical to defend to avoid deeper retracement.
Resistance Levels:
- Primary Resistance: $19.083 - Break and close above needed to exit consolidation.
- Major Target 1: $20.139 - First hurdle after breaking $19.083.
- Major Target 2: $21.149 - Final resistance before price drop.
Bullish Scenario: A breakout above $19.083 would confirm a new trend with targets at $20.139 and $21.149.
Neutral/Bearish Scenario: Failure to break $19.083 may lead to a return to the $18.194 support, with a drop below $16.711 indicating strong weakness.
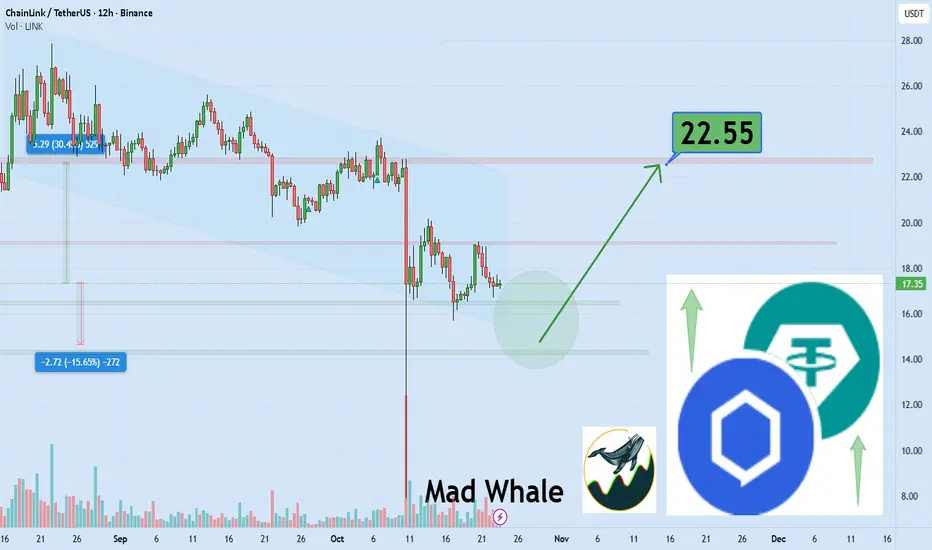
support area for link we can see upper level at least 30% gain Hi the support and resistances on the chart are based on the previous data and weekly candlesticks if BINANCE:LINKUSDT holds this last support the potential of 30% gain is logical toward 22.55$
$LINK (DAILY): GOLDEN POCKET support / 200 MA fightBIST:LINK on its WEEKLY chart: still a text-book BAT reversal intact, below the 50 MA, and just continuation to the downside. High selling volumes recently and essentially reverting back to its mean (200 MA on 1W at $12.8), although that's a long term chart.
We need a look on the DAILY to get a better idea if a reversal to the upside is an option soon.
1D chart is showing a fight to stay above a combo of crucial pivots:
1) 200 MA at $17.7, key moving average, for many traders, especially institutional: bear/bull boundary
2) horizontal support/former resistance $17.4
3) GOLDEN POCKET of the move that took the price from JUNE lows ($11) all the way up to the AUGUST top ($28).
OBV on the DAILY had two minor HIDDEN BULLISH divergences while the price was finding support in the pocket, that's interesting to see.
Holding the green 200 MA is the most important thing for now, no reversal yet, but if it was to remain a BULL MARKET asset, the BUYERS must step in immediately.
Close below the GOLDEN POCKET and we should see $14.6 and possibly $12.8 if that doesn't hold.
LONGS only above $19.5, I need to see a BULLISH market structure change to do anything here.
👽💙

LINK - BULLISH SCENARIO BIST:LINK - price analysis 🍿
Almost the same PA as $DOGE.
Very neutral area on the monthly, big volatility on both side. Really hard to trade & find a direction on the short term.
A Monthly close above 18.00$ would be good for bulls regarding the tails + Kijun level ichimoku.
Bullish consolidation likely if it hold above 15.80$ daily basis.
Local key support:
16.70 - 16.55$ - 15.70$
Price seems to be moving inside this downtrend channel ; but 👇
Possible bullish setup: $
A breakout of downtrend would surely lead to a push toward 20.00$ or even 22.80$ to fill the gap! 📈
Weekly resistance: 19.55 - 20.50 -
Also, I Hope that's not a bearish H&S pattern (3rd chart) with a neckline around 20.00 - 20.30$, otherwise, big bearish move could happen. 👀

LINKUSDT 1D#LINK is moving inside a symmetrical triangle on the daily chart, and there is a bullish divergence on the RSI. It is currently facing the daily SMA200. In case of a breakout above it, the potential targets are:
🎯 $19.01
🎯 $20.50
🎯 $21.70
🎯 $22.90
🎯 $24.61
🎯 $26.79
⚠️ Always remember to use a tight stop-loss and maintain proper risk management.

Chainlink (LINK): Looking For Breakout From 200EMA | BullishLINK is showing a nice recovery setup, where buyers are trying to take control after defending the recent drop. Price is still sitting below the EMAs, so for now, we’re waiting for a proper breakout — that’s the confirmation needed for continuation.
Once we see that breakout and reclaim of the EMAs, we can expect momentum to pick up quickly, targeting the $27–28 zone next.
Swallow Academy

LINK Spot LONG LINK Spot LONG📈
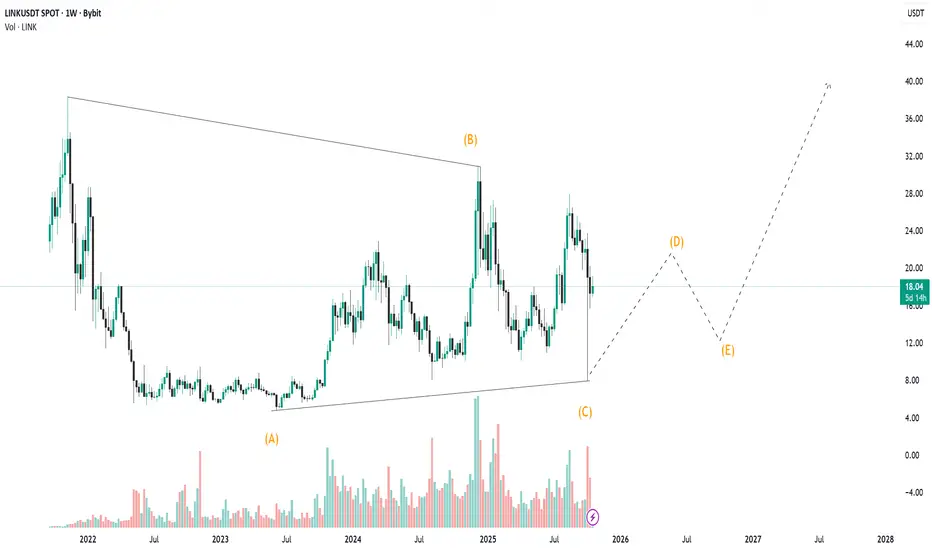
Due to the formation of a zigzag structure, I am more inclined to form a triangle and further exit from it upwards. I no longer consider it as an impulse.
Expectations have not changed, I plan to start recording after updating the global maximum of 53.00. Only the time of the scenario implementation has changed, which may take a long time.
All altcoins with potential show approximately the same picture, which is encouraging. This structure provides the most accurate goals for profit-taking and scenario cancellation.
Lingrid | LINKUSDT Bearish Continuation Short OpportunityBINANCE:LINKUSDT has been moving inside a well-defined downward channel, consistently forming lower highs and lower lows in line with bearish structure. The recent rejection from the downward trendline confirms continued pressure from sellers near $18.50 resistance. Unless price breaks and sustains above this area, the broader momentum favors a move toward the $15.00 support level. Current structure implies that each rally attempt remains corrective within a larger downtrend.
⚠️ Risks:
A sudden BTC recovery could invalidate the bearish setup.
Failure to hold below $18.50 may trigger a short squeeze.
Softer macro sentiment or lower volatility could delay breakdown momentum.
If this idea resonates with you or you have your own opinion, traders, hit the comments. I’m excited to read your thoughts!

LINK LONG SETUP -1HR IRL -ERL ,
we have taken out IRL , TIME TO GET THAT ERL
ENTRY : 18.88
STOP : 18.40
TP:20
R:R 1:2

LINK/USDT – Breakout in Progress!
Price reacted perfectly from the demand zone – early entries already +16% profit!
📍 Entry Zone: ~$15.70–$16.00
🎯 Target 1: $24.94
🎯 Target 2: $28.83

LINK Analysis - October 18Price: $16.61
Up 0.81% (24h) after testing $16.96 resistance.
Technical Analysis:
Supports: $16.00, $15.50
Resistance: $17.00, $18.00
RSI: 46.75 (daily, neutral)
MACD: -0.19 (daily, sell)
EMAs: Below 50-day ($17.00), above 200-day ($15.00)
Bollinger: Near mid-band ($16.50)
LINK/BTC Chart Analysis:
Ratio: 0.000248
Supports: 0.000240, 0.000230
Resistance: 0.000260, 0.000270
RSI: 50 (daily, neutral)
MACD: Neutral, slight bearish divergence
Patterns: Symmetrical triangle forming (October 1–18)
Head and Shoulders potential (daily, bearish)
Bullish Engulfing: October 15
Plot on TradingView for visualization.
On-Chain Analysis:
MVRV: Neutral, fair valuation
Exchange Reserves: Stable, moderate selling
Whale Activity: 4,624 large transactions, 73% surge in accumulation
Coin Days Destroyed: Moderate, profit-taking
Glassnode Funding Rate: Neutral on CEXs (SorooshX/OKX perpetual futures ~0.01%, balanced leverage)
Fundamental News:
Macro: Fed rate cuts Q4 2025, easing inflation
Regulatory: S&P Global partners with Chainlink for on-chain stablecoin assessments
Institutional: Franklin Templeton, DTCC, Euroclear adopt Chainlink for tokenized assets
Social Sentiment:
450K+ #LINK mentions on X
60% bullish (S&P partnership, whale accumulation, $55 target predictions)
Trend & Chart Patterns:
Symmetrical Triangle: Forming (October 1–18)
Head and Shoulders: Potential bearish reversal on daily
Bullish Engulfing: October 15
Trend: Neutral short-term, breakout risk both ways
Long-term: $20–$55 (2026)
Buy/Sell Signal: Hold (55% confidence)
Rationale: Neutral RSI/MACD and funding rates suggest consolidation; whale accumulation and partnerships support upside, but Head and Shoulders risks pullback.
Hold or buy on dips: $16.00 or $15.50
Stop-loss: <$15.50
Target: $18.00 short-term, $55 (Q4 2026)
Disclaimer: Research before investing. #LINK

LINK/USDT — The Final Defense Zone: Will the Bulls Rise Again?Chainlink (LINK) has entered its final defense zone around $15.00–$17.00, a historically strong structural support area.
This zone isn’t just random — it’s the same level where the market once launched a major rally that drove LINK to $27.87.
The most recent daily candle shows a deep wick below the zone that was quickly reclaimed — a classic sign of a liquidity grab or false breakdown, hinting that the market might be accumulating before its next significant move.
Overall, the structure suggests a major retest phase: after a powerful breakout earlier this year, LINK is now retesting the origin of that move.
The key question — is this the start of re-accumulation before another leg higher, or the beginning of a market structure breakdown toward deeper lows?
---
Structure & Pattern
Yellow Zone ($15–$17) → Historical demand zone, validated by multiple previous bounces (marked by yellow arrows).
Macro Pattern → Retest of breakout zone, with the latest candle showing sweep and reclaim behavior.
Momentum → Sharp correction, but with a long lower wick and potential momentum divergence — a sign that the correction phase might be near its end.
Technical Context → Holding above this zone may form a double bottom or higher-low structure, indicating bullish strength recovery.
---
Bullish Scenario (Reversal Setup)
A daily close above $17 would confirm that buyers are defending the structure.
A sustained move above $19.99 could unlock upside targets at $21.69 → $23.30 → $25.12 → $26.82.
A strong rejection from the lower zone, combined with rising volume, may signal institutional accumulation in progress.
Market Narrative:
Bulls might be quietly preparing for Phase 2 of the rally after a classic shakeout.
As long as the $15–$17 zone holds, LINK retains the potential to resume its mid-term uptrend.
---
Bearish Scenario (Continuation Breakdown)
A daily close below $15 would signal structural failure and a loss of bullish control.
This could trigger a continuation drop toward $13.5 → $12.0 → $9.8.
A failed retest from below the zone ($16–$17 rejection) would further confirm bearish momentum.
Market Narrative:
If this support collapses, LINK may enter a distribution phase, where selling pressure strengthens and momentum fully flips bearish.
---
Conclusion & Perspective
The $15–$17 zone is the line between survival and surrender for LINK’s bullish structure.
As long as this level holds, the potential for a bullish reversal remains alive.
But once broken, the mid-term trend could shift decisively to bearish.
We are standing at a Decision Zone — the kind of area where institutions quietly position themselves and patient traders wait for confirmation before taking action.
---
LINK returns to its final defense zone at $15–$17 — the area separating a major reversal from a new downtrend.
The long wick signals a liquidity sweep, but confirmation awaits the next daily close.
Bulls are being tested — will they hold the line, or give in to market pressure?
Levels to watch:
Support: $15–$17
Resistance: $19.99 → $21.69 → $23.30 → $25.12 → $26.82 → $27.87
---
#LINK #Chainlink #LINKUSDT #CryptoAnalysis #TechnicalAnalysi #SupportAndResistance #CryptoMarket #PriceAction #Altcoins #MarketStructure #CryptoSetup #LINKPrice

$LINK (MONTHLY): bearish BAT harmonic pattern played out WELLBIST:LINK on the most crucial chart, the WEEKLY, not looking good, constant decline for the last 8 weeks.
Exactly a month ago (quoting that post), when #LINK was just above $24, I spotted this lovely bearish BAT harmonic pattern (the up-side down version of the BULLISH BAT on SEED_WANDERIN_JIMZIP900:ASTER which I posted about earlier on).
Just this one harmonic pattern has kept me from longing or buying this coin. I don't go against confirmed BATS, BUTTERFLIES and any other harmonics. Saves tons of dry powder.
30% down since that SEPTEMBER BAT publication.
LINK has been losing key dynamic support on the DAILY (200 MA) and the short-term 50 MA on this WEEKLY chart... Selling volumes strong these days.
Nothing much in terms of positives, no reversal in sight with a such ugly looking sequence of red candles.
Possible reversal/dead cat bounce from lower levels, around $12 - $13 where some last ditch SUPPORTS are very likely to kick in.
Just not BULLISH, which is a bit surprising and disappointing as LINK was supposed to lead the gains this cycle. But the chart always shows the objective truth, so there you go.
💙👽

TradeCityPro | LINKUSDT Early Entry Trigger!👋 Welcome to TradeCityPro Channel!
After the recent sharp drop in the overall crypto market, which was mainly triggered by negative news from China and the United States, Chainlink (LINK) also faced a noticeable correction —just like most major altcoins.
At the moment, LINK is trading below a strong daily resistance zone, which has previously acted as a key turning point for price action. The market seems to have already completed a pullback to this resistance, showing that sellers are still active in this region. This is a critical area — the next move from here could define whether LINK continues downward or begins a new bullish leg.
If the market manages to break above this resistance with strong momentum and confirmed volume, we can start looking for long opportunities on lower timeframes (like 4H or 1H). However, it’s safer to wait for confirmation of structure change, such as the formation of higher highs and higher lows, before entering.
For a short position, there are two clear scenarios:
If the price gets rejected from the 20.12 level, it can trigger a short setup early, especially if accompanied by bearish candlestick patterns like a shooting star or bearish engulfing.
A confirmed break below 17.07 would act as a stronger confirmation for continued downside momentum — showing that buyers are losing control and the bearish pressure remains dominant.
On the other hand, if the price breaks above 20.12, we’ll likely see a move toward the descending trendline that has been guiding LINK’s movement for several weeks. This zone could become another major decision point:
A rejection from the trendline might start another wave of correction,
But if LINK breaks above it and sustains momentum, it would signal the start of a potential bullish reversal, possibly leading to a trend continuation toward higher resistances.
🔹 Bullish confirmation: Break and retest above 20.12 with structure change on lower TFs.
🔹 Bearish confirmation: Breakdown below 17.07, or rejection from 20.12 with volume.
🔹 Neutral zone: Between 17.07 – 20.12, where price might consolidate before its next move.
Overall, LINK is currently in a decision-making phase, and traders should stay patient, waiting for clear breakout or rejection signals before entering any position.
📝 Final Thoughts
Stay calm, trade wisely, and let's capture the market's best opportunities!
This analysis reflects our opinions and is not financial advice.
Share your thoughts in the comments, and don’t forget to share this analysis with your friends! ❤️

LINK – Back Inside the Bullish FlagOn Friday night, Chainlink lost its confluence support from the 18.50 zone and dropped sharply to just under $10.
However, looking at the chart, we can clearly see the importance of this area, marked by both the 2022–2023 accumulation resistance and the 2024 lows.
From there, the coin rebounded fast, managing to reclaim the 18.50 support and re-enter the bullish flag that started forming at the end of August.
This recovery shows strong buying interest — but no clear buy signal has yet appeared.
For now, LINK remains a coin to watch closely.
A confirmed breakout above 21.50 would open the door for a new bullish leg, with 30 USD as the next technical target.

link 14-10-2025Link, with a partnership between S&P Global and Chainlink, could contribute to an interesting trade. I'll share my opinion here.

TradeCityPro | LINK: Eyeing $18 for Potential Drop👋 Welcome to TradeCity Pro!
In this analysis, I’m going to review the LINK coin — one of the RWA projects, currently ranked 12th on CoinMarketCap with a market capitalization of $12.57 billion.
⏳ 1-Hour Timeframe
In the 1-hour timeframe, after Friday’s drop, the price fell to $16.78.
💫 Following this decline, the price made an upward correction up to the 0.618 Fibonacci level. After one reaction to this zone, bearish momentum returned to the market, and volume has been increasing.
✅ Currently, the price is moving toward the $18.31 level. Breaking this zone could trigger the start of the next downward leg.
⭐ The main support level remains at $16.78, and as long as the price stays above this zone, I won’t be opening any short positions.
📊 For long positions, the current trigger is $20.02.For earlier triggers, we need to wait for the market to form more structure and generate new entry signals.
📝 Final Thoughts
Stay calm, trade wisely, and let's capture the market's best opportunities!
This analysis reflects our opinions and is not financial advice.
Share your thoughts in the comments, and don’t forget to share this analysis with your friends! ❤️

Fear-Fueled Shakeout Sets the StageMassive liquidation shook the crypto space on Friday, October 10th with nearly $20B flushed out. But while the masses panicked, the charts show smart money buying.
LINK printed a textbook high-volume spring out of the range, signaling smart money absorption amid capitulation. The weekly candle closed deep into the range, reinforcing the idea that this wasn’t random volatility, it was structured accumulation and shakeout.
Volume on the Spring exceeded that of the Selling Climax (SC), which sets the stage for a potential retest. But don’t anchor to the $7.64 wick, that’s an anomaly. Instead, watch for price to revisit the EQ of that wick zone to form a higher low (HL) and validate the test.
This setup offers a compelling Risk-to-Reward profile. If the structure holds, a minimal very simple range target sits around ~$66. from here price could go much higher but one step at a time.

LINKUSDT – Possible Reversal After 5 Waves UpLINK has just completed a clear 5-wave impulsive move to the upside. With Wave V looking complete, there’s now a high probability of a corrective phase.
I’m watching for a potential drop towards the 17.5 USDT zone, which would be a significant percentage move from current levels.
📊 Potential Trade Levels:
Entry zone: 24.5 – 23.2 USDT
Stop Loss: 27.030 USDT
Target: 17.171 USDT
This scenario could unfold as an ABC correction.
⚠️ Disclaimer: This is just a personal trading idea based on Elliott Wave analysis, not financial advice. Please manage risk and do your own research before trading.

LINK FOR BUYHello friends
After a long time of suffering, Link finally made a move and collected good liquidity that can make it prone to good growth. And the safest way, as I always tell you, is to buy in stages and with respect to capital and risk management.
The goals are also clear
*Trade safely with us*

$LINK – PREPARING FOR A BIG DUMP – SQUEEZE TRAIN LOADING Traders,
I BELIEVE THE CRYPTO MARKET IS SETTING UP FOR A BIG, BIG, BIG DUMP!, NOT JUST LINK!
Last time, we nailed the BIST:LINK short from $24.55 — it hit Target 1 and Target 2 (the two boxes below) pixel perfect.
From $20.00 we expected a retrace back up toward the $23.00 region, before a potential dump to $17.00.
That scenario may now be unfolding.
Let’s break it down:
CVD & Market Participation – Bearish Divergence Building
Aggregated CVD Spot → still relatively flat → tells us there’s no real spot demand or accumulation. Spot buyers are not fueling this push.
Aggregated CVD Futures (Stablecoin-margined) → moving aggressively higher → lots of leveraged traders chasing the move up.
Aggregated CVD Futures (Coin-margined) → also moving aggressively higher → even riskier longs, since collateral is crypto itself (double downside risk if LINK sells off).
👉 Why this is a bearish divergence:
Price is being pushed higher only by aggressive leveraged longs, while spot (the foundation of demand) is not confirming. This creates a fragile rally that can easily unwind into a long squeeze.
Order Flow – Signs of Absorption
On Binance & Bybit perps, we see aggressive buyers stepping in (CVD making higher highs).
But price is not moving higher accordingly.
This is a classic absorption signal: passive limit sellers are absorbing the buying pressure, preparing for reversal.
Market Context – Entering the PRZ ($23–24)
HTF VAL (Value Area Low) at this region.
LTF VAL aligns perfectly here too.
Single Prints (TPO profile) → thinly traded zones where price moved quickly in the past, often acting as magnets and reversal points.
Imbalances stacking at these levels, showing inefficiency that can flip.
AVWAP Confluence → multiple anchored VWAPs cluster in this zone, creating strong resistance.
All of this builds a confluence-heavy Potential Reversal Zone (PRZ) at $23–24.
My Take
We are entering a Reversal Zone packed with:
No real spot demand,
Leveraged longs chasing,
Absorption in order flow,
Strong technical confluence (VALs, TPO singles, Imbalances, AVWAP).
⚠️ This is the perfect fuel for a long squeeze dump back toward $17.00.
Trade safe, manage risk. Adios 🚀🔪
