LINKUSDT 12H1. Trend Structure
The price is in a descending channel (marked in orange) – the upper line acts as resistance, the lower line as support.
Currently, the price has rebounded from the lower boundary and is approaching the middle resistance levels.
2. Key Levels
Support:
21.73 USDT (the closest local support – already broken upwards, now being retested).
20.17 USDT (stronger support that previously halted the decline).
18.10 USDT (bottom of the channel – the main defense for the bulls).
Resistance:
23.22 USDT (local resistance, the price is very close to this level).
24.14 USDT (important horizontal resistance).
25.54 USDT (key level, a breakout of which could negate the descending channel).
3. Indicators (Stoch RSI)
The Stoch RSI is in the overbought zone (>80).
This suggests that upward momentum is slowly fading and a correction or consolidation near resistance levels (23–24 USDT) is possible.
4. Scenarios
Bullish:
If the price breaks and holds above 23.22 USDT, the next target will be 24.14 USDT, followed by 25.54 USDT (the upper boundary of the channel).
A break above 25.54 USDT could signal the end of the downward channel and a transition to a sideways/upward trend.
Bearish:
If the price rejects the 23.22 level and the Stoch RSI begins to decline, we could return to 21.73 USDT.
Losing this level will reopen the road towards 20.17 USDT and even test the lower limit of the channel (around 18-19 USDT).
Trade ideas

LINK/USDT: Daily Breakout to 50?BINANCE:LINKUSDT is gearing up for a bullish breakout on the daily chart , with an entry zone in the red box between 15-20 near a critical support and consolidation zone.
The target range of 38-50 aligns with the next major resistance, signaling strong upside potential. Set a stop loss at 15 on a daily close below to manage risk effectively.
A break above 22 with solid volume could ignite this move, driven by network upgrades and altcoin momentum. Watch market trends! 💡
📝 Trade Plan:
✅ Entry Zone: 15 – 20 (red support & consolidation box)
❌ Stop Loss: Daily close below 15 to manage risk
🎯 Target Zone: 38 – 50 (next major resistance area)
NOTE: This set up is only for spot trading .
Ready for this lift-off? Drop your take below! 👇

LINK BULLISH outlook Link Breaks 1hr resistance , that is a good Bullish signal to go long targeting daily order block

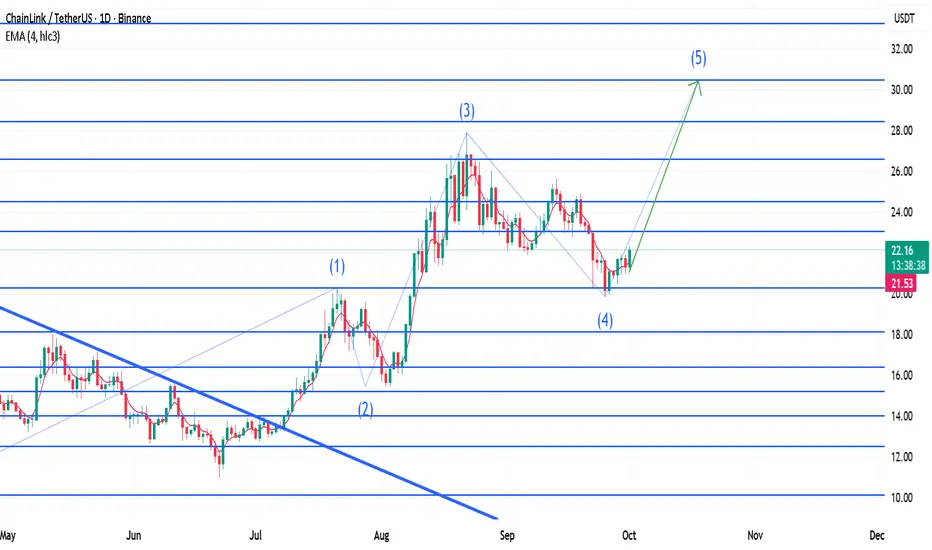
Chainlink 5th wave target 30,4$ then crashIN my view chainlink is drawing last 5th wave of the bulilsh cycle targeting 30,4$ where I expect bearish inversione and the beginning of the bear cycle
CHAINLINK (LINKUSDT) IN AFAVOURABLE ZONE TO BUYThe project Chain link is in the favorable zone to make entries but since the ALTs season has not yet started so build the positions gradually. The CMP is the FIB level 0.618 which is a good level for DCA as well.
So build your entries and wait for the ALT season to ride .......
What are your views on this ??????

LINK
📊 **Setup LINK/USDT (15m)**
🟢 **Entry Zone (Demand QML):**
≈ 21.043 – 21.048
🔻 **Stop Loss (SL):**
20.777
🎯 **Take Profit (TP):**
* TP1 👉 21.263
* TP2 👉 21.545
* TP Max 🚀👉 21.879

TradeCityPro | LINK Coin Testing Key Resistance👋 Welcome to TradeCity Pro!
In this analysis, I'll be reviewing the LINK coin. It’s one of the popular RWA crypto projects with a market cap of 14.56 billion dollars, ranked 13th on CoinMarketCap.
⏳ 1-Hour Timeframe
In the 1-hour timeframe, after a downward movement, this coin has formed a large range box with the upper boundary at $22 and the lower boundary at $20.02.
📊 Currently, after getting support at the lower boundary of the box, the price has moved upwards in two legs toward the $22 level and has now reached it.
🧩 The price has reacted to this level before, and it has significant strength. It can be viewed as a Maker Seller zone.
✨ We can confirm the bullish trend of LINK after breaking this level. Before breaking this level, opening a position is risky, and if we want to open a position, we need to pay close attention to risk and capital management.
✅ In the upward movement towards the top of the box, a divergence has formed in the RSI. We can confirm this divergence activation by breaking the 40.91 level in the RSI. For the price itself, we can confirm a bearish trend by stabilizing below 21.25.
📉 For a short scalp position, we can enter with the break of 21.25. But be cautious, as this position is very risky, and if you open it, make sure to take profit with low-risk-to-reward ratios because the market momentum is not fully in our favor, and the chance of volatile fluctuations is high.
🔔 For a long position, the best trigger is the breakout of the top of the box. If the price touches this level multiple times, we can find an accurate trigger for the breakout, and in subsequent touches, we can enter with the breakout.
📝 Final Thoughts
Stay calm, trade wisely, and let's capture the market's best opportunities!
This analysis reflects our opinions and is not financial advice.
Share your thoughts in the comments, and don’t forget to share this analysis with your friends! ❤️

Long trade
Pair: LINKUSDT Perpetual
Trade Type: Buy-side trade
Date: Fri, 26th Sept 2025
Time: 9:00 am
Session: London to NY Session AM
Trade Details
Entry: 20.234
Profit Level (TP): 22.907 (+12.83%)
Stop Level (SL): 20.234 → 20.139 (-1.20%)
Risk-to-Reward (RR): 10.72
Market Structure & Context
Trend: Price recently pulled back into demand after a strong markdown. Current structure suggests accumulation before expansion.
Support Zone: 20.1–20.3 (Inflection point + consolidation base).
Breaker Block: 21.36–21.40 (first resistance to test).
Target Supply: 22.4–22.9 zone (aligned with FVG + previous OB).
Volume: Spike at inflection point suggests absorption of sell pressure and transition into demand.
Narrative (Wyckoff / SMC)
Accumulation: Price consolidated within 20.1–20.3 after a liquidity sweep of prior lows (19.83).
Inflection Point: Entry triggered post-consolidation breakout, aligning with early markup phase.
Liquidity Draw: Next upside target is the cluster of FVGs + Order Block near 22.9, which aligns with TP. Stop Placement: Below consolidation low at 20.13 to protect against false break.
Key Levels
Entry Zone: 20.23–20.24
Stop: 20.13
Intermediate Targets: 21.36 / 21.90
Final Target: 22.90
Action Plan
Monitor 21.36 breaker block as first reaction level.
Take partials at 21.90.
Hold remainder toward 22.90 liquidity pool.

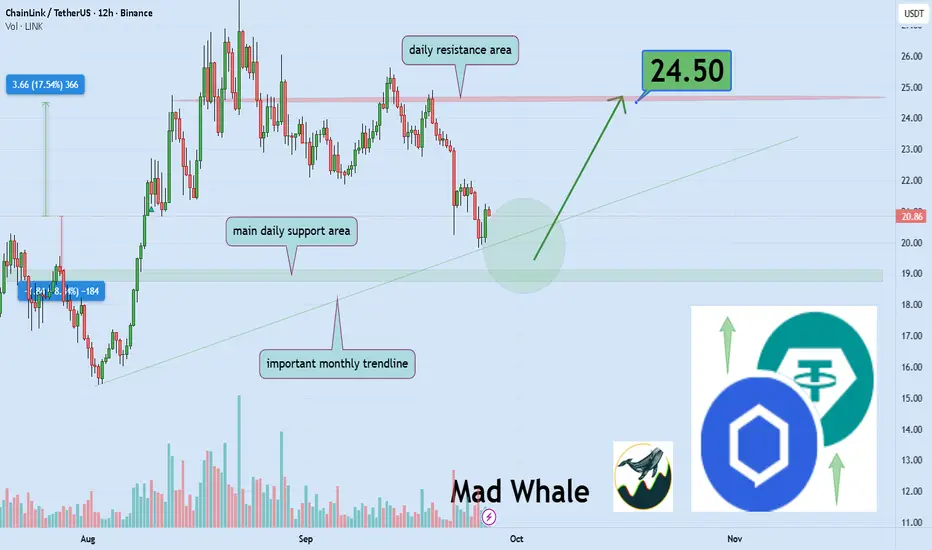
Is Chainlink ready for a potential 17% upside move? toward $24.5Hello✌️
Let’s analyze Chainlink’s price action both technically and fundamentally 📈.
🔍Fundamental analysis:
Deutsche Börse’s Crypto Finance is using Chainlink PoR to audit $17B in reserves.
This boosts LINK’s role in tokenization and could raise demand for the token.
📊Technical analysis:
BINANCE:LINKUSDT is testing a critical daily support along a strong trendline; if this level holds, a potential 17% upside toward $24.5 could unfold. 📈🚀
📈Using My Analysis to Open Your Position:
You can use my fundamental and technical insights along with the chart. The red and green arrows on the left help you set entry, take-profit, and stop-loss levels, serving as clear signals for your trades.⚡️ Also, please review the TradingView disclaimer carefully.🛡
✨We put love into every post!
Your support inspires us 💛 Drop a comment we’d love to hear from you! Thanks, Mad Whale
LINK — Massive $20 Support Zone, Wave 5 Loading?I haven’t seen this much confluence stack in one place for LINK in a long time. The $20–$19 zone is absolutely packed with technical factors, making it a critical level to hold for bullish continuation.
🧩 Confluence at $20–$19
Golden Pocket: $20.19 (0.618) → $19.59 (0.666)
Yearly VWAP: $18.87
21 Weekly EMA/SMA: $19.68 / $18.39
Yearly Open: $20.02
0.666 Fib Speed Fan: aligned with $20 zone
1.0 Trend-Based Fib Extension: at $20 → completion of wave 4
Pitchfork Buy Zone: 0.702–0.75 levels right at $20
Midpoint of 1-Year Trading Range
Anchored VWAP (from $30.94 high, 287 days): $19.55
Daily Level: $19.66
Weekly Level: $19.28
Monthly Level: $19.27
Yearly Level: $19.51
🟢 Long Setup
We’ve already seen a bounce from $20, confirming demand at this zone.
Plan: Buy now and add on retracements if price dips back toward $20/$19.
Stop-Loss: Below 21 SMA weekly at $18.39
TP1 → $30 psychological resistance & prior key high
TP2 → $34.57 (0.618 Fib retracement)
This setup offers an R:R of 1:7+ with a possible yield of +70% if played toward TP2.
Structure Outlook
With this stacked confluence, it looks like wave 4 has completed and LINK could be ready for its next leg up. The $20 zone is make-or-break, and as long as it holds, the case for bullish continuation remains strong.
Indicators used
DriftLine — Pivot Open Zones → For identifying key yearly/monthly/weekly/daily opens that act as major S/R reference points
Multi Timeframe 8x MA Support Resistance Zones → to identify support and resistance zones such as the Weekly 21 EMA/SMA.
➡️ Available for free. You can find it on my profile under “Scripts” and apply it directly to your charts for extra confluence when planning your trades.
_________________________________
💬 If you found this helpful, drop a like and comment!

LINK has formed a Double Bottom pattern📊 LINK Market Update
LINK has formed a Double Bottom pattern ✅
It broke out of the red resistance zone 🔴 and is now approaching the first target at the blue line level 🎯
If momentum continues, the second target will be the next blue line level 📈

LINK analysis : What is next ? MORE DUMP OR ...... ?There are two scenarios that could play out.
bottom is almost in. A pump toward 30 and above is the next major move. in short term tho, LINK can either go up from 20 level or grab liquidity at 18 level and then go up.
overall, the bottom is almost in and look for spot buys at 18-21 area.

LINK/USDT - Ready for Takeoff? Major Bullish Reversal in Play!🚀 Trade Setup Details:
🕯 #LINK/USDT 🔼 Buy | Long 🔼
⌛️ TimeFrame: 1D
--------------------
🛡 Risk Management (Example):
🛡 Based on $10,000 Balance
🛡 Loss-Limit: 1% (Conservative)
🛡 The Signal Margin: $534.47
--------------------
☄️ En1: 20.74 (Amount: $53.45)
☄️ En2: 19.34 (Amount: $187.06)
☄️ En3: 18.4 (Amount: $240.51)
☄️ En4: 17.51 (Amount: $53.45)
--------------------
☄️ If All Entries Are Activated, Then:
☄️ Average.En: 18.87 ($534.47)
--------------------
☑️ TP1: 24.56 (+30.15%) (RR:1.61)
☑️ TP2: 27.87 (+47.69%) (RR:2.55)
☑️ TP3: 32.73 (+73.45%) (RR:3.93)
☑️ TP4: 40.16 (+112.82%) (RR:6.03)
☑️ TP5: 50.34 (+166.77%) (RR:8.91)
☑️ TP6: Open 🔝
--------------------
❌ SL: 15.34 (-18.71%) (-$100)
--------------------
💯 Maximum.Lev: 3X
⌛️ Trading Type: Swing Trading
‼️ Signal Risk: 🙂 Low-Risk! 🙂
🔎 Technical Analysis Breakdown:
This technical analysis is based on Price Action and Smart Money Concepts. All entry points, Target Points, and the Stop Loss are calculated using professional mathematical calculations. As a result, you can have an optimal trade setup based on great risk management.
Technically, LINK is bouncing off key support levels and forming a solid accumulation structure, suggesting strong hands are preparing for a breakout. With multiple confluences aligning — including long-term trend support and bullish divergence — this setup favors patient swing entries with impressive risk-to-reward potential.
📊 Sentiment & Market Context:
Chainlink (LINK) is showing signs of renewed bullish strength following a consolidation phase and broader market resilience. The crypto market has recently seen improved sentiment amid increasing institutional involvement and growing anticipation around real-world asset tokenization — a core use case for Chainlink's oracle solutions.
🔎 About LINK:
Chainlink is a decentralized oracle network that enables smart contracts to securely interact with real-world data. It plays a critical role in DeFi, insurance, gaming, and more — bridging on-chain and off-chain systems. As adoption of decentralized infrastructure grows, LINK continues to position itself as a key infrastructure asset in the blockchain ecosystem
⚠️ Disclaimer:
Trading involves significant risk, and past performance does not guarantee future results. This analysis is for informational purposes only and should not be considered financial advice. Always conduct your research and trade responsibly.
💡 Stay Updated:
Like this technical analysis? Follow me for more in-depth insights, technical setups, and market updates. Let's trade smarter together!

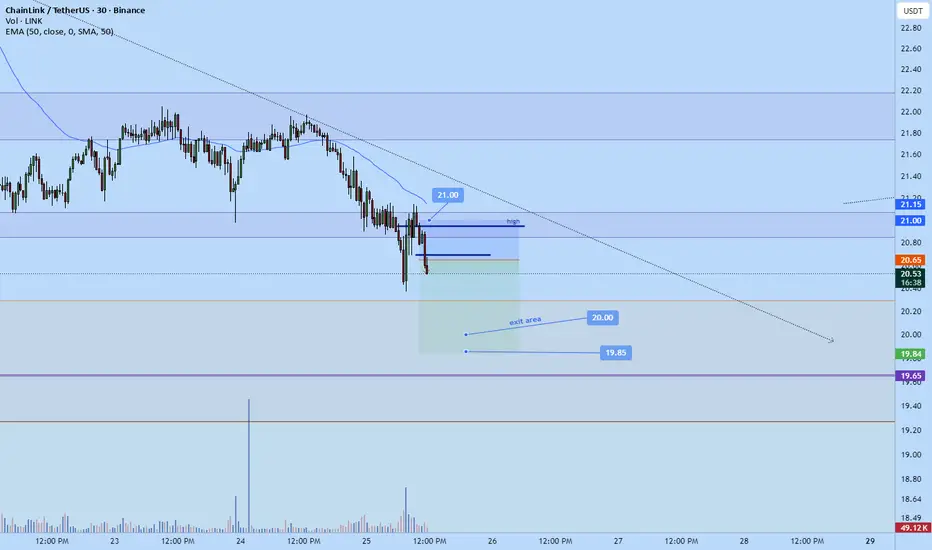
chainLink scalp short sub $20Just went short on chainlink
sl: 21
Tp: 19.85
Potential early close at $20
Roughly 2 RR trade
LINK MOON?LINK is showing Bullish Divergence making higher lows and lower low on Rsi , it is safe to long from here

LINK/USDT Weekly FVG Tap
BINANCE:LINKUSDT has arrived right at a strong level that I see as a solid opportunity to enter.
This zone, together with the lower DCA area I highlighted as backup, looks like a prime region to build a spot position on LINK.
I’ll share another update if needed.

Chainlink (LINK): Successful Re-Test Near 100EMA | BullishChainlink has retested the 100 EMA together with the broken resistance, which has now turned into support. Price reacted well from that zone, keeping the bullish structure intact. As long as buyers continue to defend this area, we look for continuation towards the marked target above.
Swallow Academy

LINKUSDTLast week BINANCE:LINKUSDT , after touching 24.80 dollars 🚀, the price failed to hold and moved into correction. The overall structure still shows a range between key support and resistance, with compression signaling the potential start of the next trend. Currently, momentum leans slightly bearish 📉, but the market has not yet confirmed a clear direction.
Key Levels:
Initial support: 23.18 dollars 🛡️
Next supports: 22.50 dollars – 21.60 dollars
Nearby resistance: 24.40 dollars
Higher resistances: 25.20 dollars – 26.50 to 27.50 dollars 🎯

Longing Link Long bias here.
BTC likely corrects ~117,447 → alts follow.
Total 3 broke out but likely retesting the downtrend line → not the big run yet. (still need to look into that further)
TLTR Long LINK @ 24, TP aligned w/ BTC target, then reevaluate.
Eyes on BTC.

$LINK – PREMIUM PUMP, DISCOUNT DUMP? THE SQUEEZE SETUP EXPLAINEDLINK – PREMIUM PUMP, DISCOUNT DUMP? THE SQUEEZE SETUP EXPLAINED
Traders,
LINK — and likely the broader crypto market — is setting up for a premium squeeze that turns into a discount dump.
ANALYSIS
On Binance Perpetuals you can see longs piling in near $24 while price stalls → CVD pushes up, price doesn’t. That’s buying with no progress = bearish absorption with CVD non-confirmation. Check the data here ibb.co
Aggregated Spot CVD (all exchanges) is flat. No real spot demand → only leveraged longs propping up price. Check the data here ibb.co
Price is now inside the Golden Pocket retracement zone. High-probability reaction area where strong hands fade late longers.
Measuring swing low → swing high (06 Sep – 13 Sep), price is right at the Value Area High (VAH). This is the edge of acceptance.
Confluence: we’re also tagging the upper Anchored VWAP band (green line) from both the swing high and the swing low.
→ Why this matters: Anchored VWAP tracks the average cost basis of participants from a chosen pivot. When the swing low → high AVWAP band and the swing high → low AVWAP band overlap in the same zone, it creates double confluence: longs from the bottom see this as “expensive” and reduce risk, while shorts from the top defend their break-even. Historically, these overlaps act as strong rejection zones unless fresh spot demand breaks through.
MY TAKE
Expecting rejection at $24 and a move back toward $21 (blue AVWAP test). I think - based on data - that we might move even lower.
Setup = trapped longs at premium + no spot demand + strong confluence of VAH, Golden Pocket, and dual AVWAP resistance.
Invalidation = acceptance above $25 with spot CVD joining the move.

LINK (Chainlink) – Triangle Pattern Breakout Loading?#LINK is currently consolidating within a triangle pattern on the 4H timeframe. No bearish signals are visible for now, but volume remains low — indicating traders are waiting for a decisive move.
Key Points:
Triangle pattern forming on 4H chart
No bearish structure yet
Low volume = patience needed
Breakout above resistance with strong volume = bullish confirmation
Best setup: Enter long on retest with proper risk management
Plan the trade, trade the plan. A clean breakout with strong momentum could bring exciting upside opportunities.
What’s your outlook on #LINK? Do you expect a bullish breakout, or will bears surprise us? Drop your thoughts
#LINK #Chainlink #Crypto #Altcoins #Breakout #TrianglePattern #TradingView #CryptoTrading #PriceAction #CryptoCharts
LINK LONG AND SHORT IDEAHi guys . i have this setup for BINANCE:LINKUSDT a double position . a long to upper FVG then short from there . in both case my SL above and blow major pivots.

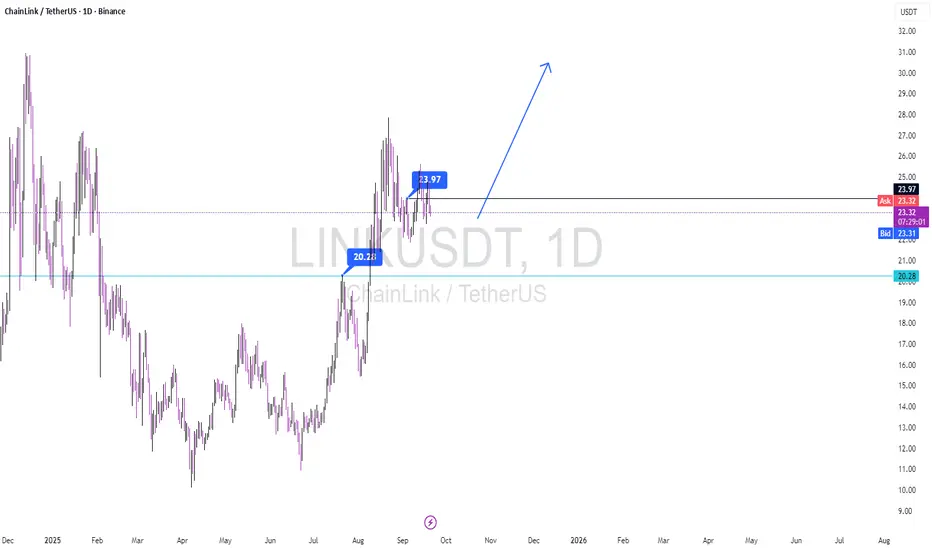
Professional Analysis: LINK/USDT (Daily Timeframe)Current Setup: LINK has successfully breached and held above the key support level of $20.28, demonstrating bullish momentum. The price action is currently consolidating in what appears to be a Bull Flag pattern, suggesting a potential continuation of the prior upward move.
Trigger & Confirmation: A decisive daily close above the pattern's resistance at $23.97 will serve as the primary buy signal according to my strategy. I am awaiting confirmation from a secondary indicator before considering this trigger fully validated.
Projection: Upon a confirmed breakout, LINK possesses a clear trajectory to target higher resistance levels on the daily chart.
Risk Management: A strict stop-loss is essential for this setup. Any move resulting in a daily close back below $20.28 would invalidate the bullish structure and signal an exit.
I will issue a formal ' SPECIAL SIGNAL ' alert once all confirmation criteria are met and the trade is officially live.
Trade Safe,
S.Reza Mehrjuyan / CEO FNS
Analyst, Manager