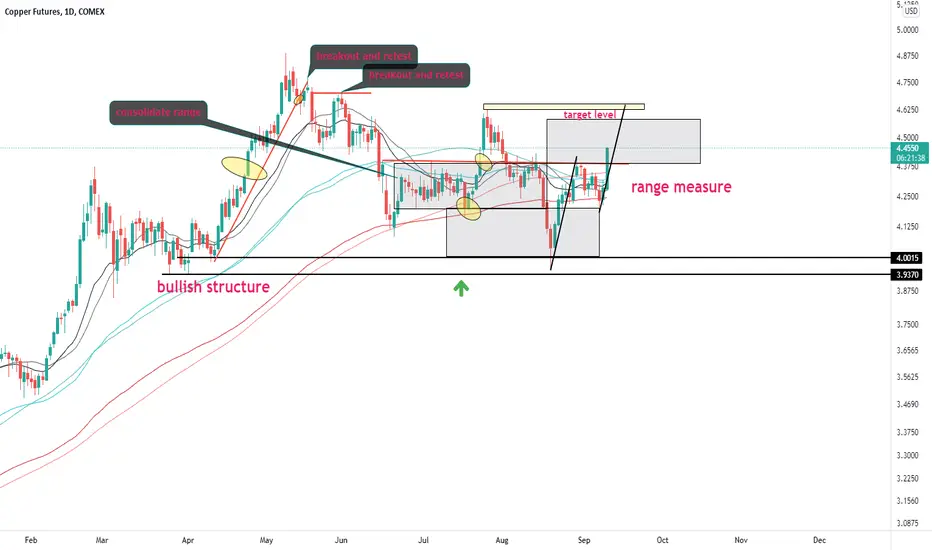
JICPT| Copper broke the range moving on to next one!Hello everyone. Fundamentally, copper is used in everything from wiring to electronics, and electrical cars. It is regarded as a leading indicator of global economy.
Previously, I've published ideas about copper and projected price by measured move. Now, price has finally broken out the range. What' next?
Again, I replied on abcd pattern and measured move(range). The target is previous high level of 4.62ish.
It's quite simple and easy to understand. What's your opinion?
Give me a like if you're with me.
CA1! trade ideas
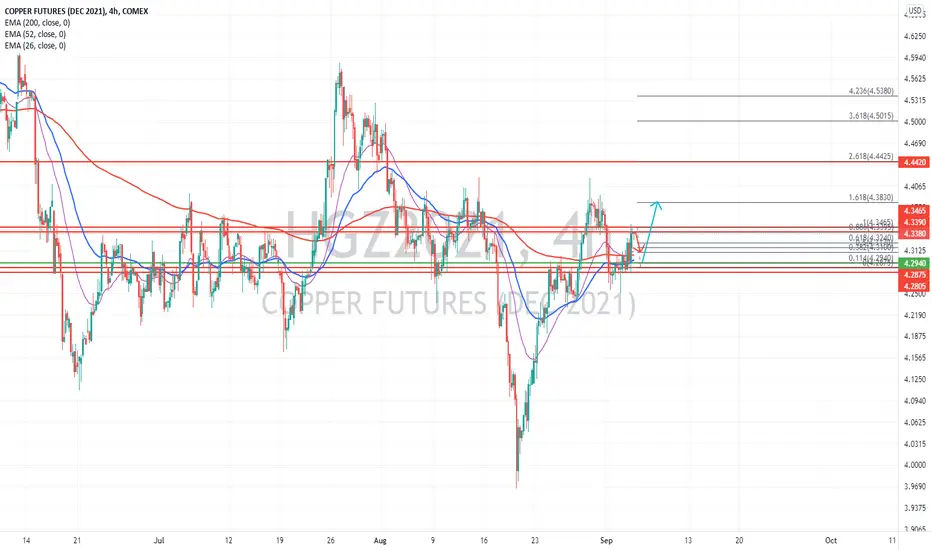
Copper breakout price targetwere at the 0.5 fib now, which is also the trendline for the descent, and just above the daily 200
if we go through here, retesting the highs but likely next upward target is the 1.618 fib at 900

Copper: lifting its head?Above 4.35 supports a bullish trend direction.
Drifting of the MACD supports a bullish trend direction.
Wait for the trend to develop further for some confirmation.
Remains above its 200-day simple moving average supporting a bullish trend.

DXY COPPER9.13.21 This is about comparing the DXT to Copper Range of price and volatility. I'm sure this is taught somewhere, but this is something that I had to derive on my own and it took me many years before I had a conscious awareness of behaviors that would become important priorities for my trade decisions. This is not an eloquent presentation, and it may be incomplete, but it's something that I processed into my trade decisions consistently even though it is not perfect. So factoring in warts and all, I would suggest that you spend an hour or so, try to duplicate the patterns, and calculate the numbers for yourself, and then decide if it has any value for you or not. This is because I don't think it's that easy to find information like this, yet you have to decide if it has any meaning for you or not. One of the biggest conundrums of trading is that you hear what wise people tell you you need to do... Such as " trade what you see," when you really don't know what that means. I have chosen volatility and price range into my decision-making. I am not an educator and a teaching scholar. My mission was to trade better for myself, and then help a few friends that could use some help. You have to think about volatility and ranges in my opinion, there really is no choice as I see it. But you have to decide. It's worth an hour or two of your time. I only wish I had only wasted a couple of hours of my time learning what I needed to know.

New trading strategy upgrade - CopperCopper is on a correction on a 60k chart and let's wait for buys from resistant level on daily chart

Copper has just entered a Wyckoff Distribution!Hello all.
I think that Copper has just entered a phase of distribution, and I will be longing it for the formation of an Upthrust that will bring the price beyond the Buying Climax.
Like if you enjoy the idea, and consider following and supporting me.
Peace.
TrickleDown FX

Copper9.9.21 Copper I plan to post more on copper. The specific reason for talking about this market has to do with how I make distinctions about probability and markets that are not likely to break out, versus markets that will reverse and go in the opposite direction.

Copper The pullback in copper ended up being a three wave rise wherein it retraced slightly more than 61.8% retracement in international copper chart of wave Y.
This opens up the possibility of one more leg to the down move in the form of wave Z.
Overall look
Retracement levels in copper international chart
MCX chart retracement
Weekly macd bearish
Daily macd below zero line and down tick
Rsi in Weekly down tick
Rsi in daily down tick
Dmi adx also Negative
Below middle bollinger band
Disclaimer
I am not sebi registered analyst
My studies are Educational purpose only
Consult with your Financial advisor before trading or investing

Copper uptrend still validShort term movement looking short position at price 4.3390-4.3395 target at 4.310.
Long position at price 4.2940 target 4.3395 & 4.3830 in extension.
Provided support 4.2805 still strong.
TAYOR
Video - Relationships Between Corrective WavesEducational video on how to anticipate the end of corrective waves so you can rejoin the trend.

Copper Futures Daily AnalyseCopper Futures Daily Analyse
Please be fully informed regarding the risks and costs associated with trading the financial markets, it is one of the riskiest investment forms possible.

COPPER-simple setup-trade idea-Analysis: Copper had a strong momentum to the upside since the beginning of the year of 2020. So far we had a strong rising market without any decent retracement. I expect a strong retracement from here, we should go back to the normal levels (around 3$) to continue the rise on a healthy way. The demand for copper is still huge from the automotive industry (copper is a necessary component of electric cars). Here you can see on the chart my expectations to the upcoming weeks. We had a strong trend to the upside which is broken, I also see a noisy downtrend forming, aiming the 3$ level. Please find below our community trade idea below:
Trade: SHORT
Entry: 4.29$
1st target: 3.5$
2nd target:3.17$ (+25%)
S/L: 4.530$ (-5.96%)

Week 35 copper, gas, nasdaq, coffee, crude oil, sugar longMany markets trade above their 18 moving average, i keep the trailing the stop on the lowest low of the prior two days.
Last week BTC got stopped …
This week copper might be moving up…

Copper at Critical Level - Will Bulls or Bears Win? Copper is looking to reestablish prior trendline support, which would put the red metal back on a bullish path. Although failing to pierce the level would likely see prices fall back to the psychologically imposing 4.000 level. Momentum appears to be healthy with RSI rising and the MACD line crossing above its signal line, a bullish sign.

Copper prices may turn lower after re-testing former supportCopper prices are retesting support-turned-resistance in the 4.26-4.45 zone, marked by the intersection of a six-month inflection area, the uptrend from the Covid-induced March 2020 low, and a neckline support from early March. Signs of indecision in the daily candlestick structure and negative divergence on short-term momentum studies warn of topping.
In all, the setup suggests that a corrective upswing following a major bearish breakout has run its course, with the emerging downtrend aiming to reassert itself in the near term. The first major layer of support lines up near the 4.00 figure. Fed-speak at the Jackson Hole symposium - particularly the speech from Chair Powell - may emerge as the catalyst for weakness. A measured-move projection implies a move below 3.40 may ultimately materialize.

COPPER COMEX HGcopper sellllllllllllllllllll only chek chart enjoy mandi bindas baki jada likhana mana hai #KRRISHCOMMODITIES

Copper Futures Short Term Reversal TradeThe Commodity has reached lower trend line and might take support and undergo a reversal rally. Trade is supported by Supports Nearby + 200 EMA.
Risk Reward Ratio - 1.5:1
SL is placed below support zone and target is placed near upper trendline and swing high.
Note : Enter September Futures and Roll Over the contracts unless Stop Loss or Target Is Met.

Copper into JacksonCopper: Market Commentary 23.08.2021
A couple of points to note here; we ticked the 161.8% extension which was our third wave target in our previous copper chart at the beginning of 2021.
It always comes down to the same situation; an impulsive complex which can be called sound, but which has one sickly component. As we head into Jackson, according to the long term wave count we have the following two charts which distinguish the five wave sequence:
So now buyers are a point up after sweeping the highs, they are in a position to take profits over the coming months and quarters and bring together their own herd again at 3.33x lowest play the fifth wave inside of our major third wave.
So far we have done a good job of shepherding the flows in copper as all has been predicable on the technical side; here looking for 3.33x before a slingshot towards 5.50xx in 2023.

COMEX Copper - Head and Shoulders complete. Expect rejectionCOMEX - Copper- Futures Head and Shoulders complete. Expect rejection from 4.24. If it SRF's (support resistance flips) the neckline then Target 1 becomes 3.60.

New trading strategy upgrade - CopperHi traders, this is my personal trading idea only. Please give an AGREE/ LIKE, my trading strategy is Price Auction - Chart only, I don't use indicators, MA, signals and trend line etc. Your comments are highly welcome. We need a relax and happy trading with happy ending on each trade. My chaos drawing is not to predict and guess the further, it is my plan where we are on the chart and how we shall trade on what we see. Good luck guys.

$HG1 $Copper ABC correction complete I am calling the bottom in copper price and price just bottomed on Aug 19 (which incidentally is also when spx made the bottom).
The bottom on Aug 19 is also the support level in March 2021 around 3.9585. Aug 20 current price is sitting above MA200. which is a positive sign but we really need to get it above MA50 and the rest to go full on bull from here. However, if it breaks 3.9585 then it could go a lot lower.
Copper and Gold tend to move in opposite direction and generally gold is used as a hedge against recession and inflation, and copper is an indicator of economic activity.
I am expecting to see price to move up from here.


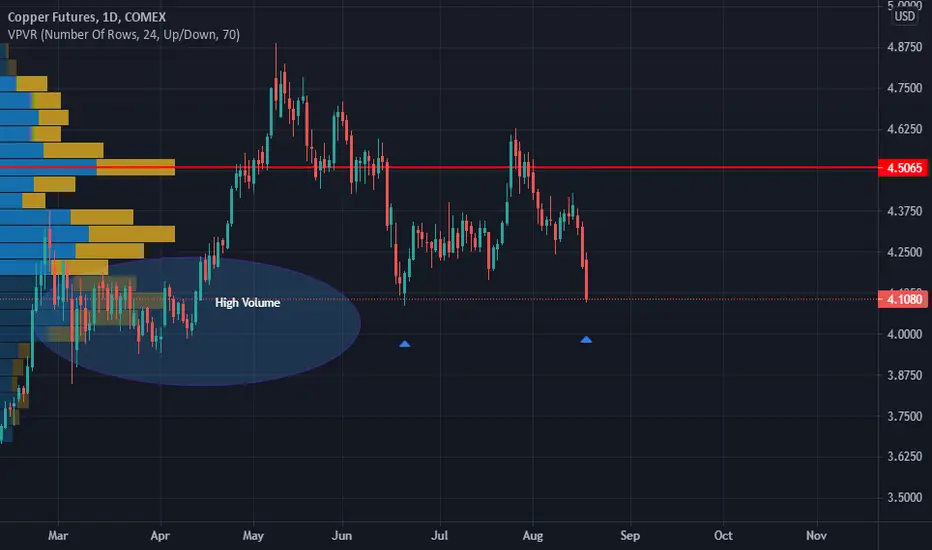
BUYHG reached to high volume area and forming double bottom .
Now bulls should defend their position so I expect nice move up.
I will take long for swing with tight SL because currently the bears are in control.