FSLR - Entry, Volume, Target, StopEnter when price clears 221.88
On above average volume
Target: 257 area
Depending on your risk tolerance: 210.21 gets you 3/1 Risk/Reward
0R06 trade ideas

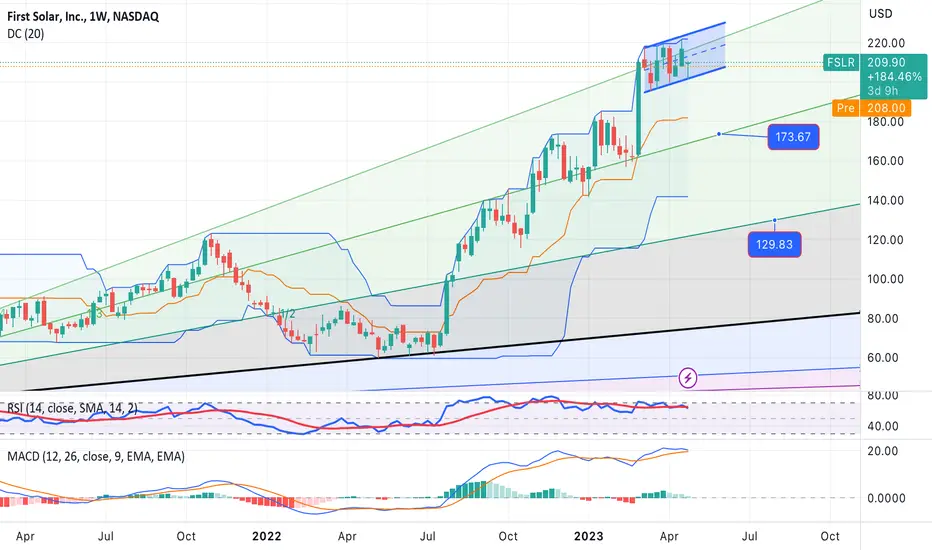
FSLR- SELL strategy The first idea profit objective @ 174.00 was me and we respected the GANN support 173.00 area.
Likely the share will mnove little higher at first, and for that reason we SELL anew again @ 195-205 area and place profit area @ 178.00 for now. For long-term positions, we place profit @ 135.00 for now,.

FSLR-Medium-term SELLNo change in view.
Overall, one keeps selling into rallies here, even though the run up has been sharp . This does not negate medium-term objective that may reach $ 130.00 again, with interim stop @ 173.50 area. For now SELL current $ 209.00-2.15 window with first profit objective @ 174.00, and re-instate on corrective action again for a move to $ 135.00.
#Solar Perking UpNASDAQ:FSLR 4 day mini coil right into All Time Highs ATHs
NASDAQ:CSIQ got the looks as well in #solar space
$FSLR ascending triangle catalyst FSLR has been consolidating since the last earnings and has formed a month and a half ascending triangle. Earnings this coming week could be a catalyst for a move higher. One interesting note, there is a gap pending fill to the upside from 2008! Not saying it will fill next week, but maybe in the next few months, a very interesting trade.

Buy more at 218 for 300 target First solar showing continues momentum & strength.
Add some more here.
Target 300

FSLR- SELL LONG-TERMThis one also very much manipulated, and when we look at the long-term picture, it is quite overdone. Besides we are above Gann resistance levels, and also hammer top. I feel within 6-9 month period we should decline towards $ 120.00 for the share. Therefore, SELL current $ 210 level and place stop-loss @ 240 for now and a take profit at $ 135

First Solar 1D Possible Breakout of a Bull Flag FormationThe stock is showing a strong green day which could be the start of a breakout from the current bull flag formation.
First Solar's (FSLR) fundamentals support this thesis. The company has a large backlog which will take multiple years to work through.
It can be cheaper to build and run a solar plant than it is to buy gas for existing natural gas power plants.
First Solar is involved with large utility-scale solar installations with their efficient PV solar panels.
The company has strong expected double-digit revenue and earnings growth for the foreseeable future.

FSLR - Rising channelOn the chart, we can see a rising channel occurring for FSLR.
It has been ranging between the levels for almost 3 quarters.
We expect that the price will stay in the channel for a while.
You can buy at the lower boundary of the channel and exit at the resistance, which is the higher boundary of the channel.
Invalidation of this thesis would be if the price closes out of the channel.
Moreover, you can short at the resistance with a target at the lower boundary of the channel.
Good luck!


rising channel due for a breakoutwill play a short position if it reaches the resistance again. bearsih divergence in play too

First solar breaking out slowly CMP 204best buy @ 198-204.
short term target 300.
major target updates for members .
this stock is one of the leaders in current bear market past 16 months

FSLR sellIdea: sell call credit spread, or buy put.
It seems that FSLR may need to retrace after this parabolic move up.

First Solar MACRO Idea
Here we are looking at FSLR on the 1 Month TF…
While I don’t normally post ideas from this zoomed out on the chart, I thought I would briefly share this fun idea that I came across.
As you can see, we are analyzing where FSLR is currently, in reference to it chart history dating back to major support breakdown in 2011.
What I found interesting, is that if you stretch that previous support all the to the present date (on its trajectory), you can see that (so far) FSLR has been rejected from this previous support line.
Of course, this isn’t enough to base a trade off of, but it is very interesting that previous support from 2011 is now acting as resistance. Additionally, there is still half a month left on this candle, so there’s still plenty of time for it to break through that line and invalidate it.
Nonetheless, I thought it was interesting, and that some of you may find it interesting as well!
Let me know what you think in the comments!
Cheers!!

Long First SolarSolar energy is one of the leading technologies in the renewable energy industry. It is slowly eating away the oil industry's market share in energy production. Through economies of scale, the cost per unit decreased significantly over the past decade so there is a chance that First Solar might eventually break its all time high.
From a technical standpoint it is on a nice uptrend. I would buy some shares now then buy any dips above the uptrend.

Short FSLRShort FSLR: Its at the top of the channel and needs to retrace if it will continue higher.

FSLR PARALLEL CHANNEL - WILL IT BREAK SUPPORTMultiple hits on this parallel channel confirms the latest in Gareth's future FSLR play.

FSLR Ready to Break Support?Here we are looking at FSLR on the Daily TF…
As you can see, FSLR has been trading within an ascending parallel channel, with clear upwards sloping support and resistance. It has been trading within this rising channel since October of 2022, but I am expecting a breakdown from this structure in the coming days.
Ascending channels (as such) are bearish in their nature, thus, I expect for this channel to break to the downside soon. Additionally, the more something tests a zone (support OR resistance), the more likely it becomes for it to eventually break that zone.
As you can see, FSLR has tested support 4 times now, and is currently attempting to break down again. If it can’t hold this support, I find it likely that a move to the horizontal line will occur.
I will continue to monitor this chart, and update you if there are any significant developments.
What do you think will happen for FSLR? Let me know in the comments!
Cheers!

W 1.414Price remains above the .236 of the trend up.
FSLR has met targets to the upside plus some.
Earnings are 2-28 AMC.
Short interest is around 3.9%
No recommendation.
(I can not find the harmonic pattern anywhere that has a 4th leg terminating at the 1.414, but there have been a lot of these in the recent market. 1.414 is the square root of 2. I call it a W 1.414 and an M 1.414. If you know the name of this, please let me know)

$FSLR to the dumpsterSecond bear flag in play and the stock is overvalued af with continuous downgrades incoming. Looking for 163,157,151,146 in the next few weeks

🟩 $FSLR - Bought hereConstructive setup of a Cup with Handle
98/100 Relative Strength
Sep22 - Dec 22 - Massive increase in Institutional Ownership (+370 new Funds /40%/)


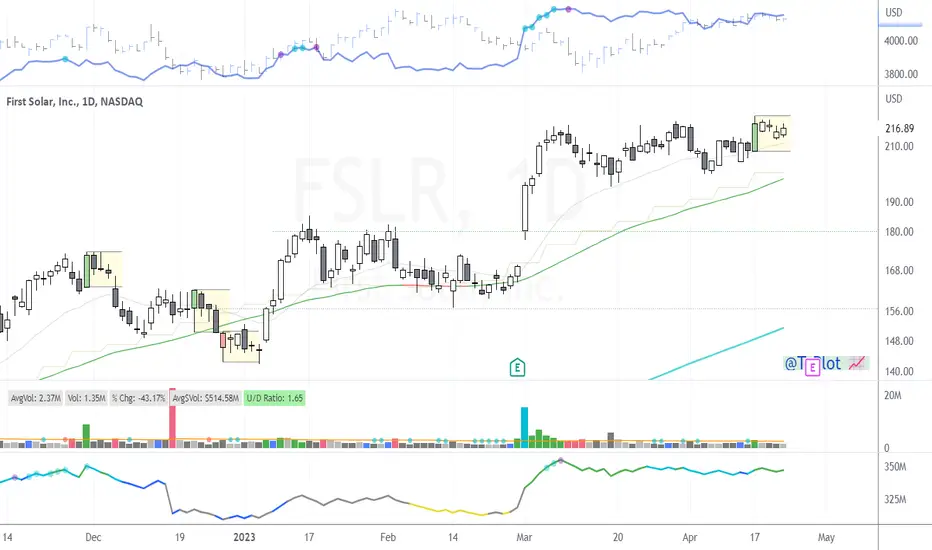
First Solar Might Be ShiningFirst Solar has been climbing since last summer, and some trend followers might have noticed its recent pullback.
The main pattern on today’s chart is the price zone around $162. It was initially relevant as a high in early November. Prices bounced there a few weeks later and knifed below it the following month. The stock rebounded in early 2023 and rallied to new highs.
FSLR then proceeded to pull back and is now trying to stabilize near the same price area.
The level also corresponds to roughly a 50 percent retracement of the rally between January 5 and January 17.
Next, prices are back above the 21-day exponential moving average (EMA) and 50-day simple moving average (SMA). That may suggest FSLR is ready to resume its uptrend.
Finally, notice how MACD has turned positive again.
TradeStation has, for decades, advanced the trading industry, providing access to stocks, options, futures and cryptocurrencies. See our Overview for more.
Important Information
TradeStation Securities, Inc., TradeStation Crypto, Inc., and TradeStation Technologies, Inc. are each wholly owned subsidiaries of TradeStation Group, Inc., all operating, and providing products and services, under the TradeStation brand and trademark. TradeStation Crypto, Inc. offers to self-directed investors and traders cryptocurrency brokerage services. It is neither licensed with the SEC or the CFTC nor is it a Member of NFA. When applying for, or purchasing, accounts, subscriptions, products, and services, it is important that you know which company you will be dealing with. Please click here for further important information explaining what this means.
This content is for informational and educational purposes only. This is not a recommendation regarding any investment or investment strategy. Any opinions expressed herein are those of the author and do not represent the views or opinions of TradeStation or any of its affiliates.
Investing involves risks. Past performance, whether actual or indicated by historical tests of strategies, is no guarantee of future performance or success. There is a possibility that you may sustain a loss equal to or greater than your entire investment regardless of which asset class you trade (equities, options, futures, or digital assets); therefore, you should not invest or risk money that you cannot afford to lose. Before trading any asset class, first read the relevant risk disclosure statements on the Important Documents page, found here: www.tradestation.com .
