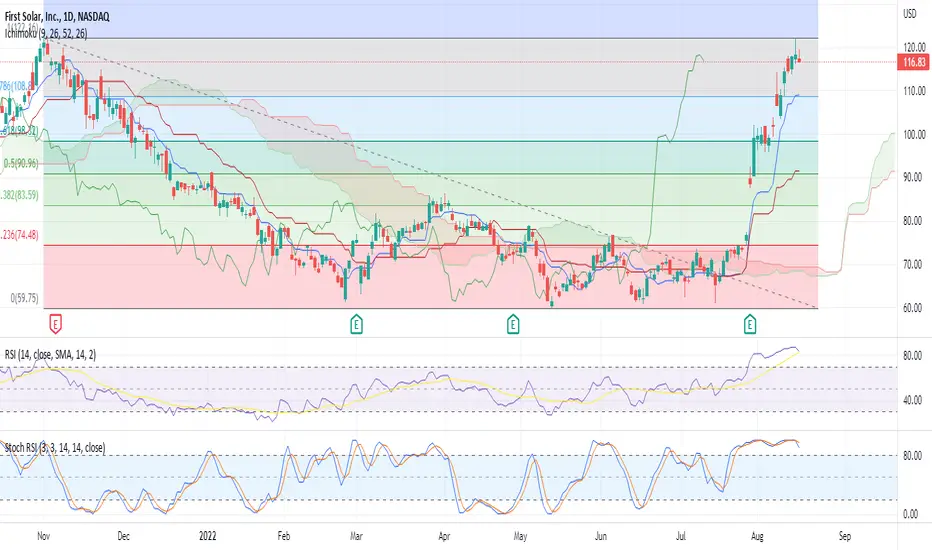
time to follow QQQ's (down)FSLR generally tracks closely to QQQ's, and recent divergence is temporary in my opinion
While its possible that the QQQ's break to the upside and exit their bear market, the more likely scenario is for the recent bear market bounce to fizzle out and we'll at least see a re-test of June lows.
repeat of June 03-16 would be 17% decline for FSLR --which puts it at ~$112. QQQ's only lost 12% in that time frame, but note that the low average daily trade volume for FSLR contributes to its price volatility both directions
here is a quick comparison I did of volume activity of FLSR vs a couple of its peers:
First Solar, Inc. (FSLR)
MCap 14.7B
Avg. Volume (10) 3.91M
Avg. Vol x price = 537,742,300 (0.37% of MCap)
10.69% of Shares Held by All Insider
82.20% of Shares Held by Institutions
Sunrun Inc. (RUN)
MCap 8.09B
Avg. Volume (10) 6.02M
Avg. Vol x price = 228,783,400 (2.82% of MCap)
5.90% of Shares Held by All Insider
95.03% of Shares Held by Institutions
SunPower Corporation (SPWR)
MCap 4.83B
Avg. Volume (10) 3.559M
Avg. Vol x price = 98,904,610 (2.04% of MCap)
51.3% of Shares Held by All Insider
39.41% of Shares Held by Institutions
0R06 trade ideas

FSLR-SELL +++We have moved north for a long time, and its hard to understand the time staying this high.
However, the medium-term picture always remained objective near 92.00-94.00, based on false bull flag pattern and a lofty MACD and RSI. The daily RSI is turning below its average.
Strategy SELL between 120-140 for a move to 95.00 profit objective,

9/11/22 FSLRFirst Solar, Inc. ( NASDAQ:FSLR )
Sector: Electronic Technology (Semiconductors)
Current Price: $135.82
Breakout price trigger: $138.40
Buy Zone (Top/Bottom Range): $131.00-$122.00
Price Target: $144.00-$145.90
Estimated Duration to Target: 40-43d
Contract of Interest: $FSLR 10/21/22 150c
Trade price as of publish date: $4.60/contract

repeat of June 2007 run?last time FSLR made such a steep 100%+ run was back in May/June 2007. Here, I tried overlaying the price action then with this recent run, with an eye to possible near term resistance at $139
note then the protracted dwell of RSI above 70, followed by ABC 50% retracement before mooning.

FSLR-SELL++++The issue is, these type of shares seems to take more time, due to lower volume, I feel.
This type of share is no for the short-term, but for 2-3 months time frame corrections. The short-term it does not react, and that is an issue for some.
It does not change the overall view, as the higher it goes, the steeper the decline. For now, the estimated FIB correction should be minimum 98 but likely we may see 93.00.

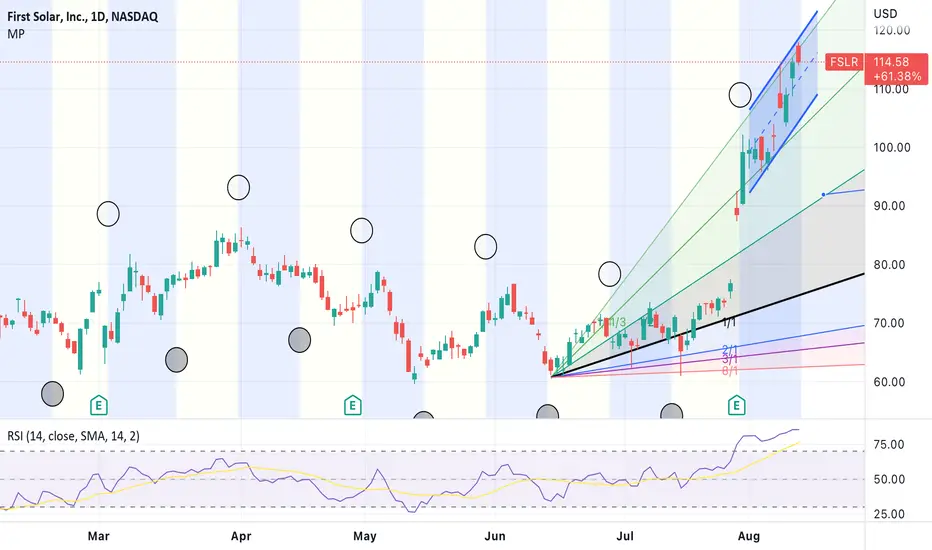
FSLR short trade setuplooking VERY extended here .... % distance above 50-day MA hasn't printed this high since May 2013. RSI also uncommonly high and loitering over 70 longer than normal.
decent short term setup for quick short play: to $116 ? After that, I could see it making a quick bounce back up to $129 that will shake out the shorts, then test $107 area? maybe more? unfilled gap at 77.5
raging bull case is also possible? ala 2007 scenario - rocket ship to the moon?

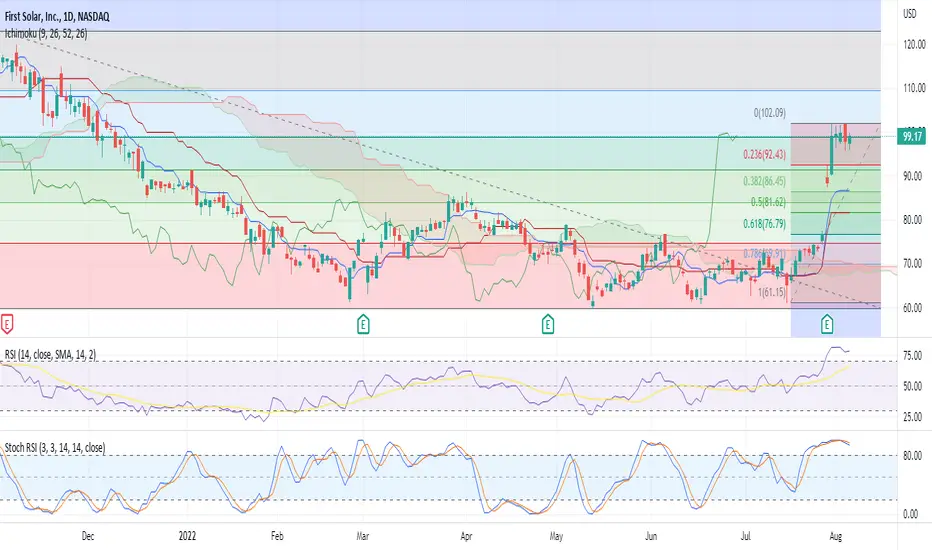
FSLR-SELL+++The share price is way overbought, and considering it has been hanging too long at these lofty levels, it feels little controlled.
The current market is very over extended and once should expect good correction back towards 91-93 mark, with interium support at 99.50 area.

FSLR-SELL+++No doubt volume is low and it appears some form of control on the price of the stock with upside bias.
Gravity rules always, and the false bull flag shape and the overextended nature of the price action, suggest medium-term below $ 90.00 again.
Strategy SELL current $ 126-129 and take short-term profit @ 107 and for medium-term strategy take profit below $ 93.00.

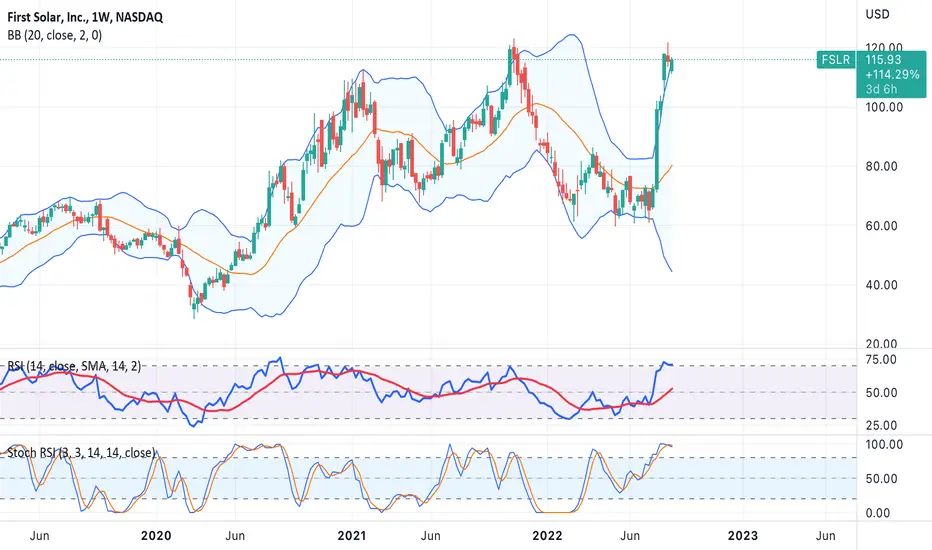
Weekly ChartFolks are bullish on solar so be safe.
Bearish Alternate Shark which appears to have ended at the 1.113.
The other Shark end at the .886.
Weekly candle is a shooting star at this moment but bye golly, it touched that 1.113.
Candles are known to form a bottom shadow and not just a long top wick and then stay like that forever(o: This candle is known as a shooting star if it is at a top.
A long top wick can indicate resistance.
No recommendation.
Overbought on RSI.
EPS (FWD)
-1.24
PE (TTM)
68.76
Div Rate (TTM)
0
Yield (TTM)
0
Short Interest
4.91%
Market Cap
$12.97B
Maybe one day we will all have solar panel homes and drive EVs. Probably not this year though.
It rains all the time here so I do not know how I will live in my solar powered home one day )o:

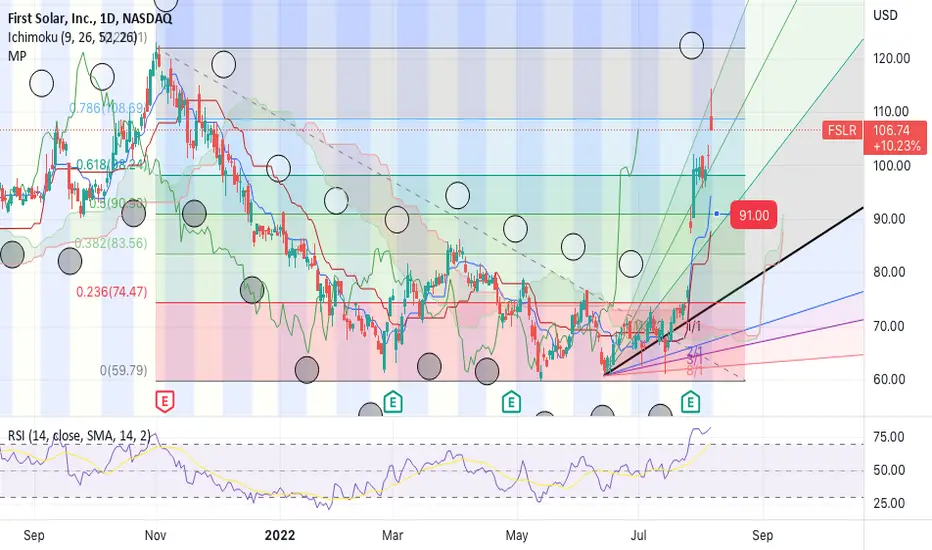
FSLR-SELL++We got a negative divergence very clearly seen. This is usually a sign for change of direction. The RSI still overbought, but as the usual being the case, lower RSIs with higher prices is a setup for a decline.
SELL @ 118-123 for a move to FIB 93.42.
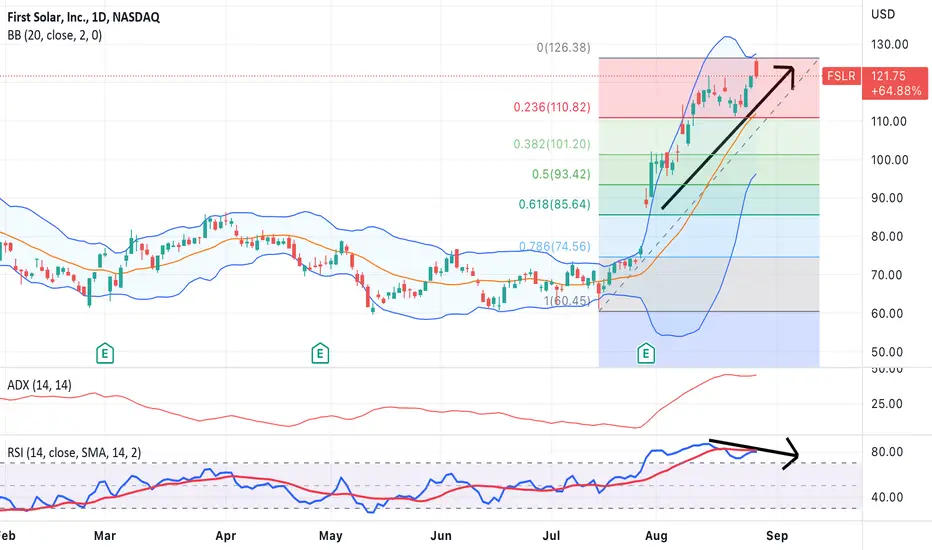
FSLR- SELL ++The stock is preparing for a larger fall. We got exetreme wide BB ansd RSI is high but reducing. The stochastic RSI is negative as well.
Combined feels we got a good case to move back towards 93-95.00
Sun going down on $FSLR🔸️Ticker Symbol: $FSLR timeframe: 1D 🔸️3X Bear Pattern 🔸️Investment Strategy: Short
TECHNICAL ANALYSIS: $FSLR has a great setup; we have a rejected double top, way overextended through our regression channel. Money momentum is flowing out of the market, and we have a key EMA crossover! I will be looking for ATM puts expiring in Sep/ Oct.
🔔 Follow for daily stock, crypto and forex technical analysis .
⚠️ Trading is risky, and I understand nothing is guaranteed. Proper risk management should be in place at all times to minimize losses. Please consult a financial advisor before trading. All Inclusive Trading LLC is not a financial advisor and may not be held liable for any losses which may occur.

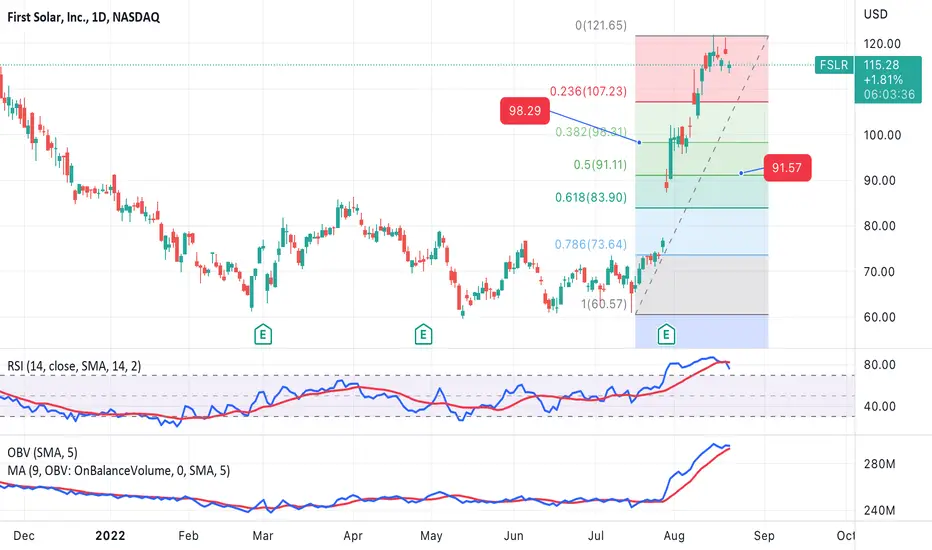
FSLR-SELL+++We are preparing for a large fall on this stock. We have a negative RSI (RSI below the RSI-MA) and we are extremely over bought
The strategy is SELL @ 115.00-119.00 and take profit on first objective 98.50 (FIB) and then re-sell once again higher levels. Ultimately we will see 91.20 > 83.75.
Short FSLR - Overdone rally from earning catalystOverall market rally seems way overdone and overhyped, although congress continue to press for stimulus bills on energy sector; still upside risk to reward does not warrant a long position at this point in time.
Rather, market's current rally are living on pro-longed extension from recovering CPI data to positive earning outlook to stock split. These catalyst seems to have very much been priced.

FSLR SELL++++++ WAY OVERBOUGHT/ OVERPRICED!SELL THE NEWS! FSLR should correct back to $91 range before going higher or lower.
FSLR-SELL++++the stock is very overbought, and the "false bull flag pattern" and wide BB suggest we should see good short-term correction.
Someone showed me that historically it may not correct as much as we would wish for, but since we got this flag pattern, likely we should be able to get close to $ 92.00 FIB retracement level.
Strategy is to SELL between $ 112-120 and take profit near $ 94.75 for now.

FSLR-SELL++++The false bull flag pattern has been building for a while, and yes, this stock seems to have its high ups and downs within a large range.
The current state short-term and even the medium-term case is building, for a decline short-term to $ 93-95, and little longer view, we should be seeing back towards $ 80-85.
The RSIs are extremnely high as a note and gives good reasons to support this view, with a wide BB width as well.

FSLR-SELL++++This stock is extremely overbought and it has a very clear FALSE BULL FLAG pattern. This heavily suggest a return back towards 92-94 area for correction.
Strategy is SELL current and anywhere between 110-117 and take profit @ 93.75 for now.
FSLR SELL+ ALL GAPS MUST FILLTrading 101 all exhaustion gaps eventually fill. What a business model to depend on government tax credits to increase your profits. 56 PE and no dividend, why would anyone buy this? False bull flag?
FSLR-SELL++++This stock is also very overdone, and formed a gap as well. Normally, we should cover that gap, and also we can see clearly a false bull flag pattern, plus high into the BB and the price movement has been too steep as well.
RSI very overbought too. Strategy is therefore simply SELL current range 110-116 when seen and take profit @ 92.75 for now.

FSLR SELL+Solar and EV stocks getting bid up once again due to the governments deficit spending "climate bill". FSLR is up a whopping 37% in a week. Overbought on most indicators on several time frame charts, of course like anything can always go higher.

FSLR-SELL+++Excellent opportunity to see lower correction levels. The share price spiked strongly, and the ending of day a hammer top formed. The RSI is high and suggest a short to be the way to go.
Strategy SELL current 106.50-108.00 and add on increases every USD 2.00 on price. Profit objective 93.50 for now