$JNJ Call verticalNYSE:JNJ has been declining for some time. Currently the bullish divergence is everywhere. The price is also outside the BB band. I think there is a very good change for the price to move up in the coming days.
I bought Jan. 2025 $150/$155 call vertical for $2.33
I will double my money if the stock price is above $155 by expiration.
0R34 trade ideas

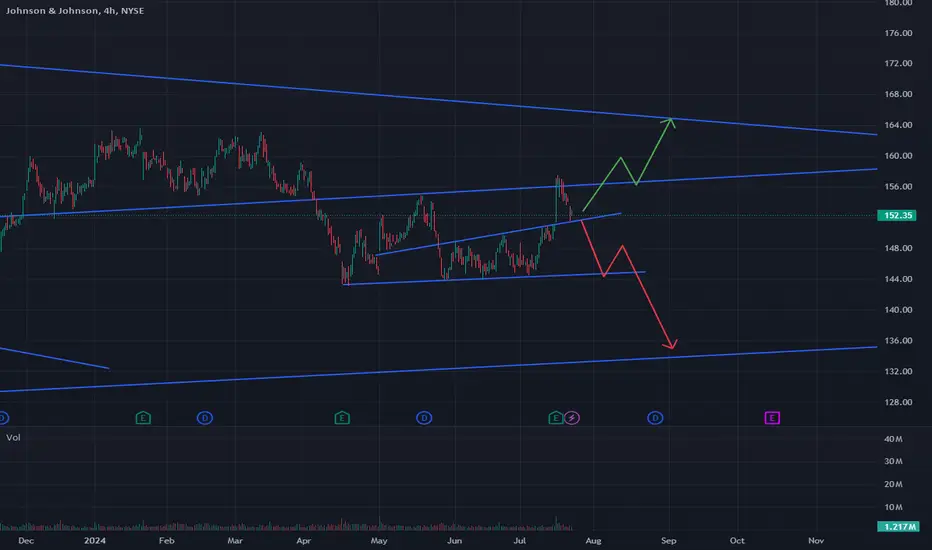
JNJ Long consolidation..potential breakoutNYSE:JNJ has been consolidating for over 2 years on this range now:
* monthly bull flag
* forming the right shoulder of an IHS on weekly chart (can even see it on the monthly)
* healthcare sector oversold, so can see a bounce
a bounce could push JNJ to test the upper trendline at 165-166.
The IHS neckline is at ~170 and the measured move puts it at around 185+
Play: 2026 leaps might be ideal here as they have low IV and can increase in value rapidly
I am looking at the 185C for Jan 2026
Resistance:
165 (volume node + 200WMA),
170 (volume node)
172, 175, 180
Support:
150
trade becomes invalid on weekly close below 150

$150 support for JNJ?$150 was a popular area from April to July. Once it finally broke through, it went to its high for the year of $168. Even after a good earning report, JNJ has been on the decline since. It hopefully found support at $150. It stayed in the support range for two days and immediately had the bullish engulfing candle, a nice sign.
In addition, this same period had RSI dip below 30. Only other time this happened this year was in April and that lasted for less than 10 days.
JNJ appears to be getting crushed with all the other Big Pharma. Overreaction in my opinion. JNJ moved -10% in 18 days. That's a big move for a company like that. This is not a meme stock. This is, dare I say it, a blue chip stock.
I am not an attorney, accountant or financial advisor, nor am I holding myself out to be, and the information contained in this post is not a substitute for financial advice from a professional who is aware of the facts and circumstances of your individual situation

JNJ-SELL strategy 9 hourly KagiThis share is negative at the moment, and it is possible to see a test of the BUY zone area $ 151.00 - $ 145.00.
Strategy SELL current $ 160-165 and take profit near $ 145.00


$JNJ with a bullish outlook following its earnings #StocksThe PEAD projected a bullish outlook for NYSE:JNJ after a negative over reaction following its earnings release placing the stock in drift C with an expected accuracy of 100%.

Bullish on JNJHello All!
JNJ looks like it could make a new high. The confluences I like are: JNJ made a high on the daily, retraced back to 159.00 creating a new Higher Low. Considering that price didn't break structure to the downside, and reversed in the 78.6% Fib indicates to me that price may be heading up. In addition, I liked that price hasn't closed below previous OB.
If price were to break below 158.000, then I would consider the sell. Therefore, as of price right now, it it retesting a previous BOS area. Looking for a potential reversal here.
Staying patient on this to see what we can get!
Potential Targets: 167.50 & 170.00
*DISCLAIMER: I am not a financial advisor. The ideas and trades I take on my page are for educational and entertainment purposes only. I'm just showing you guys how I trade. Remember, trading of any kind involves risk. Your investments are solely your responsibility and not mine.*

$JNJ Balls to the WallAs we can see, NYSE:JNJ has been following a regular down trend April 2022 and has no significant move to break upwards until recently.
On the monthly chart, we have a solid sideways consolidation after a strong movement up indicating the possibility monthly demand.
Considering the strong bull flag pattern in combination with a monthly CCI test and re-test breakout. this will punch JNJ stock to 180 and beyond nearing the 220 target for a measured C wave breakout.
Enjoy the ride, Options tend to pay good.

JOHNSON & JOHNSON Excellent confirmed sell signalJohnson & Johnson (JNJ) gave us the most optimal buy entry on our last call (April 17, see chart below) and easily hit our 157.50 Target:
Having been rejected early in September exactly at the top (Lower Highs trend-line) of the 2-year Channel Down and now establishing price action below its 1D MA50 (blue trend-line), this is a confirmed sell signal and the start of the Channel's 5th Bearish Leg. The RSI Lower Highs are common on all previous Channel tops.
Our Target is 141.00, which is on the Internal Lower Lows trend-line (formed by the last 2 Lower Lows) and still above the 1.236 Fibonacci extension.
-------------------------------------------------------------------------------
** Please LIKE 👍, FOLLOW ✅, SHARE 🙌 and COMMENT ✍ if you enjoy this idea! Also share your ideas and charts in the comments section below! This is best way to keep it relevant, support us, keep the content here free and allow the idea to reach as many people as possible. **
-------------------------------------------------------------------------------
💸💸💸💸💸💸
👇 👇 👇 👇 👇 👇

Bear for Johnson & Johnson confluence & fundamental
bear for the sell; technical analysis and fundamental is very important, when doing top down analysis and your confluences add up you pretty much knows what the chart going to do.

NEW RELEASE:The 3 Step Rocket Booster StrategyYes its been a while since you saw me talking about
my #1 favourite strategy of all time.
This strategy is very simple and easy to follow
-
And in this article am going to teach it to you.
Because it only has 3 steps, according to this
stock NYSE:JNJ
-
-The price has to be above the 50 EMA
-The price has to be above the 200 EMA
-The price has to gap up above the 50 EMA
-
Once you notice these 3 steps then you
are in a buying territory.
-
Do me a favour
rocket boost this content to learn more
-
Disclaimer: Trading is risky you will lose money whether you like it or not
please learn risk management and profit taking strategies.

JNJ-SELL strategy 3-Daily chart Heikin AshiI feel this share is coming under pressure, its overbought and turning negative.
Strategy SELL @ $ 163-165 and take profit near $ 150.00. SL based on personal risk parameters.

JNJ LongDemand Zone
Long 152.40
Stop 145
Target 162, 173
Risk management is much more important than a good entry point.
I am not a PRO trader.
In my trading plan, the Max Risk of each short term trade should be less than 1% of an account.

JNJ Short Swing OpportunityHere's my thoughts on a JNJ short opportunity that set up this week based on the following:
1) Parallel Channel Failed Breakout
2) Weekly Shooting Star Candlestick
3) Daily Evening Star Candlestick Pattern
4) Daily RSI Divergence
5) Completion of Wave 5 Elliott Pattern
Weekly Chart
On the weekly chart, there is a failed breakout of parallel channel with a shooting star formed at the end of the week inside the channel. Looking below at the daily chart, the top of the channel is now acting as resistance.
Daily Chart
On the daily chart, an evening star pattern was completed on Thursday, signaling a reversal in trend. There is also a divergence in RSI.
Elliott Wave
Still learning Elliott Wave but for the sake of sharing as I learn, it looks to be a completion of Wave 5 at the recent top. Will continue to watch to see the corrective wave pattern setup.
Additional Considerations
The the talc baby powder lawsuit will affect the stock price once the uncertainty is removed and the settlement is reached.
Earnings on 15 Oct.
Not financial advice.
Do your own research.

JNJ completing correction wave C
NYSE:JNJ
JNJ is in multi decade uptrend peaked at 187 – presumably end of major wave 5 and turned into Elliott ABC correction, where major wave (A) length is about 37. Per fibo relation major wave (C) should most probably end at 139.5, while intermediate wave ‘c’ – a unit of the major wave (C) might break the pattern bringing the end of correction to 133 and beyond until possible exhaustion of the major correction at higher fibo multiples.
At the same time the stock is trading in a downward channel with a lower bound standing now at 141, as well as built-in triangle pattern identifies target as of 137.5 (not very reliable)
Week chart: EMA 50 & 200 confirming death cross – it’s late coz in JNJ case SMA 50/200 confirmed it earlier at around 160 – i.e. the stock is already about to be bottomed. RSI in week chart is not yet oversold, while in day chart RSI is heavily oversold.
I would consider weekly and daily RSI to align getting both in oversold territory and open long at somewhere 139-141 with a price target being upper boundary of the current downward channel


Price on long time supportPrice reached 145$ an touched the long time support trend line
It can be a good entry point to get a new wave up

JNJ Swing Long Conservative Trend Trade 14Conservative Trend Trade 14
+ long impulse
+ support level
+ 1/2 correction
+ T2 level
+ biggest volume 2Sp
+ test
Calculated affordable stop loss
1 to 2 R/R take profit
Daily chart context
+ long impulse
+ 1/2 correction
Monthly chart context
- short impulse
+ biggest volume Sp
+ test
+ 1/2 correction

JNJ Short IdeaThe Dow looks pretty weak right now to me and as we've seen the mag 7 rally relentlessly. I've been avoiding shorts on tech and semis because they are driving the majority of this rally and shorts have not worked. The Dow has been fairly strong, it is near ATH with everything else.
However, there have been a lot of bearish stocks in the Dow such as NKE and DIS, which is where I have focused my shorts recently. I think it may be time for tech to weaken, but it looks like the Dow will as well. NKE and DIS are a bit too low for me to want to short, but I think there's still some good opportunities on stocks like JNJ.
This is a shorter term time frame, but if you zoom out you can see that the ascending trendline shown above, goes back to a major uptrend from 2016. It recently rejected off that trendline and the descending one above. I'd say it's quite bearish to see a break below and rejection of a 10 year trend. I expect downside to continue here for a good while, unless the Dow can hold up and remain strong.

Johnson & Johnson (JNJ) - Approaching the Reversal ZoneIn April, we anticipated a pullback for JNJ, and since then, the stock has dropped approximately 7%, aligning with our expectations. The current trend suggests further downward movement, reinforcing our previous analysis.
We are focusing on the support zone ranging from $134 to $116, with a potential lower bound at $109, the Corona-Low. The ongoing pullback could represent the completion of Wave (4) within this target zone, aligning with multiple levels.
We are going to be monitoring this for signs of a reversal within this zone. This zone will be crucial to confirm the next possible upward movement.

Return of Impulse wave?JNJ has saw strong bullish pressure at the bottom of the downside channel and it is likely to complete a larger degree (ABC) wave. As such, we are ver bullish on NYSE:JNJ
Stochastic OScillator has completed an oversold crossover and longer-term MACD is close to complete an oversold crossover.

