LSKBTC trade ideas
lsk /btc charn case the price broke the 156000 level and settled higher than it
We will see a strong rally in the price targeting 194000/243000
The price below 146750 is heading to lower levels
As a level 102220 and if this level is also broken we may see the price at the level of 38500 in the long term

LISK - Huge Potential, Trade Setup - A Core Portfolio Coin
LISK Symbol LSK is moving up!
As many of you who know me are aware, I’m an original ICO_ investor in LISK symbol LSK. LISK is an exciting project with a great team. LISK seeks to make developing blockchain applications and new coins more accessible to programmers by using JavaScript rather than a new language such as that used in Ethereum. With the LISK API and side-chains, developers can implement and customize their Blockchain applications entirely.
Lisk, headquartered in Zug, Switzerland, raised over 14,000 Bitcoins in funding during its stellar ICO_ (Initial Coin Offering), making it one of the most successful crowdfunding projects in history. Lisk was valued at over $4,000,000,000 at its peak.
I have been telling friends, and family to get into LSK since the ICO_ and telling them to hodl (hold) it long term. This one is a long-term winner.
Lisk was hit hard by the decline in the market of Bitcoin in January as were all altcoins. The current chart shows Lisk is coming out of that downturn and heading up. There seems to be little resistance along the way up for LISK prices once the resistance at 0.0015 is tested and cleared. Lisk has broken out of the decline triangle formed by the downtrend and closed a candle on the daily chart to the upside which is a very bullish signal.
If you are not in LISK you should be.
Buy In after a daily candle closes above 0.0015 BTC (or higher if holding long-term)
Trading Targets
Short-Term
0.00170
0.0022
Mid Term
0.0025
0.0031
Long Term
Hodl
Please, Don't forget to Like Agree, Comment and Follow Me, It's additional encouragement for me to share my work.
All statements and expressions I offer are my opinions, and not meant as investment advice or solicitation. Information provided is not personal investment advice. Seek guidance from a professional investment advisor before trading or investing. Trading cryptocurrencies can be a potentially profitable opportunity for investors. You should carefully consider your investment objectives, level of experience, and risk appetite. Most importantly, do not invest money you cannot afford to lose. I am not a registered investment advisor.
Wishing you success,
Isaac


lskbtc... my scenario hey guys if the gartley and the symmetrical triangle works fine be careful about bearish reversal.
then the price may retrace to AD fibo 0.38 or 0.618
but don't worry retracement is also a buy opportunity for this coin. to me future is bright
bye


LISK over the cloudTrend Line and Ichimoku can ward off lisk. If not, 2.5 risk/reward.
Buy at 32 / TP at 38.5 / SL 29.50

LISK: NEW DEVELOPMENTS - 23.43% PROFIT !!!Our "Crypto Bottom" Trade Indicator has correctly identified a buy in point on the 25th of April 2018.
Using this buy in point and selling at the sell signal, you would have expected to net 23.43% PROFIT!!!
The following are positive developments which have caused upward momentum on price :
April 11: Lisk Core 0.9.13.
April 11: Release of Lisk Hub 0.4.0. This includes a tutorial, second passphrase registration and more.
April 21: Release of Lisk 1.0.0-beta.6
April 22 : Lisk Ranked #2 in the Latest Code Audit from Darpal Rating
April 25: Lisk Hub 0.5.0 is released - introducing delegate registration within the Hub and much more.
April 28: Lisk Core 0.9.14 is released.
April 28: Lisk Explorer 1.6.0 is released.
Positive developments and increasing interest in QASH have led to a steady increase it's price over the past couple of days especially with the launch of the Worldbook beta.


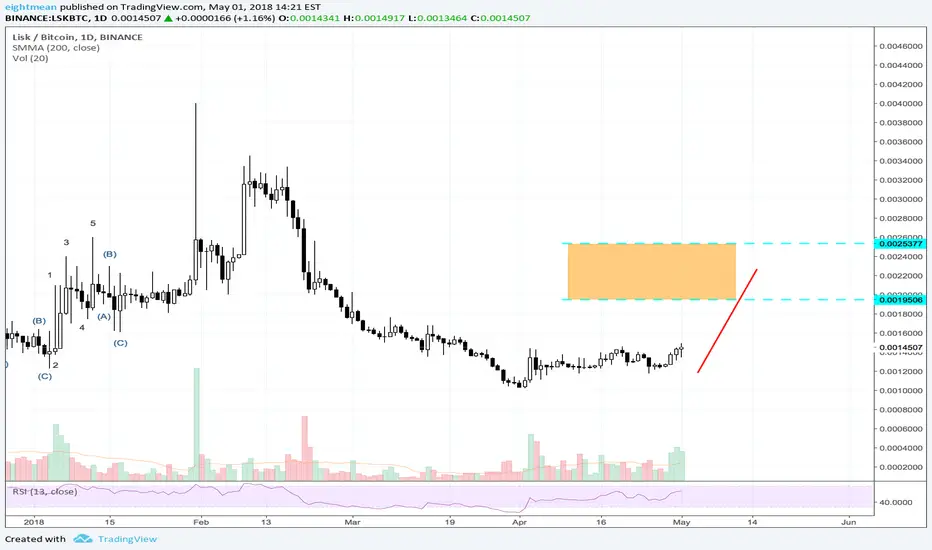
LSK Map - Supp/Res Zones along the wayMy personal map to LSK coming days -
Zones(Buy/Sell) - (Confluence of 1hr(pink)-4hr(orange)-Daily(blue) horizontal resistence/supports and Fib. levels)


Lisk (LSK/BTC) - Accumulating - 60%+ trade ideaSImple trade idea, details on chart. Not intended as trading advice. Use your own judgment when trading real money.
TP1: 16719
TP2: 19341
TP3: 24046
Thumbs up if you agree!
Use a stop loss, and don't forget to take profits. This is a short-mid term idea.

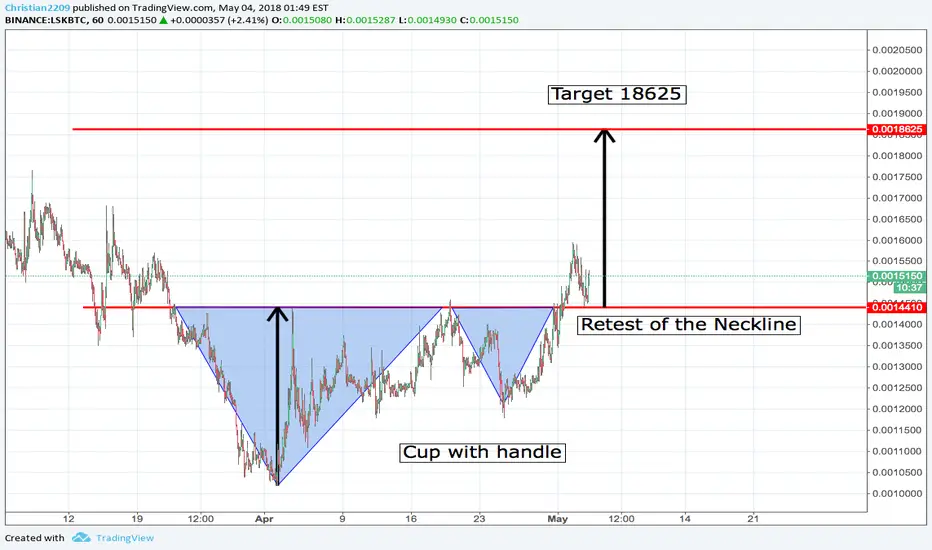
LSKBTC - Cup and Handle patternLSKBTC is forming a cup and handle pattern on the 4h chart, setting it up to break the main resistance at approx. 14000 sat.
After being rejected once, LSK gained back tempo by finding support on the 4hour 100 MA and might now be ready to break the main resistance at 14k sat. Another strong resistance is seen at 14400 sat (200day MA). If lisk manages to take out both, huge gains are possible.

LSK vs BTCBINANCE:LSKBTC
From current price this is a 260% potential gain.
Use your own stop loss
Trade under your risk
Enjoy.
Long term trade

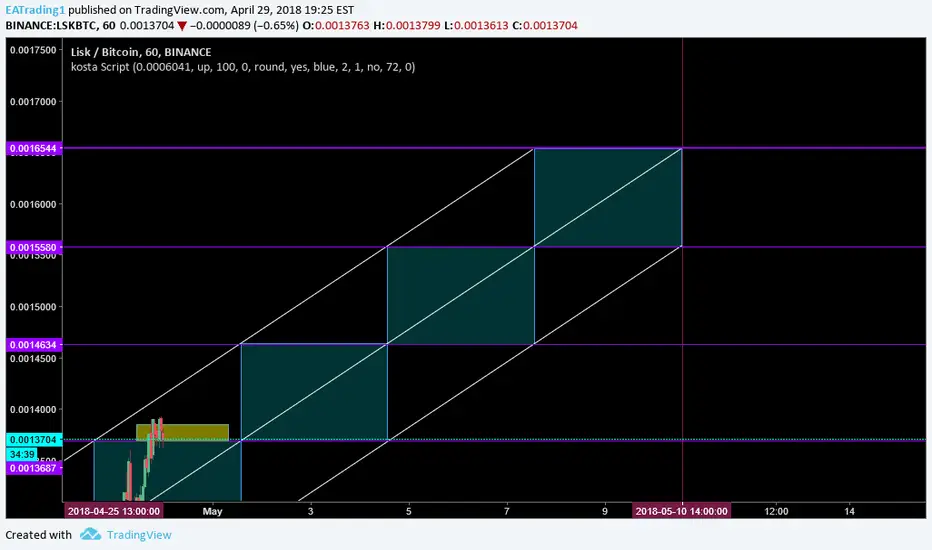
LSK/BTC New Targets.if it is still above0.0013687 it will go higher
target 1: 0.0013687
2: 0.0015580
3: 0.0016544