Not Exact But Man Does It Look Similar LTCUSDI had pointed this out in a previous chart but i thought I would zoom in and show how similar these look. I think its launch time, last time LTC was at this point it did a 10x in a month. Alt season starts when Litecoin says so. Not financial advice just my opinion. Thank you
LTCUSD trade ideas
LTC.USD next run to $350-$400 coming this year TOTAL3’s ultimate breakout is finally about to happen this year.
BTC.D is dropping from its triple Top region and the 200 SMA is finally beginning to downtrend.
The next mega crypto rally is here

Litecoin (LTC): On the Verge of a Massive Move?Litecoin (LTC) appears to be on the verge of a significant move, with price action suggesting it is at the apex of a long-term consolidation triangle. While a confirmed breakout has not yet occurred, the setup is highly compelling for a potential 5th wave impulse. Bulls are testing a key resistance level, and a decisive push higher could signal the end of this long corrective period. The invalidation point for this entire thesis remains at $74.78. A drop below this critical support would suggest the bullish setup is off the table.
Disclaimer: This is not financial advice. All trading involves risk. The content provided is for educational and informational purposes only. Always conduct your own research (DYOR) and consult with a qualified financial professional before making any investment decisions.

LTCUSD Breakdown Targets $105 Support ZoneLTCUSD has broken below a key support level and then retested it as resistance — a common bearish confirmation. With this rejection in place, price is now likely heading toward the next support area around $105. SL118
Traders should watch how price behaves in this zone, as it may act as a strong support and potential reversal point, or open the door for deeper downside if broken.

LTCElliott Wave count on Litecoin shows that the market is unfolding within a larger bullish structure. A clear five-wave impulse (1–5) is developing, with waves 1, 2, and 3 already labeled. Wave 3 peaked around the $132–$143 region, which aligns with common Fibonacci extension levels. Following this strong rally, the market has entered a corrective phase for wave 4. The red circle highlights the current price action, suggesting the start of a pullback. The expected retracement zone for wave 4 lies near $104–$107, which coincides with prior support and the 200 EMA. If price respects this zone and holds above it, a powerful fifth wave could emerge, driving Litecoin towards the $140–$150 region and potentially higher.
On the bearish side, if price breaks significantly below $103 and moves deeper, then the correction could extend further, possibly towards the $85–$90 area before resuming higher. The bull confirmation level is set at $140.92 — if broken, it would signal strong continuation to the upside. Overall, the structure remains bullish, with the current dip appearing as a corrective opportunity rather than a trend reversal.

LTCUSD H4 | Heading into pullback resistanceBased on the H4 chart analysis, we could see the price rise to the sell entry which is a pullback resistance that aligns with he 50% Fibonacci retracement and could reverse from this level to the downside.
Sell entry is at 114.96, which is a pullback resistance that lines up with the 50% Fibonacci retracement.
Stop loss is at 122.90, which is a swing high resistance.
Take profit is at 103.64, which is a swing low support that is slightly below the 50% Fibonacci retracement.
High Risk Investment Warning
Trading Forex/CFDs on margin carries a high level of risk and may not be suitable for all investors. Leverage can work against you.
Stratos Markets Limited (tradu.com ):
CFDs are complex instruments and come with a high risk of losing money rapidly due to leverage. 65% of retail investor accounts lose money when trading CFDs with this provider. You should consider whether you understand how CFDs work and whether you can afford to take the high risk of losing your money.
Stratos Europe Ltd (tradu.com ):
CFDs are complex instruments and come with a high risk of losing money rapidly due to leverage. 66% of retail investor accounts lose money when trading CFDs with this provider. You should consider whether you understand how CFDs work and whether you can afford to take the high risk of losing your money.
Stratos Global LLC (tradu.com ):
Losses can exceed deposits.
Please be advised that the information presented on TradingView is provided to Tradu (‘Company’, ‘we’) by a third-party provider (‘TFA Global Pte Ltd’). Please be reminded that you are solely responsible for the trading decisions on your account. There is a very high degree of risk involved in trading. Any information and/or content is intended entirely for research, educational and informational purposes only and does not constitute investment or consultation advice or investment strategy. The information is not tailored to the investment needs of any specific person and therefore does not involve a consideration of any of the investment objectives, financial situation or needs of any viewer that may receive it. Kindly also note that past performance is not a reliable indicator of future results. Actual results may differ materially from those anticipated in forward-looking or past performance statements. We assume no liability as to the accuracy or completeness of any of the information and/or content provided herein and the Company cannot be held responsible for any omission, mistake nor for any loss or damage including without limitation to any loss of profit which may arise from reliance on any information supplied by TFA Global Pte Ltd.
The speaker(s) is neither an employee, agent nor representative of Tradu and is therefore acting independently. The opinions given are their own, constitute general market commentary, and do not constitute the opinion or advice of Tradu or any form of personal or investment advice. Tradu neither endorses nor guarantees offerings of third-party speakers, nor is Tradu responsible for the content, veracity or opinions of third-party speakers, presenters or participants.

LTCUSD downside target 98.3On the weekly chart, LTCUSD formed a bearish bat pattern and then began to decline, with short-term bears taking advantage. The first downside target is currently around 112.0 (0.382 ratio of CD), and the second target is around 98.3 (0.618 ratio of CD).

LTCUSD potential head and shoulders patternOn the daily chart, LTCUSD has formed a potential head-and-shoulders pattern. Currently, focus on the support near the neckline at 108.0. A break below this level could signal further decline, with support near 92.3 as a target. In the short term, consider shorting opportunities at the descending trendline.


LITECOIN H4 | Bullish bounce off 78.6% Fibonacci supportLTC/USD is falling towards the buy entry, which is an overlap support that lines up with the 78.6% Fibonacci retracement and could bounce from this level to the take profit.
Buy entry is at 110.55, which is an overlap support that lines up with the 67.6% Fibonacci retracement.
Stop loss is at 103.64, which is a swing low support.
Take profit is at 119.19, which is an overlap resistance.
High Risk Investment Warning
Trading Forex/CFDs on margin carries a high level of risk and may not be suitable for all investors. Leverage can work against you.
Stratos Markets Limited (tradu.com ):
CFDs are complex instruments and come with a high risk of losing money rapidly due to leverage. 65% of retail investor accounts lose money when trading CFDs with this provider. You should consider whether you understand how CFDs work and whether you can afford to take the high risk of losing your money.
Stratos Europe Ltd (tradu.com ):
CFDs are complex instruments and come with a high risk of losing money rapidly due to leverage. 66% of retail investor accounts lose money when trading CFDs with this provider. You should consider whether you understand how CFDs work and whether you can afford to take the high risk of losing your money.
Stratos Global LLC (tradu.com ):
Losses can exceed deposits.
Please be advised that the information presented on TradingView is provided to Tradu (‘Company’, ‘we’) by a third-party provider (‘TFA Global Pte Ltd’). Please be reminded that you are solely responsible for the trading decisions on your account. There is a very high degree of risk involved in trading. Any information and/or content is intended entirely for research, educational and informational purposes only and does not constitute investment or consultation advice or investment strategy. The information is not tailored to the investment needs of any specific person and therefore does not involve a consideration of any of the investment objectives, financial situation or needs of any viewer that may receive it. Kindly also note that past performance is not a reliable indicator of future results. Actual results may differ materially from those anticipated in forward-looking or past performance statements. We assume no liability as to the accuracy or completeness of any of the information and/or content provided herein and the Company cannot be held responsible for any omission, mistake nor for any loss or damage including without limitation to any loss of profit which may arise from reliance on any information supplied by TFA Global Pte Ltd.
The speaker(s) is neither an employee, agent nor representative of Tradu and is therefore acting independently. The opinions given are their own, constitute general market commentary, and do not constitute the opinion or advice of Tradu or any form of personal or investment advice. Tradu neither endorses nor guarantees offerings of third-party speakers, nor is Tradu responsible for the content, veracity or opinions of third-party speakers, presenters or participants.

"Is LTC/USD the next target of a stealth bull raid?”🎯 LTC/USD HEIST ALERT: BULLISH LAYER HEIST PLAN! 💎🚁
PLUNDER PLAN: BULLISH
Thief entering the LTC/USD market with calculated stealth—multi-layered buy-limit entries, master-level layering strategy 🌪️💰
👾 ENTRY STRATEGY:
Stack multiple limit orders at staggered price levels (layering like a patient 🐍 thief)
Enter at any price, staying ready to pounce at key zones, using alerts for breakouts
🛑 STOP LOSS:
Fixed SL at 110.00 USD
Keep tight risk control—stop’s your escape hatch!
🏹 TARGET:
Primary profit target: 143.00 USD
Use trailing stop-loss to lock gains early if momentum fades
🧠 THIEF TRADER TACTICS:
Limit orders only—no chasing
Enter the trend, don’t fight it—avoid shorts during bullish bias
For scalpers: swift layered fills
For swing traders: build position patiently
💎 RISK MANAGEMENT:
Every limit order has a stop-loss
Total risk should be controlled—ideal risk‑reward if full strategy plays out
🔍 MARKET CONTEXT:
Bullish outlook supported by confluence of:
macro themes, sentiment swings, on‑chain flows, and intermarket setups
Layered entries optimize risk while capturing upside
⚠️ Avoid trading during high‑volatility news events
Trailing stops = lock profit & evade chaos
📣 CALL TO ACTION:
💥 If you feel the energy, smash that Like and Follow, comment your plan, and join the crew. Let’s rob the market level by level 🔓🎯
Stay sharp, stay sneaky — see you at the target 🔐
— Thief Trader 🐱👤💵🚀
Litecoin Entering Its Blast Off Point LTC/USDThis is what it looks like to me. It looks like we may be finding some support around here. If I am right and this fractal is repeating I think we see Litecoin actually go straight up to $250 before it comes back down to retest the now support previous resistance at around 135, quite quickly then reverse sharply to the upside. Im long here, lets hope Im right cause this would wash out alot of longs and shorts right before the real big move. None of this is financial advice just my opinion.

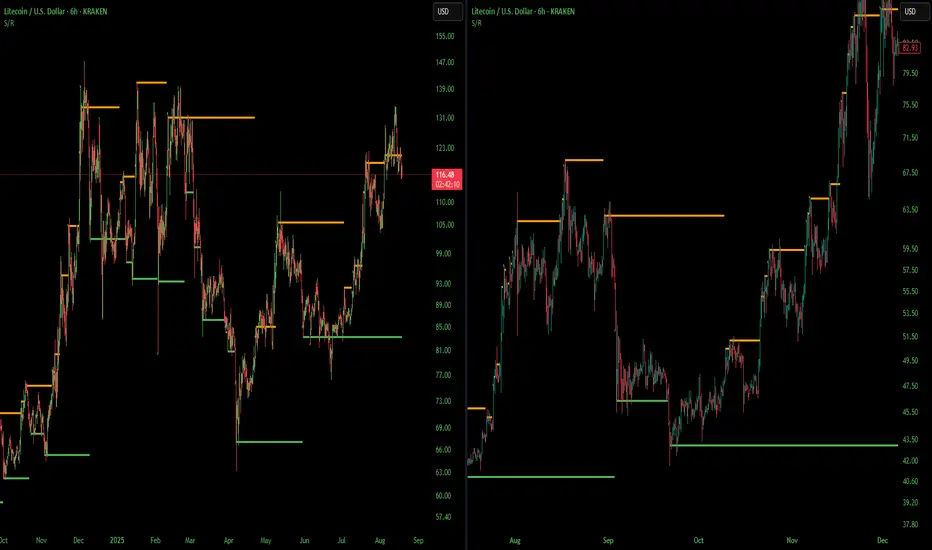
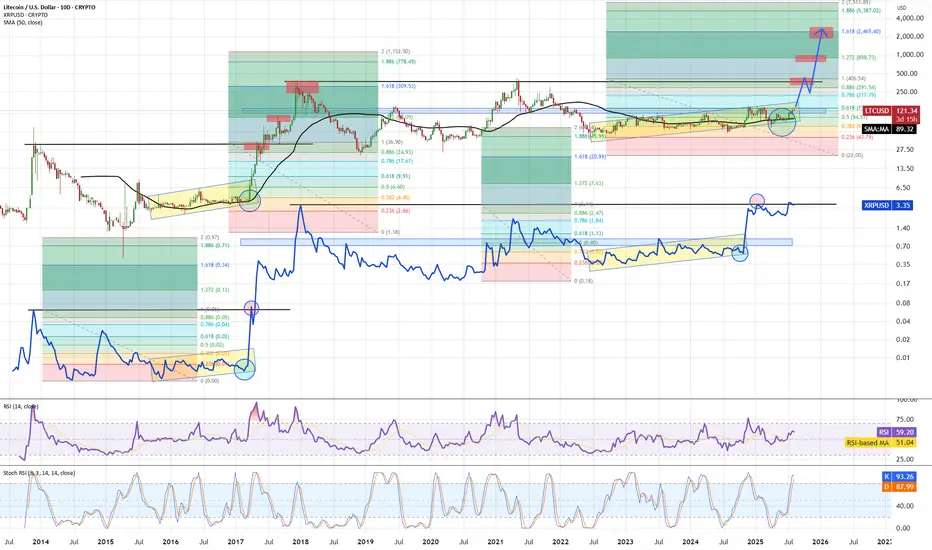
LTC - lagging behind XRP but doing same movesLTC is using same algo as XRP. Looking at historic data we see LTC in 2017 was laging behind XRP but then played catchup in last phase before reaching the top. SMA50 was good signal - once holding above it path for strong impulse was opened. Price now is again holding and bouncing up from SMA50 (same as XRP did early in 2025). Once we break above major S/R (blue box) expect move to speed up toward ATH where again some consolidation before final push for blowoff top. 1st TP is ATH pivot, 2nd TP is fibb 1.272 and 3rd TP is fibb 1.618 if we are to repeat move from 2017.
LTC long settupLTC is retracing to a rising support around 110. I will be entering long at 110 with a 1/5 RR settup targeting the top rising resitance line. The stop loss will be set at the 101.19.
RR:1/5
TP: 137.08
SL: 101.19
Potential Percentage Gain: %24.5
Potential Percentage Loss: %7.9
Not financial advice. Do your own DD. Thanks for viewing the idea.

Quick Short Term Idea On Litecoin LTC USDI though I would provide what Im looking at in the short term for Litecoin price action. Everything seems to be lining up for this type of move. Again a fractal, I love fractals.
Again this is short term but I see a sharp move up to $138 then a correction back down to support around $126
Not financial advice just my opinion. Thank you

Litecoin Eyes Reversal from $112.5 SupportFenzoFx—Litecoin currently trades near $115.5, having swept last week's low liquidity. This level is supported by a bullish fair value gap, with key support at $112.5, offering a potential reversal point.
Immediate resistance stands at $117.4. A close above this level could trigger a bullish wave toward the next supply zone at $123.3.

LITECOIN H4 | Bearish reversalBased on the H4 chart analysis, we could see the price rise to the sell entry which acts as a pullback resistance and could drop from this level to the downside.
Sell entry is at 126.19, which is a pullback resistance.
Stop loss is at 133.27, which is a swing high resistance.
Take profit is at 111.07, which is a pullback support that is slightly above the 78.6% Fibonacci retracement.
High Risk Investment Warning
Trading Forex/CFDs on margin carries a high level of risk and may not be suitable for all investors. Leverage can work against you.
Stratos Markets Limited (tradu.com ):
CFDs are complex instruments and come with a high risk of losing money rapidly due to leverage. 65% of retail investor accounts lose money when trading CFDs with this provider. You should consider whether you understand how CFDs work and whether you can afford to take the high risk of losing your money.
Stratos Europe Ltd (tradu.com ):
CFDs are complex instruments and come with a high risk of losing money rapidly due to leverage. 66% of retail investor accounts lose money when trading CFDs with this provider. You should consider whether you understand how CFDs work and whether you can afford to take the high risk of losing your money.
Stratos Global LLC (tradu.com ):
Losses can exceed deposits.
Please be advised that the information presented on TradingView is provided to Tradu (‘Company’, ‘we’) by a third-party provider (‘TFA Global Pte Ltd’). Please be reminded that you are solely responsible for the trading decisions on your account. There is a very high degree of risk involved in trading. Any information and/or content is intended entirely for research, educational and informational purposes only and does not constitute investment or consultation advice or investment strategy. The information is not tailored to the investment needs of any specific person and therefore does not involve a consideration of any of the investment objectives, financial situation or needs of any viewer that may receive it. Kindly also note that past performance is not a reliable indicator of future results. Actual results may differ materially from those anticipated in forward-looking or past performance statements. We assume no liability as to the accuracy or completeness of any of the information and/or content provided herein and the Company cannot be held responsible for any omission, mistake nor for any loss or damage including without limitation to any loss of profit which may arise from reliance on any information supplied by TFA Global Pte Ltd.
The speaker(s) is neither an employee, agent nor representative of Tradu and is therefore acting independently. The opinions given are their own, constitute general market commentary, and do not constitute the opinion or advice of Tradu or any form of personal or investment advice. Tradu neither endorses nor guarantees offerings of third-party speakers, nor is Tradu responsible for the content, veracity or opinions of third-party speakers, presenters or participants.

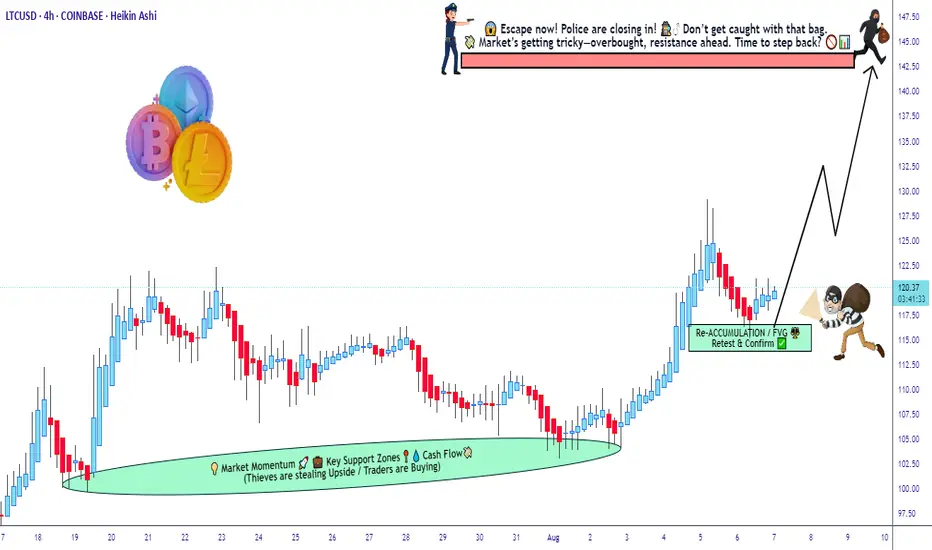
Heikin Ashi Trade Idea📈 Hey Traders!
Here’s a fresh outlook from my trading desk. If you’ve been following me for a while, you already know my approach:
🧩 I trade Supply & Demand zones using Heikin Ashi chart on the 4H timeframe.
🧠 I keep it mechanical and clean — no messy charts, no guessing games.
❌ No trendlines, no fixed sessions, no patterns, no indicator overload.
❌ No overanalyzing market structure or imbalances.
❌ No scalping, and no need to be glued to the screen.
✅ I trade exclusively with limit orders, so it’s more of a set-and-forget style.
✅ This means more freedom, less screen time, and a focus on quality setups.
✅ Just a simplified, structured plan and a calm mindset.
💬 Let’s Talk:
💡Do you trade supply & demand too ?
💡What’s your go-to timeframe ?
💡Ever tried Heikin Ashi ?
📩 Got questions about my strategy or setup? Drop them below — ask me anything, I’m here to share.
Let’s grow together and keep it simple. 👊

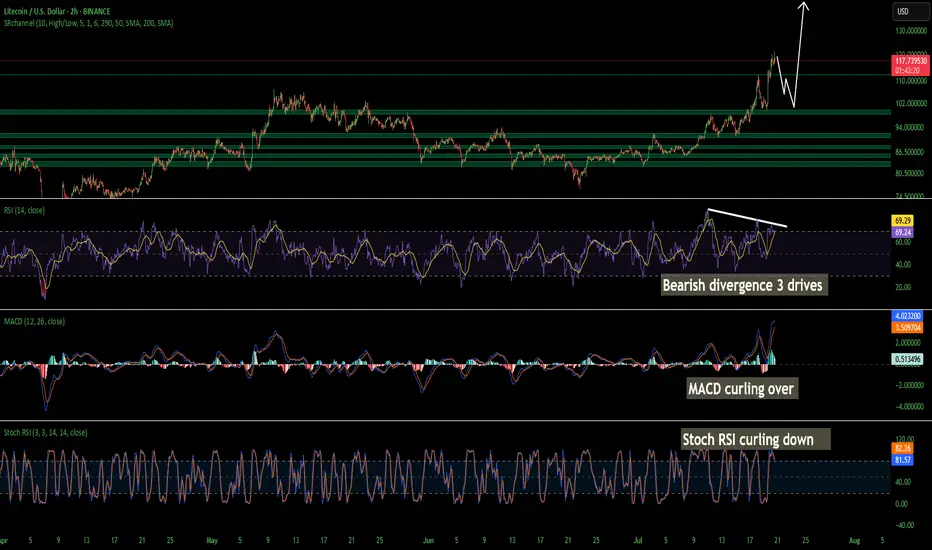
LTC Litecoin Short Term Pull Back Quick and SharpI believe Litecoin Is topping out on the 2 hour. Looks like we may come back down and tap support at around 104 but I wouldn't be surprised a wick hits 100. I have buy orders around 103-106. I am not super confident on a deeper pullback so thats why my buys are there is so i don't miss the dip. Id rather make a little less money than miss a buy in trying to nail the bottom. Litecoin is starting its breakout from a 7 year consolidation and accumulation phase. This should be pretty massive. Litecoin is going to benefit considerably from these new bills that are being signed and many of the favorites in the top 100 will soon disappear!
The time for Litecoin to shine as I have been talking about for years is now. I am almost certain that this is that time. My predictions all still hold if you would like to go read them. I was just off on timing. Timing is the hardest thing to predict especially with how wild this planet has been lately. None of this is financial advice its just my opinion.
Trading balanceTrading balance The price of the asset has rebounded from the balance zone. With the prospect of growth into the resistance zone.

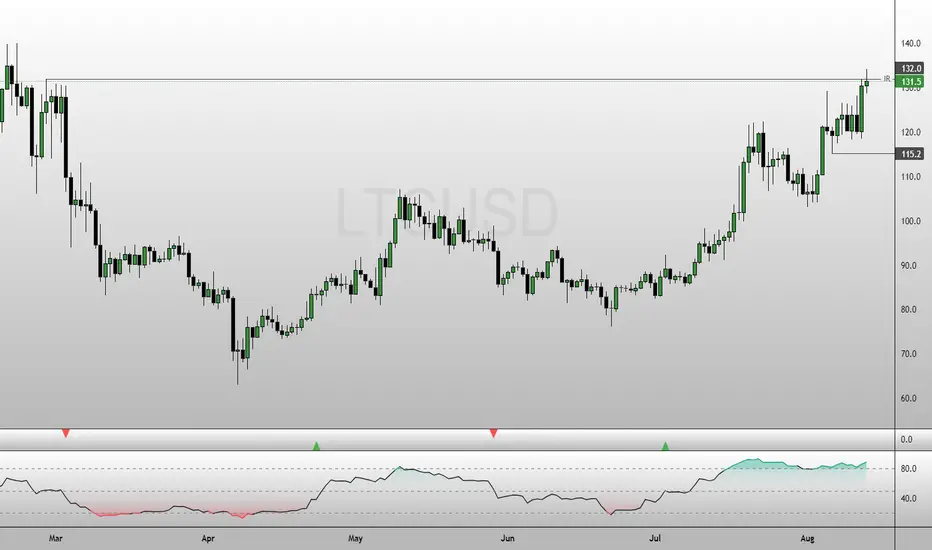
Litecoin Pulls Back After Sweeping February HighsFenzoFx—Litecoin swept liquidity above February’s highs. The market is currently overbought, suggesting potential consolidation. Entering at current levels may be risky, so waiting for a pullback toward lower support zones is advised.
If consolidation unfolds, LTC could target liquidity near the $115.2 support level.
Litecoin is approaching a critical breakout point.
LTC has been consolidating within this symmetrical triangle for an extended period, showing decreasing volatility and tighter price action. The structure suggests that a significant move is imminent.
🎯 Target 1: $400
🎯 Target 2: $1,000
If the breakout occurs in the coming weeks, we could see Litecoin reaching the $400 level within the next 2 to 3 months, with potential to hit $1,000 over the next 12 months — especially if bullish momentum picks up across the crypto market.
Watch closely — the move could be explosive.
Best of luck to everyone! 🚀

LTC working on the breakoutLTCUSD working on the breakout of our bullish pennant / triangle contracting!
Volume is increasing, that are good signs, volatility is not becoming crazy high, another good sign.
Timewise, compared to previous cycles, its moving a little bit late, but still looking good.
