Litecoin’s Bearish Signal: LTC dropped nearly 10%.Litecoin’s Bearish Signal: LTC dropped nearly 10%.
Litecoin formed a bearish harmonic pattern on the daily chart, completing near 129.20. This setup hints at a potential deeper correction or bearish wave—though that still needs confirmation.
Right after the pattern completed, price showed a stron

Litecoin (LTC): Aiming For $145 Area Before Potential CorrectionLitecoin looks good for potential upside movement here, although trades are not the best to take but we definitely see a good shorting opportunity appening soon.
More in-depth info is in the video—enjoy!
Swallow Academy

Litecoin Eyes $133 After Breaking $122 – 13% Upside AheadHello✌️
Let’s analyze Litecoin ’s price action both technically and fundamentally 📈.
🔍Fundamental analysis:
Litecoin’s ETF approval looks likely (90% odds!), and if it happens, we could see $400–500M inflows – just like Bitcoin’s ETF boost.
But yeah, SEC delays still shake the price… LTC droppe

Litecoin Hits a New High · Update · Highest Price in 5 MonthsToday Litecoin hit its highest price in more than five months, since March 2025. Soon Litecoin will break its December 2024 high and produce the highest prices since the last bull market, 2021. We are getting very close now.
A few weeks back the market was in a similar situation, doubt started to c
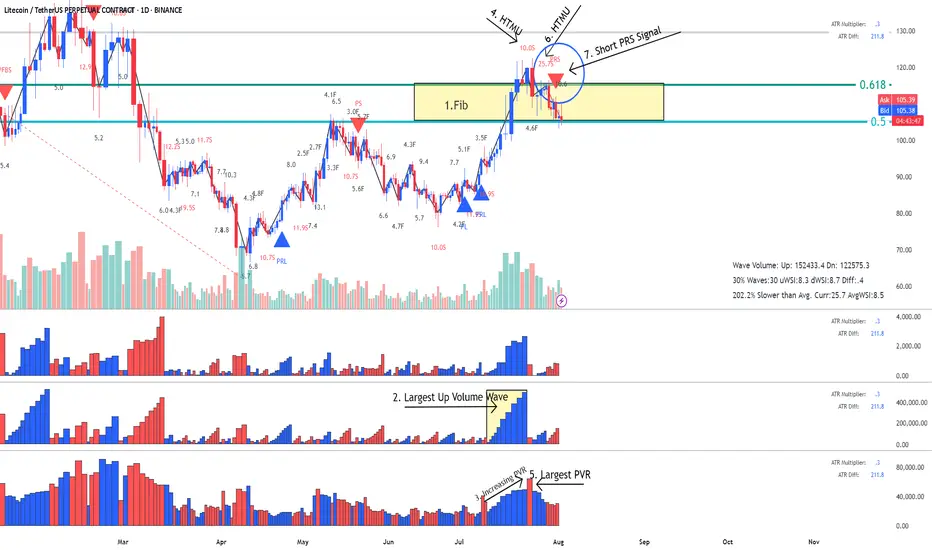
LTC- LitCoin - This is how a Fake Break on Fib looks like This is how a Fake Break on Fib looks like using Weis Wave with Speed Index
Reading the Daily Cha rt
1. Fib Location - Sellers could enter here
2. Largest Up volume wave after a while - also sellers could be hidden in there.
3. Increasing PVR (progressing volume rate) = as we approve the top mo
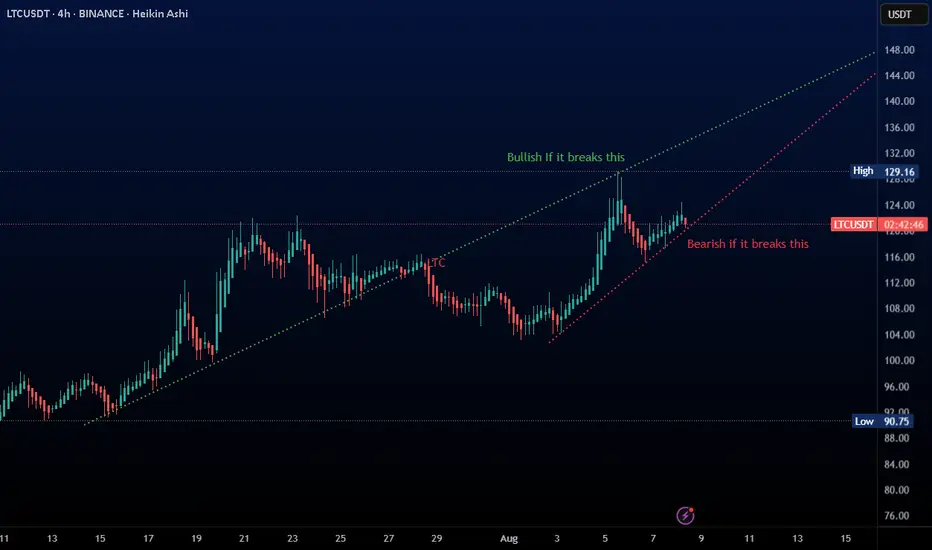
LTC Following Perfect Trend, May Breakout SOON !!! Keep an eye on these 2 trendlines for perfect setup
I have bought LTC as per below :
Bought Price : 120
TP : 130 +
Tight SL : 118 (To avoid risk)
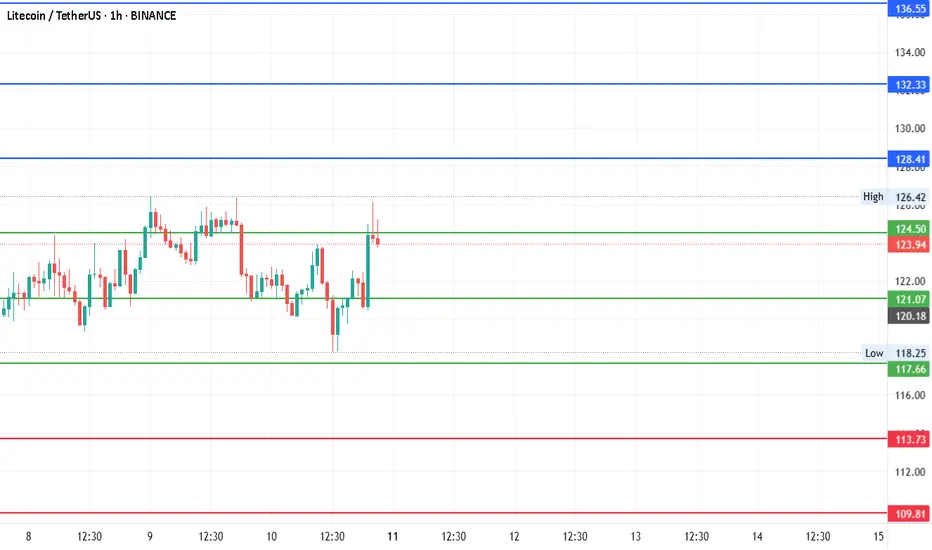
#LTCUSDT - Between 101 and 141 is the range for Aug 2025Date: 10-08-2025
LTCUSDT - Current Price: 124.8
Pivot Point:121 Support: 118 Resistance: 124
Upside Targets:
| 🎯 Target 1 | 128 |
| 🎯 Target 2 | 132 |
| 🎯 Target 3 | 137 |
| 🎯 Target 4 | 141 |
Downside Targets:
| 🎯 Target 1 | 114 |
| 🎯 Target 2
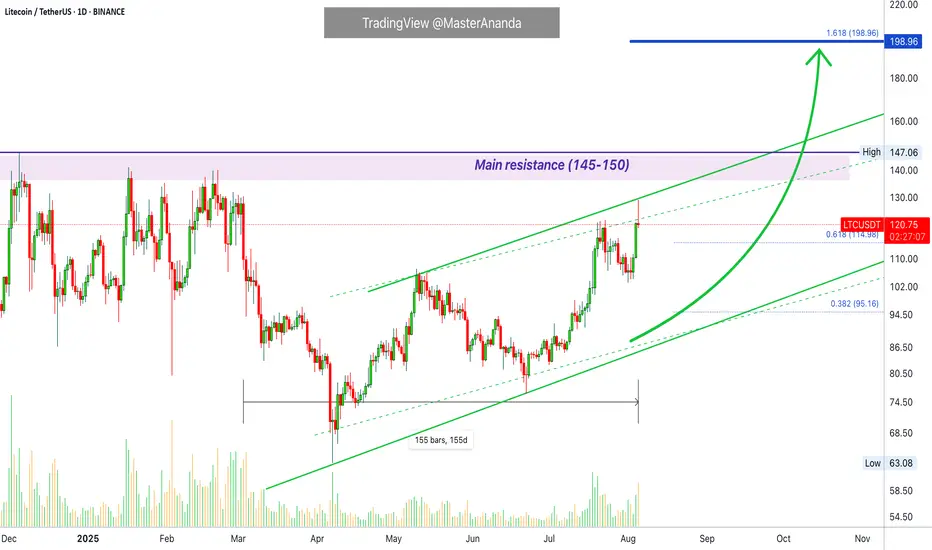
Litecoin Long-Term · Update · $642 & $1012We looked at Litecoin recently, it was on the daily timeframe. Immediate resistance sits at $150/$145. Think about this...
Looking at this chart, it is easy to see that Litecoin is trading at bottom prices. It is a bit high compared to all the peaks since 2022 but still low compared to 2021.
Now,

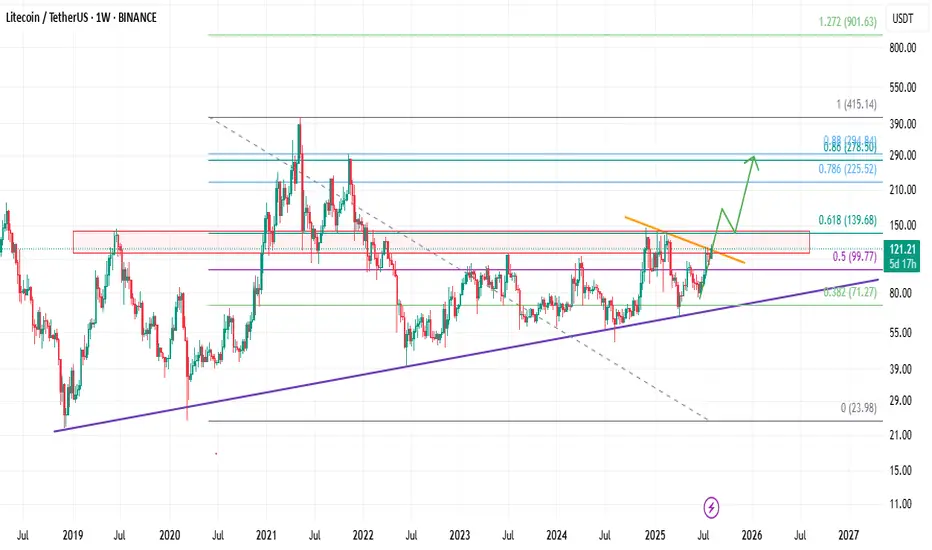
Litecoin Looks Ready – Breakout or Fakeout!Hello Traders 🐺
As you can see on the weekly chart, price is trying to break above the resistance line, which is in alignment with the red weekly resistance box and the 0.618 Fibonacci level.
Long story short:
If price manages to push above the 0.618 level — which is a very important resistance —
Litecoin: Major Expansion or Still Too Early?Price Action & Key Zones
Litecoin COINBASE:LTCUSD BINANCE:LTCUSDT continues to move within a multi-year consolidation range. The monthly chart clearly shows the range that has held since 2022. Key levels to watch:
Resistance at 145–150 USD — a key seller zone that has repeatedly acted

See all ideas
Summarizing what the indicators are suggesting.
Oscillators
Neutral
SellBuy
Strong sellStrong buy
Strong sellSellNeutralBuyStrong buy
Oscillators
Neutral
SellBuy
Strong sellStrong buy
Strong sellSellNeutralBuyStrong buy
Summary
Neutral
SellBuy
Strong sellStrong buy
Strong sellSellNeutralBuyStrong buy
Summary
Neutral
SellBuy
Strong sellStrong buy
Strong sellSellNeutralBuyStrong buy
Summary
Neutral
SellBuy
Strong sellStrong buy
Strong sellSellNeutralBuyStrong buy
Moving Averages
Neutral
SellBuy
Strong sellStrong buy
Strong sellSellNeutralBuyStrong buy
Moving Averages
Neutral
SellBuy
Strong sellStrong buy
Strong sellSellNeutralBuyStrong buy
Displays a symbol's price movements over previous years to identify recurring trends.