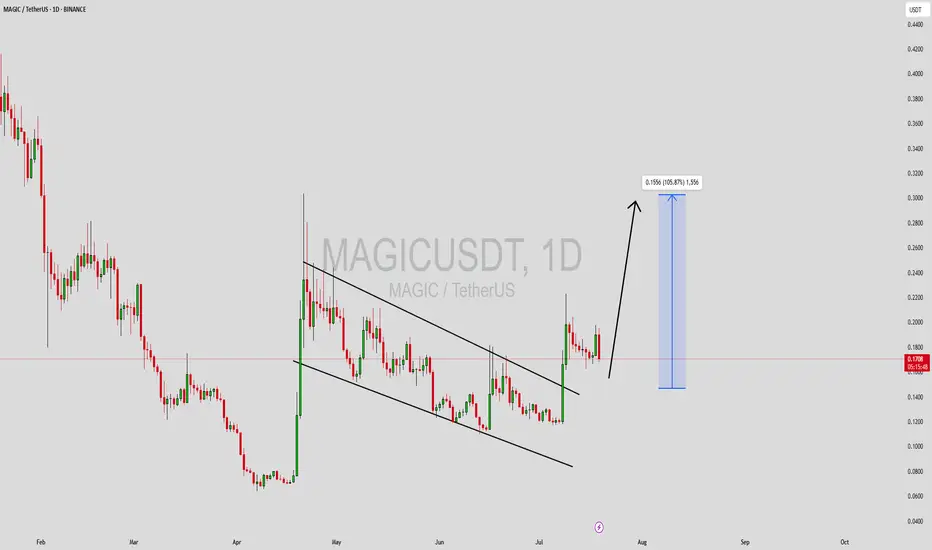
MAGIC Buy/Long Setup (1D)On the chart, an important trigger line has been broken. A strong bullish CH (Change of Character) is also visible on the chart.
The green zone is a low-risk area for a rebuy.
Targets are marked on the chart.
A daily candle close below the invalidation level will invalidate this analysis.
For ri

#MAGIC/USDT#MAGIC
The price is moving within a descending channel on the 1-hour frame, adhering well to it, and is on its way to breaking strongly upwards and retesting it.
We have support from the lower boundary of the descending channel, at 0.1560.
We have a downtrend on the RSI indicator that is about to

#MAGIC/USDT#MAGIC
The price is moving within a descending channel on the 1-hour frame, adhering well to it, and is on its way to breaking strongly upwards and retesting it.
We have support from the lower boundary of the descending channel, at 0.1474.
We have a downtrend on the RSI indicator that is about to

#MAGIC/USDT Falling Wedge + Fib Confluence #MAGIC
The price is moving within a descending channel on the 1-hour frame, adhering well to it, and is on its way to breaking strongly upwards and retesting it.
We have support from the lower boundary of the descending channel at 0.1620.
We have a downtrend on the RSI indicator that is about to

MAGICUSDT Forming Falling WedgeMAGICUSDT is currently showing a promising technical structure as it breaks out of a classic falling wedge pattern on the daily chart. This pattern is widely recognized for its bullish implications, especially when accompanied by increased volume, as seen in recent trading sessions. The falling wedg
$MAGIC breaking out! OMXTSE:MAGIC breaking out! 🚀
Price just moved out of the falling wedge.
If it comes back down, that could be a good buy zone.
Looks ready for a strong move up!
DYOR, NFA

#MAGIC/USDT#MAGIC
The price is moving within a descending channel on the 1-hour frame, adhering well to it, and is on its way to breaking it strongly upwards and retesting it.
We have a bounce from the lower boundary of the descending channel, this support at 0.
We have a downtrend on the RSI indicator that

Limit Long on MAGICLimit long placed on MAGIC after strong impulsive breakout and retrace into structural support, overlapping the golden pocket zone and anchored volume clusters. Price is compressing just below a minor supply shelf, and the setup targets a continuation move into recent highs. Risk is tightly defined

Scalp long MagicJust wanna scalp long here for w5 formation. taarget recent high or a conservative of 0.2117

MAGIC | Breakout AttemptMAGIC is attempting a breakout from its long-term descending channel pattern.
Analysis:
RSI shows momentum building from oversold levels
Multiple VWAP indicators suggest institutional accumulation
Risk Factors:
Breakout needs volume confirmation
Failure at resistance could lead to retest of $

See all ideas
Summarizing what the indicators are suggesting.
Oscillators
Neutral
SellBuy
Strong sellStrong buy
Strong sellSellNeutralBuyStrong buy
Oscillators
Neutral
SellBuy
Strong sellStrong buy
Strong sellSellNeutralBuyStrong buy
Summary
Neutral
SellBuy
Strong sellStrong buy
Strong sellSellNeutralBuyStrong buy
Summary
Neutral
SellBuy
Strong sellStrong buy
Strong sellSellNeutralBuyStrong buy
Summary
Neutral
SellBuy
Strong sellStrong buy
Strong sellSellNeutralBuyStrong buy
Moving Averages
Neutral
SellBuy
Strong sellStrong buy
Strong sellSellNeutralBuyStrong buy
Moving Averages
Neutral
SellBuy
Strong sellStrong buy
Strong sellSellNeutralBuyStrong buy
Displays a symbol's price movements over previous years to identify recurring trends.