MANABTC trade ideas


BUY MANABUY MANA FORMING falling wedge and its gonna break out soon
TP 400 420 440 460 500 550 SATS
SL bellow 320 sats


Decentraland/Bitcoin (Aug 23) #MANA $MANA #BTC $BTCMANA in further view is not good. If you bought MANA as my quick signal, you should sell it at 370sts zone because I don't see any good sign shows it can breakout. It can drop hard to 280sts zone. If MANA passes 375, we will have new analysis


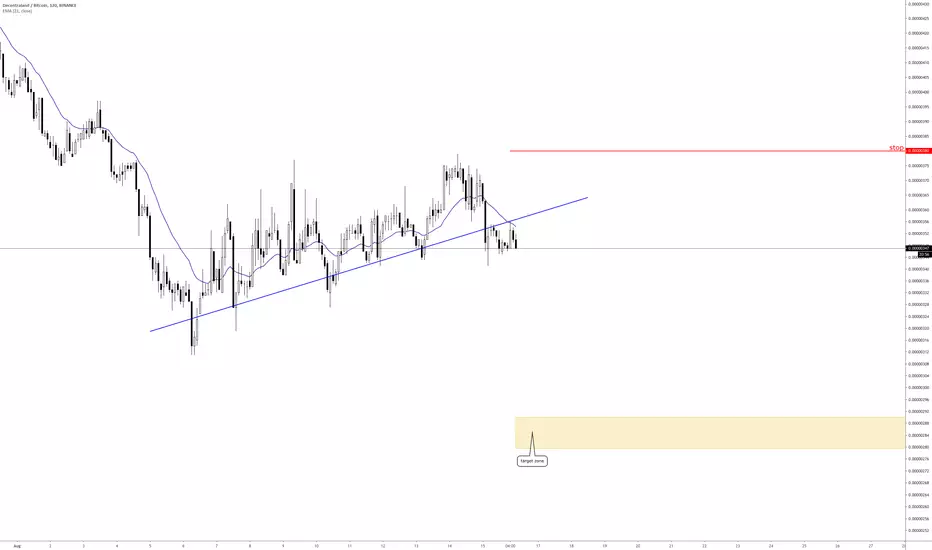
Decentraland (MANABTC) short.All description on the chart.
Please, don't forget to like and follow.
Thank you.
Decentraland/Bitcoin (July 29) #MANA $MANA #BTC $BTCMANA is not good now. I think it will drop to 360-365 zone. At this zone, we will take risk

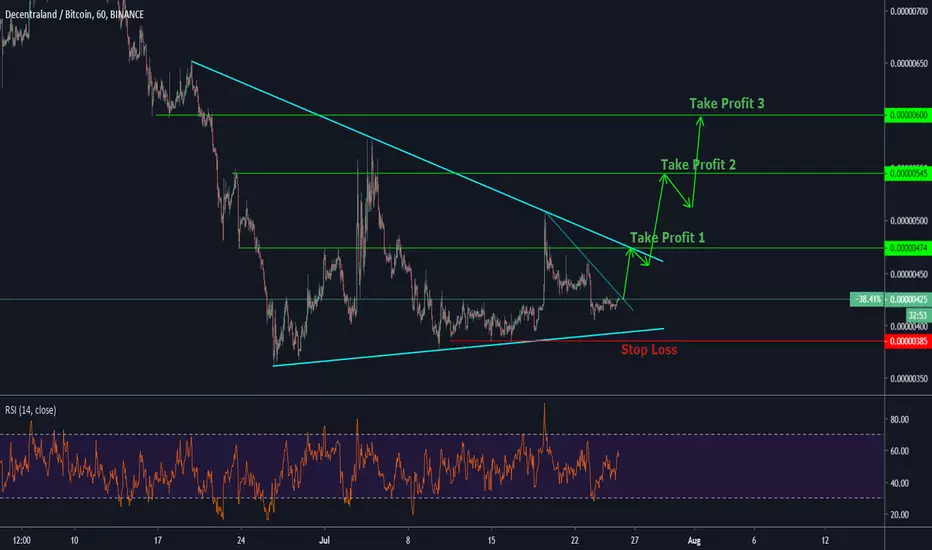

$MANA, Retested 370 sats level & is trying to bounce back up$MANA / $BTC Retested 370 sats level & is trying to bounce back up
If follows the same pattern that showed up some weeks ago,600sats is achievable
MACD is bullcrossing soon, while RSI is starting to rise
Volume looks low for now
A position w/ a tight SL could be a good option
#MANA


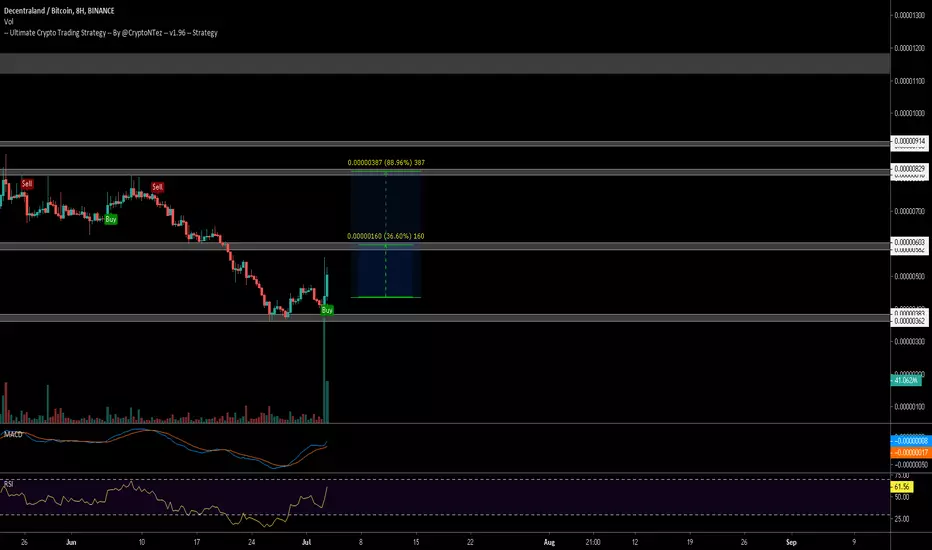
$MANA Pushing up from ATL BTC support...$MANA Pushing up from ATL BTC support...
Volume flowing in in big..
UCTS Buy signal on the 8H chart (not confirmed/closed yet)
1st target we should aim at 600sats and a 2nd target around 800sats
Big room for movements in this asset..
Remember to use SL to minimize risk!
#MANA
$MANA Some good looking candles!For the first time in quite some time,
Mana puts on some good looking candles, long ones in the form of a pennant, with a premature breakout.
If this upwards price action continues I highlighted above targets, Watch for rejection at the 1.272 fib level.

[MANABTC](220%) Decentraland Looking Bullish, Full TradeThe chart for Decentraland (MANABTC) is starting to look quite bullish with an attempt yesterday to break above EMA10...
We are starting to see the early signals of a market that wants to move up... We still have some time left to go, within 2 weeks we can start to some really positive growth.
Let's get started with this analysis... Feel free to hit like to show your support.
Decentralanda (MANABTC)
We have the now common bullish divergence on the MACD. Notice the indicator moving up (higher lows), while the candles are moving down (lower lows).
We can see the MACD histogram now going green. As well as increasing volume, with the biggest volume bar since March 2018. We are looking at the biggest volume in 3 months in a single candle.
The RSI hit its lowest point ever on the 25th of June. See the chart here:
Here is the trade...
-----------
Pair: Decentraland (MANABTC)
BUY: 0.00000420 - 0.00000460
NEXT SUPPORT: 0.00000330 - 0.00000360
TARGET:
(1) 0.00000550
(2) 0.00000670
(3) 0.00000760
(4) 0.00000870
(5) 0.00000980
PROFITS POTENTIAL: 220%
(Buy calculated at 0.00000444)
STOP: Close weekly below 0.0000300.
-----------
This is not financial advice.
Thanks a lot for reading.
------------
THE NEW JOURNEY STARTS
Engines ready, heart on top of my head.
The new journey starts, I am ready to launch ahead.
Clouds won’t stop me, I can enjoy even the rain.
Bring in the work…
I am ready…
My new journey starts today.
Namaste.

Decentraland/Bitcoin Buy idea H4RSI divergence showing a weakening bearish trend , price formed a bullish butterfly pattern , I am expecting it to go up in order to test at least the 0.000006 BTC level after it's breakout . For a buy at actual price and a sell at 0.000006 you get + 50% BTC


Decentraland/Bitcoin (June 20) #MANA $MANA #BTC $BTC#BUY #WAIT
Current Price : 632
Buyzone : Close to 600 as possible
Sellzone : 660-750-800
Holdzone : 1115-1240
Stoploss : Under 600
Buyback : 540-550

Up-tend has begun 30% short term D1We have broken that horrible down-move. we moved sideways past the trendline and are now moving up steadily.
I think we could expect to see upto 30% profits short term.


MANA LOOKING PROMISINGMANA LOOKING PROMISING: A BIG MOVE TO THE UPSIDE
NICE VOLUME ON BNB AND BIG ACCUMULATION
