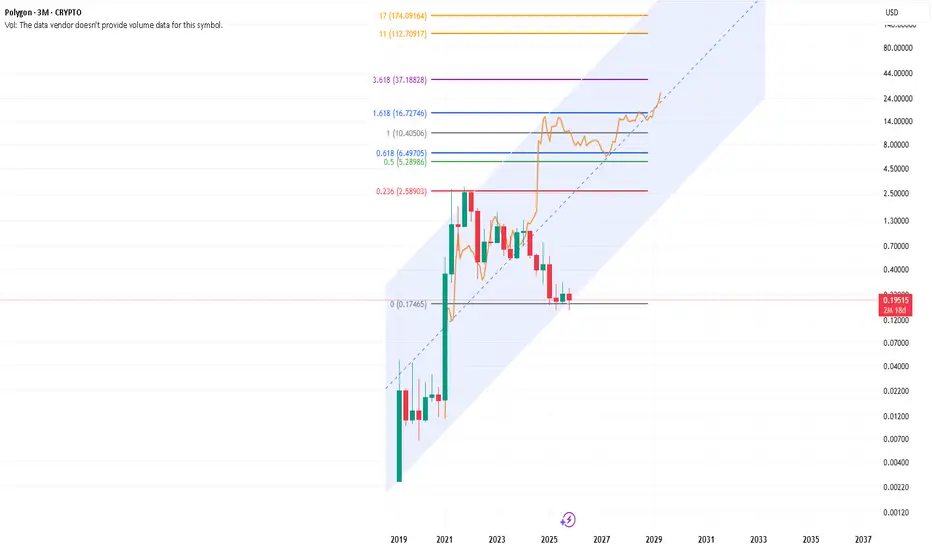
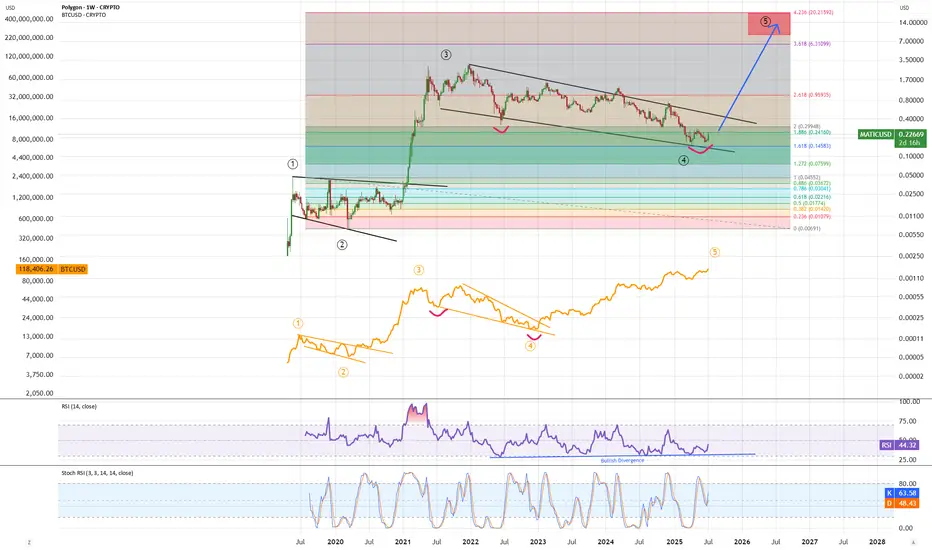
Polygon (MATIC) resembling BNB’s historical price patternThe chart compares Polygon (MATIC) with BNB’s historical price trajectory (in Orange). MATIC is currently around $0.19, near long-term support, resembling BNB’s 2019–2020 accumulation phase before its massive rally. If Polygon follows a similar path, driven by zkEVM adoption, ecosystem growth, and Layer-2 demand, it could enter a multi-year uptrend targeting the $5–$15 range. The setup suggests a high-risk, high-reward accumulation zone with strong long-term potential.
Fundamentals: Polygon currently holds $1.36B in DeFi TVL, ranking 8th overall, with 581K active addresses and $256M in 24h DEX volume. Despite its large user base, its TVL and fee generation ($17K daily) are relatively low compared to peers like Solana (Source: defillama). Polygon has strong institutional adoption used by Meta, Disney, and Mastercard, with Franklin Templeton and Hamilton Lane tokenizing assets on it. These partnerships position Polygon as a trusted, enterprise-grade Layer-2 despite its current low DeFi TVL. However, Polygon’s fundamentals remain solid — it has one of the broadest ecosystems (719 protocols), deep Ethereum integration, and a growing zkEVM and AggLayer infrastructure.
Polygon could outperform BNB in the long term due to stronger institutional adoption and deep Ethereum integration.
Trade ideas
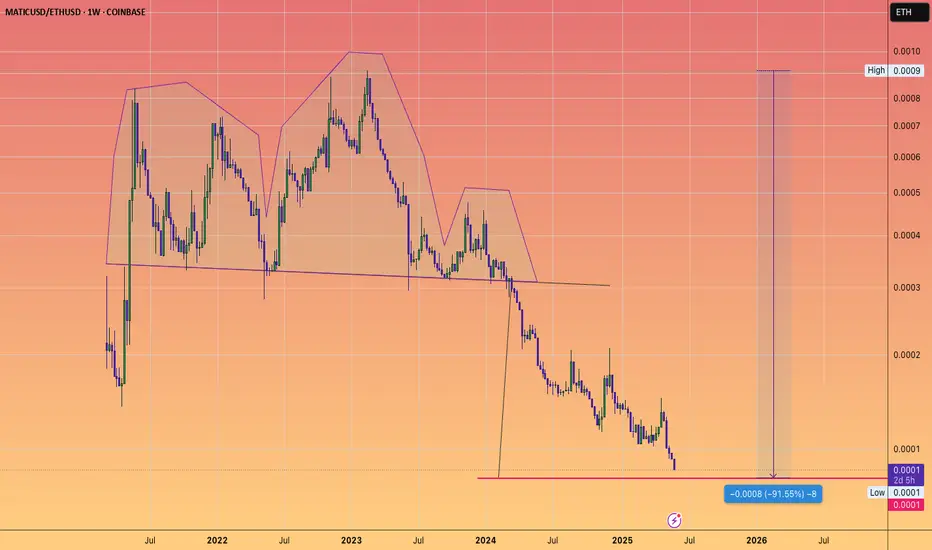
MATIC approaching Head and shoulders target...versus ETH
which would be a -91% loss of value versus the second most important crypto
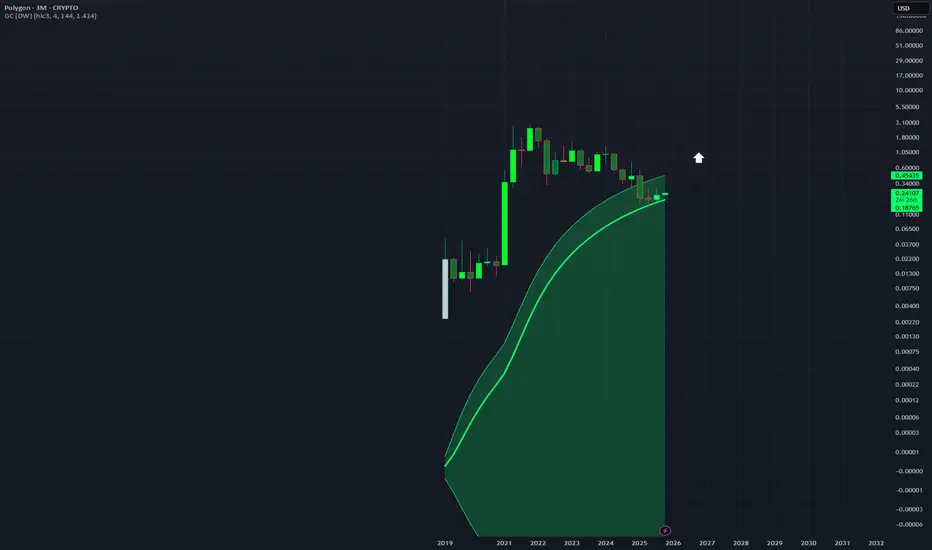
MATICUSD - Seems to Have Found Support 3Month Support seems to be showing at the middle of this Gaussian Channel on this 3 Monthly chart which is a very long timeframe but that emphasizes the support even more. It has stayed above this line since April.
Could be a big reversal coming soon.
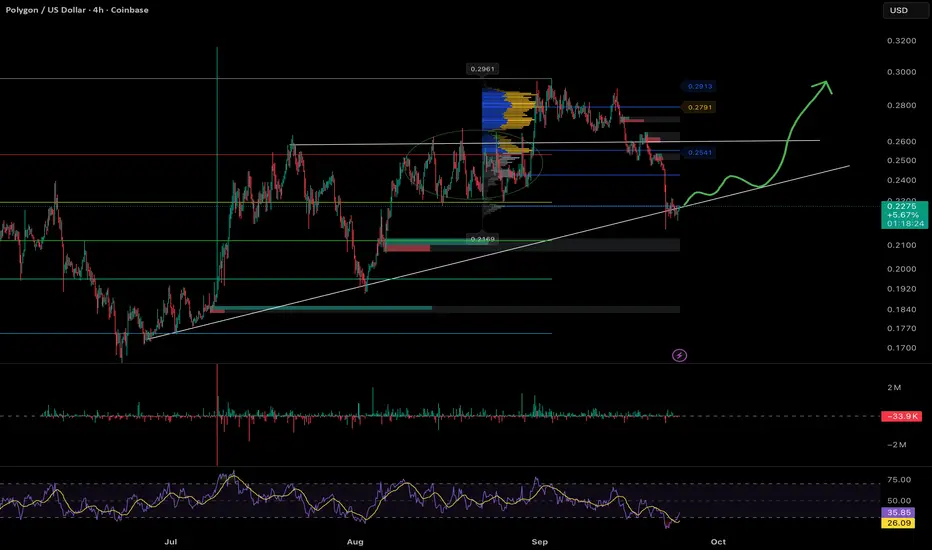
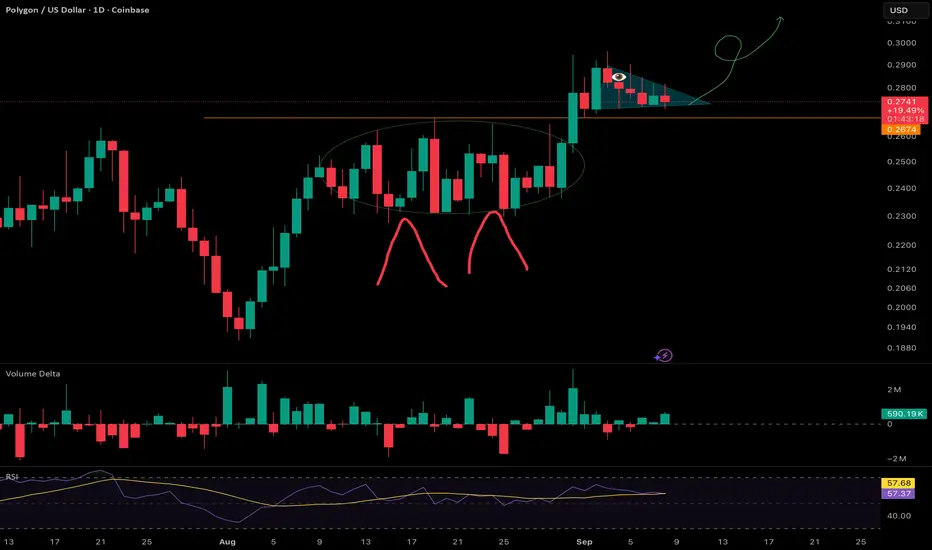
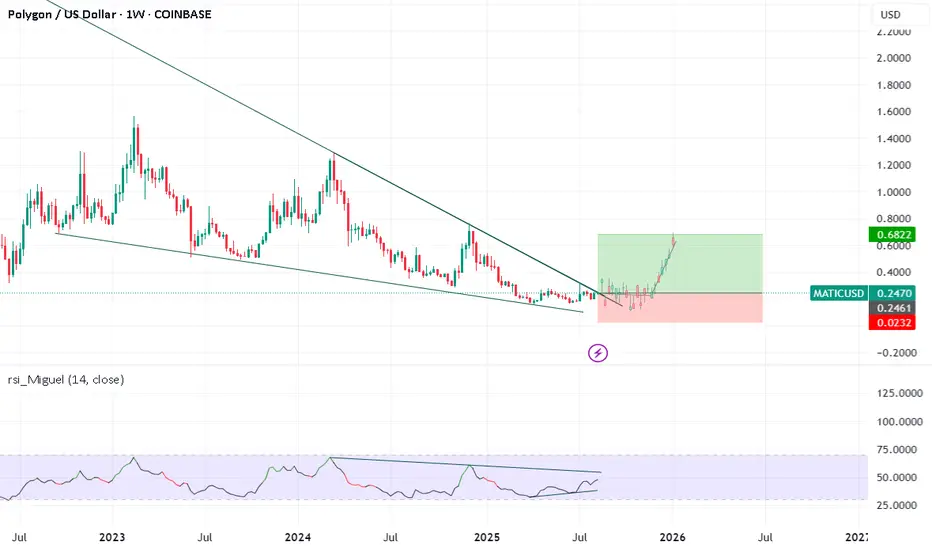
POLUSD Polygon (ex-Matic) Second attempt here following the trendline for now,
SL at 0.1990 if it wicks. And will close below the trendline if theres a clear daily breakdown
TPs : Same as the first try
0.75
1.5
3
6.5
18
cheers
POLYGON/ex MATIC - Horse pattern, very bullish ?¿*2nd attempt, making it more thrustworthy*
beautiful animal, much power, once the head of the horse is completly finished, we run the green valleys with very yummy grass
orange line is SL, need to close below on daily
target is 0.75
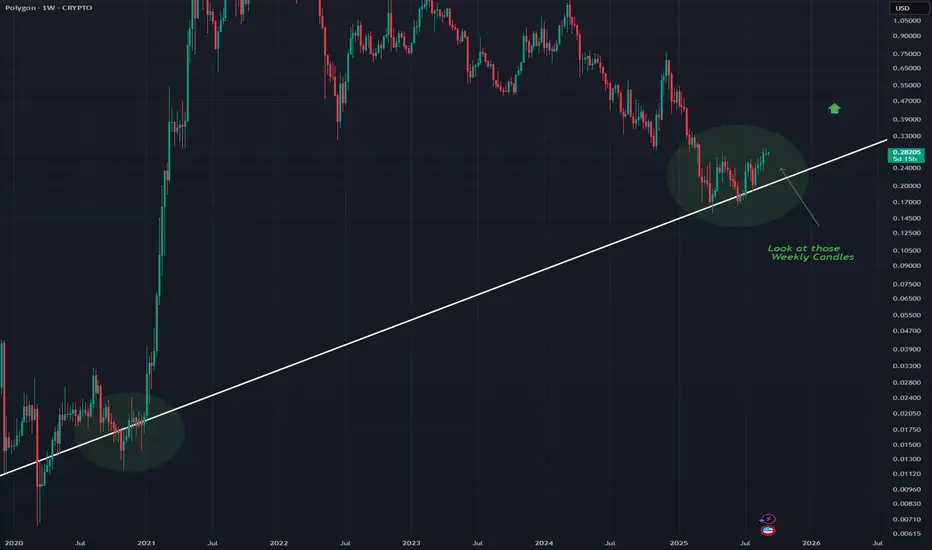
MATICUSD - Preparing For a Massive BreakoutThe recent Weekly candles on Matic are looking very very juicy and I expect a breakout.
Maybe not as hard as the first rally along this slightly iffy trend line but it looks good regardless.
Very bullish on MATIC.
Again, Weekly chart.
**Polygon (MATICUSD) Technical Analysis** MATIC is currently te**Polygon (MATICUSD) Technical Analysis**
MATIC is currently testing a critical support cluster between **$0.52-$0.54**, a zone that has provided both psychological and technical support throughout 2024. The price remains constrained under key moving averages, with the 50-day MA at **$0.58** and 200-day MA at **$0.64** creating dynamic resistance layers. Trading volume has shown characteristic weakness during declines, suggesting lack of aggressive selling but equally absent buying enthusiasm.
The daily RSI oscillates near **39**, approaching oversold territory yet lacking definitive reversal signals. The MACD continues to trade below its signal line, though the histogram displays early signs of convergence, indicating potential slowing of downward momentum. Immediate resistance awaits at **$0.58** (50-day MA), with more significant resistance at the **$0.62** Fibonacci retracement level.
Fundamentally, Polygon continues to demonstrate robust ecosystem growth with increasing institutional adoption in tokenized assets and sustained developer activity. The network's recent technological upgrades and strategic partnerships provide underlying strength, though these positive developments remain overshadowed by broader market sentiment. A decisive break below **$0.52** could trigger accelerated selling toward the **$0.48** support level. Conversely, a reclaim of **$0.58** with expanding volume could signal near-term bottom formation and potential retest of higher resistance zones. Traders should monitor Ethereum's performance for directional cues, given MATIC's high correlation with ETH movements. The upcoming weeks remain crucial for determining whether current levels represent accumulation or distribution territory.
Matic Polygon +170% SoonWhy might MATIC (Polygon) "explode" in price on certain days?
While it’s impossible to predict exact “explosive” dates, here are key catalysts and technical factors that historically drive MATIC price spikes—and may do so again:
1. Major Upgrades & Network Upgrades
The Heimdall v2 upgrade—launched July 10, 2025—marked a transformative step, slashing finality to ~4–6 seconds and speeding up block production to ~2-second intervals.
Ongoing developments as part of Polygon 2.0, AggLayer, and zkEVM integration continue to boost ecosystem potential
These upgrades often spark increased attention and price appreciation, particularly around launch or adoption milestones.
2. Technical Reversals & Chart Signals
Analyst “MasterAnanda” highlighted a bullish divergence on the 3-day RSI: Polygon’s price hit a low in April 2025, while the RSI bottomed months earlier in July 2024—suggesting a trend reversal and potential rally toward $1
If key resistance levels are breached with volume—especially following such RSI signs—traders may see "explosive" moves.
3. On-Chain Activity & Growing Adoption
The Agglayer Breakout program that airdrops tokens to POL stakers aims to enhance user participation and ecosystem engagement
Partnerships with gaming and Web3 platforms, plus zk-tech integration and account abstraction standards, help build a foundation for longer-term growth
Increased developer activity, staking incentives, and ecosystem usage can create demand surges.
4. Broader Market Trends & Macroeconomic Catalysts
As a Layer-2 Ethereum scaling solution, MATIC often moves in sync with broader crypto trends—such as bullish sentiment in Bitcoin or Ethereum
Regulatory clarity, ETFs, or institutional inflows boosting Ethereum could spill over into MATIC.
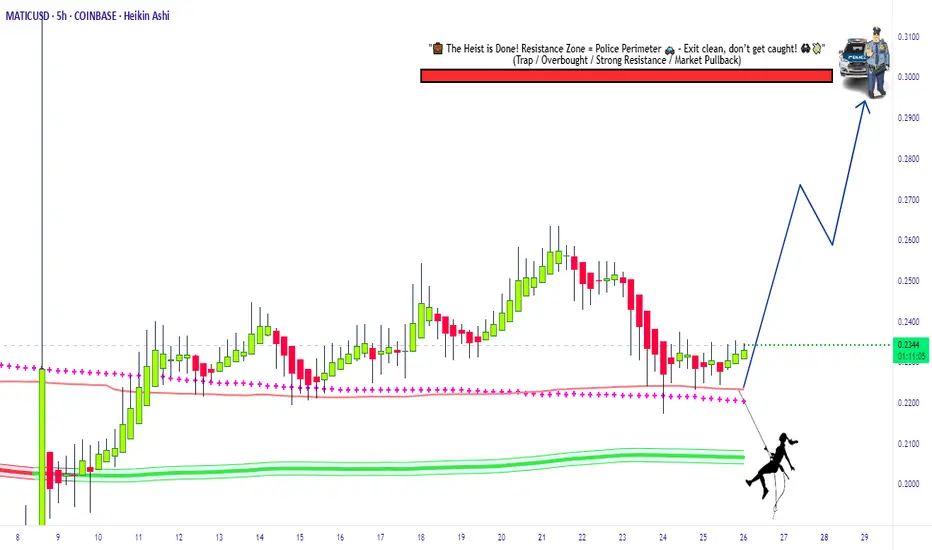
Swipe the Polygon Vault MATIC/USDT Bullish Heist Strategy🔥 MATIC/USDT Heist Plan: Swipe the Loot Before the Cops Clock In! 🏴☠️💸
🌍 Oi! Hola! Bonjour! Hallo! Marhaba!
💼 Welcome back, Money Makers & Market Bandits!
The Polygon (MATIC) vs Tether vault is wide open! Based on our 🔍 Thief Trading Style Analysis, it's time to plan the ultimate crypto chart robbery with a long-side assault on this bullish breakout. 📈💥
💣 Robbery Blueprint – The MATIC/USDT Master Plan
🚪 ENTRY STRATEGY: Get In, Get Rich, Get Out!
⚡ Vault Breach: Enter LONG at market price if you're bold & fast.
🎯 Smart Entry: Wait for price pullbacks on 15m/30m swing lows/highs.
💎 Use layered DCA-style orders for clean risk-controlled entries.
Thieves don’t rush—they snipe the perfect price levels.
🛑 ESCAPE PLAN: Stop Loss Strategy
📍 SL placed at: 0.2000 (based on 4H candle wick zone).
💡 Adjust SL to your loot capacity (risk, lot size, number of orders).
⚠️ If price dips near SL, that’s the cops knocking—bail fast or go down swingin’.
🎯 TARGETS: Stack Your Bags Before the Alarm Rings
🚀 Primary Target: 0.3000
🧲 Scalpers: Grab & Go! Stick to long bias only. Use trailing SL to protect the gains.
🎩 Swing Robbers: Hold strong. Watch for resistance traps & trailing stops near key zones.
📊 Market Intel: Why This Heist Has High Odds 🎯
🔋 Bullish pressure building with growing momentum.
📡 Supporting Data:
🔍 On-chain metrics signaling accumulation
💼 Macro sentiment favoring risk assets
🧠 COT reports + intermarket analysis leaning bullish
Just don’t get comfy—this is a heist, not a honeymoon!
🚨 Trade Warning – Don’t Get Caught!
📢 Major News Releases = High Volatility.
🚫 Avoid fresh trades during key announcements.
🔒 Use trailing SL to lock in profits & escape clean.
💥 Like, Follow & Power Up the Robbery Squad 💥
💬 Support the crew. Hit BOOST to keep these trade ideas flying.
Your thumbs-up fuels the next chart breach. 💪
📡 Stay locked in—more heist setups coming soon!
🎯 Trade Sharp. Swipe Smart. Escape Fast. 🏴☠️
Thief Trader Out. 🐱👤💰
the price is in the uptrendGiven the positive price conditions, the price is in the uptrend, and then the gaza should wait for the long -term trend line to achieve at least its previous roof.
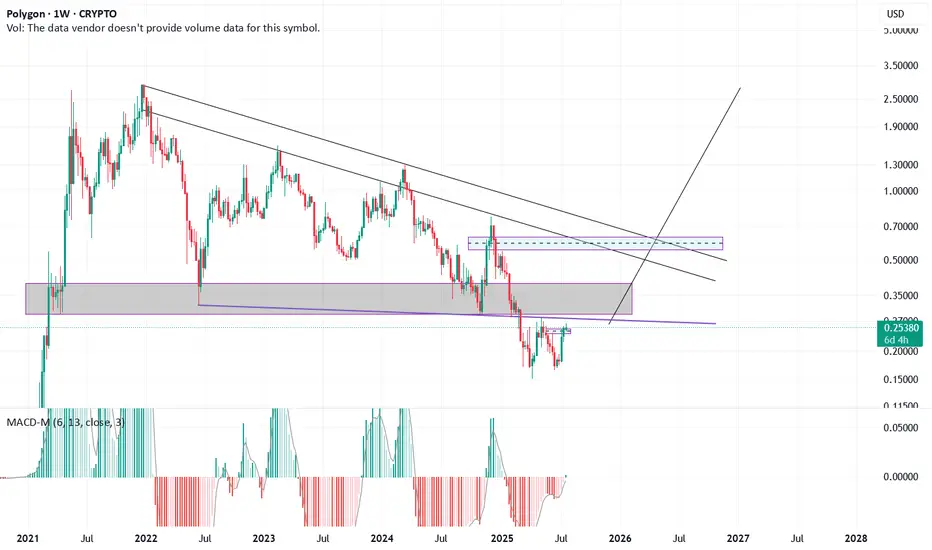
Easy 100% gainsI estimate that soon levels around 0.50$ will be reached and challenged, if it breaks than 0.7$ to 1.0$ are next to come.

MATICUSD Bullish OutlookHi
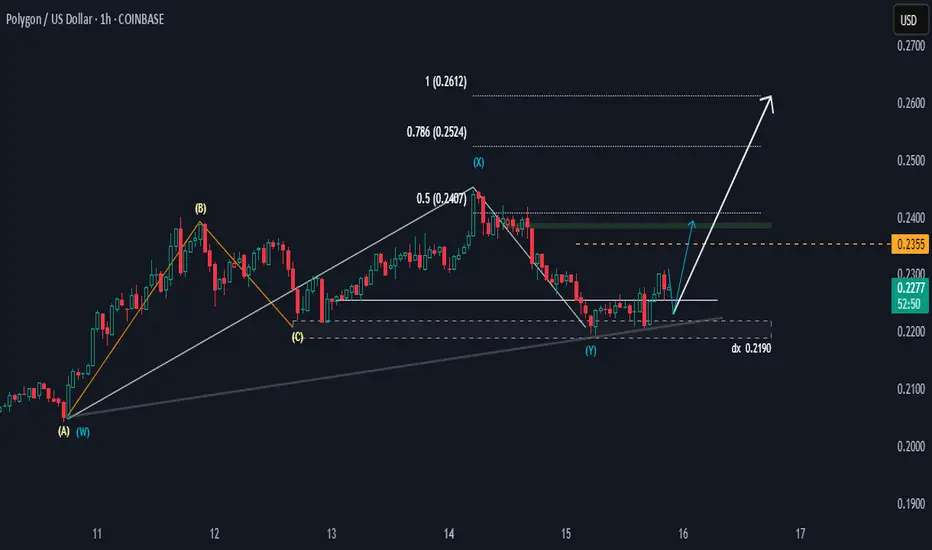
MATICUSD is likely to pulse down and push up to 0.2355 for a bias of 0.2355.
We could also see a price rally up to 0.2524 and 0.2612, provided the 0.2190 holds; if not, then the setup will be invalid.
Happy trading,
K.
MATIC - time for impulse to new ATH!MATIC is doing same moves as BTC did just with a lag. We are oversold with bullish divergence in a falling wedge formation. Just like BTC did I expect Matic to breakout of falling wedge formation and push to new ATH for blowoff top - after that likely correction back to current level so make sure to secure profits on time.
Is MATIC Nearing a Bottom or More Downside Ahead ?
Lower Highs & Lower Lows: The price consistently prints lower highs and lower lows, confirming a bearish structure.
The price is moving along the lower band, indicating persistent bearish pressure.
The middle band (moving average) is acting as a resistance level.
Support: Around $0.20 - $0.21 (current price zone), as it appears to be stabilizing near the lower Bollinger Band.
Resistance: Near $0.28 - $0.30 (middle Bollinger Band) and a stronger resistance at $0.35.
Volume has been relatively low, suggesting weak buying interest.
If $0.20 breaks down, the next strong support might be around $0.15.

MATICUSD Looking BullishHello,
MATICUSD appears overall bullish on the H1 timeframe. Currently, the price seems to be stretching toward the 0.2355 resistance zone, which could lead to a potential bullish pullback.
The resistance at 0.2389 appears significant, with its opposite lower highs, suggesting some attention in those areas.
The 0.2431 level is the desired price target, with a bias toward 0.2485. The price setup is supported by the 0.2258 level, with additional support at 0.2232 and the support area zone around 0.2196.
Happy Trading,
K.
Not trading advice

Matic a.k.a Pol.. Could this be the moment?This is not a buy vall, just sharing the chart from my point of view.
Risk is yours, as always. Trade smart.
~TheChartMystic~

nice buy opportunity for matic (polygan)we are facing the great support area around 0.21 if the paterns close at 0.23 by the end of the week we are going to have nice 30% rise


Polygon's Comeback!#Polygon, a leader of the Ethereum ecosystem since 2019, shows signs of a major comeback after its recent bounce.
Maintaining $0.15 keeps the bullish case valid. Passing $0.28 is the first confirmation, while clearing $0.77 paves the way to target the ATH.
#Matic

MATICUSD - Resistance Flipped SupportSupport has been found along the 200MA on this 4HR chart
This line has previously been seen as an area of strong resistance but now its showing signs of support
This is a sign of further movement up on this 4Hr timeframe

MATICUSD - LongBuy entry at 0,2108 USD with a stop loss at 0,1482 USD.
Profit taking at: 0,3797 USD, 0,7572 USD and 1,2 USD.

XRP, MATIC, SHIB XRP projected significantly higher after crossing "the point of no return" hitting the first target. Both MATIC and SHIB are forming patterns resembling that of XRP. I believe like XRP, MATIC and SHIB will cross "the point of no return" and hit their first targets which are their all time high's.

Elliot wave corrective ABC Triangle pattern Wave A is an impulsive wave that 5 subdivisions. Wave B is an abcde triangle and each wave has 3 subdivisios. a-b of the triangle is connected by wxy (also has 3 subdivisions each).
Look at smaller time frame to see (and confirm structure). Currently looking out for wave d of the triangle (wave 1 of 3) to complete then followed wave e 3 waves in the opposite direction, before there can be any break-out.
This is only an idea not financial advice
