Will this be the final Defense from BUYERS to LIFT Crude ?NYMEX:CL1!
Becoming Profitable in the Auction, is a choice only chosen by the 'PROFITABLE'...
As of December 14, 2025, the (front-month) WTI crude oil futures contract (CL1) has declined by approximately 18% to 20% this year (year-to-date). Now currently we have a Daily Demand zone that ranges from $57.00-$55.00 p/b, will this be the final defense from buyers to lift the offer higher here in the auction or will sellers over power and tank the auction lower? There has been gr8 talks in the Energy Markets that Crude OIL is expected to go into a strong BULL MARKET PHASE starting 2026, what are your thoughts? Lmk in the comments...
Continued Success,
TreyHighPwr
#BHM500K
Crude Oil Futures
Market insights

CRUDE OILDO YOU KNOW WHATS BEHIND THIS OR OTHER IDEAS?? in bio..
Preferably suitable for scalping and accurate as long as you watch carefully the price action with the drawn areas.
With your likes and comments, you give me enough energy to provide the best analysis on an ongoing basis.
And if you needed any analysis that was not on the page, you can ask me with a comment or a personal message.
Enjoy Trading ;)

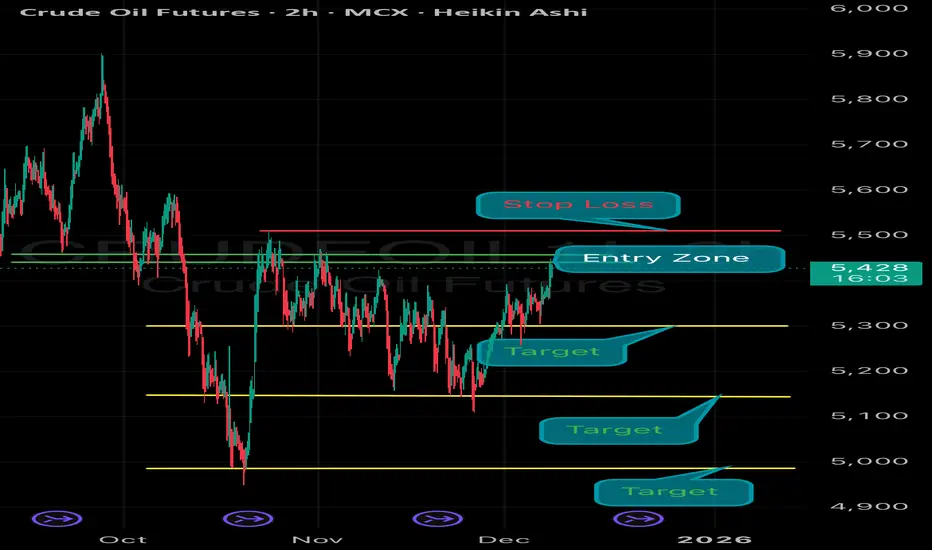
MCX Crude Oil Dec -Bearish Setup The chart has identified a Bearish Opportunity with a well-defined trade structure:
✅ Entry Zone: 5430 – 5440
🔒 Stop Loss: 5510 (Strict SL — no relaxation)
🎯 Target Zone: 5330 - 5200– 5100
⚠️ Risk Management Rule:
Once the trade achieves 1:1 Reward:Risk, immediately shift Stop Loss to Cost-to-Cost to secure the position and reduce downside exposure.
Stay disciplined. Follow levels precisely. 📊🔥
Crude Oil MCX (4H) – Detailed Technical Analysis Trend
Short-term trend is bearish, with consistent lower highs under the falling supply trendline.
Key Zones
🔴 Strong Supply Areas
Ultra Strong Supply: 5400–5550
Immediate Selling Zone: 5280–5340 → Strong resistance. Price must close above this for a clear bullish reversal.
🟢 Demand Areas
Minor Demand: 5080–5150 → Expected short-term bounce zone.
Strong Demand: 4950–5050 → High-probability reversal zone if price drops deeper.
3️⃣ Price Scenarios
🟢 Bullish Scenario
If price holds 5080–5150 and breaks 5280–5340,
Upside Targets: 5350 → 5450
🔴 Bearish Scenario
If price rejects from 5280–5340 OR breaks below 5150,
Downside Targets: 5050 → 4950
4️⃣ Final Outlook
Market currently weak but near demand.
Sustain above 5340 = bullish reversal.
Sustain below 5150 = continuation downside.
⚠️ Disclaimer
This analysis is purely for educational purposes.
Not investment or trading advice.
Always use stop-loss and proper risk management.

Crude Oil Weekly Outlook: Inventory Pressure and 59.7 Key levelBackdrop: The Crude Oil Narrative
The tone in crude oil has been largely defined by a tug-of-war between demand uncertainty and controlled supply. OPEC has maintained its view that global oil demand should continue growing into 2026, but at a modest pace. Despite this, the group has acknowledged noticeable inventory builds worldwide over recent months. That dynamic alone has kept sentiment cautious and has acted as a headwind for sustained rallies.
OPEC+ has also chosen to hold off on further production increases into early 2026. Instead of expanding output, the group is now focusing on capacity assessments and quota alignment among members. This shift signals discipline on the supply side, but also suggests that the group is aware of potential oversupply risk if demand fails to firm up.
Markets have been responding to this mixed backdrop. On one side, controlled supply helps prevent severe breakdowns. On the other, rising inventories and uneven demand expectations limit follow-through on the upside. As a result, price discovery has been driven less by strong directional conviction and more by rotation between value areas, bid blocks, and responsive supply zones. Recent price behavior reflects traders waiting for clearer demand signals before committing to a trend.
What the Market Has Done?
At the end of September the market sold off but found support around the 60.17 area. That initial drop appears to have been triggered by worries about economic growth and a stronger dollar undermining demand.
At the start of October sellers stepped down and held the 62.3 level, which corresponds to the Composite Value area LVN. From that zone prices continued to sell off to 56.0 by mid-October. The continued selloff seems to reflect growing bearish conviction as macro data added to demand fears and inventories remained elevated.
Buyers began to accumulate again, forming bid block 1. From there the market auctioned prices upward back to the 62.3 area where sellers were still present and defended that zone vigorously.
From the last week of October up until the third week of November offers steadily stepped down as the market grinded lower, auctioning price down back toward bid block 1. Buyers responded by stepping up bids and holding the top of bid block 1 range. Throughout the last week of November the market balanced between 59.0 and 57.3, forming bid block 2 with clear buyer accumulation in that area.
In the most recent week, the market balanced between 58.4 (roughly the midpoint of bid block 2) and 59.82 (17 November weekly VPOC). This shifted the weekly value area higher. Last Friday, the market managed a close above the previous week’s VAH, suggesting that buying strength may be gaining momentum.
What to Expect This Coming Week?
The key level to watch is 59.7, which was last week’s VAH.
Bullish scenario
If the market holds above 59.7, anticipate a possible move up toward the 61.0 area, which corresponds to a daily level 1 and the weekly 0.5 SD high.
Expect sellers to possibly defend 61.0.
If price breaks through that zone, the next target is 62.3 (Composite Low Value Area), which is confluent with the weekly 1 SD high.
Bearish scenario
If buyers cannot defend 59.7, the market could drop back through last week’s value area toward 59.0 (previous week’s VAL), confluent with the weekly 0.5 SD Low.
Expect buyers to possibly defend 59.0
Should that support fail, price could move further down toward 58.0 (24 November weekly VPOC), which is confluent with the weekly 1 SD low.
Neutral scenario
If sellers respond at the 61.0 area or if buyers step up at 58.0, the market could balance here and potentially shift value higher as buyers accumulate.
Conclusion
In summary crude oil has been trading under pressure from macroeconomic headwinds and demand concerns while finding support at key zones. The market has rotated between zones and recently shows signs of buyer strength. The key 59.7 level will likely dictate whether price heads toward 61.0 or returns toward 58.0.
What’s your outlook for Crude this week? Drop a comment and give this post a boost so more traders in the community can join the discussion! Thank you.
Disclaimer: This is not financial advice. Trade responsibly and manage your risk carefully.

Crude Oil Showing Lower Rejection For NowCrude Oil Futures (January 2026 Contract) Analysis—4h Chart
Crude oil futures (NYMEX: CLF2026) are trading at $58.92 as of the latest 4-hour bar, showing a positive move of +$0.57 (+0.98%) for the day. Today’s session marks a modest recovery for oil, with prices ranging between a low of $58.31 and a high of $59.05.
Key observations:
After hitting our sell take profit zone this morning, the level was rejected. After dipping to the session low, prices rebounded to close just under the high, suggesting renewed buying interest.
Trend outlook:
With gains near 1%, short-term technicals suggest further upside if momentum continues. Watch closely for a break above $59.05 for confirmation.
Volatility: Intra-session swings remain moderate, but a move above or below today’s range could set the tone for the next direction.
Quick Take:
Crude oil remains sensitive to global supply cues and economic sentiment. Traders should monitor key resistance near $59.05 and support at $58.31 for breakout signals. Cautious optimism is warranted as oil seeks direction near these pivotal levels.
This is not trade advice.
#CrudeOil #Futures #TradingView #OilMarkets #TechnicalAnalysis

Crude Oil Sell around 59.00.target 58.00 to 56.00Crude Oil Market Analysis:
Recent crude oil price movements have been essentially free money; there's no easy analysis to follow. The key is to wait for the right entry point. Sell when the price reaches the expected rebound level. Conversely, as long as it doesn't break 60.50, it remains extremely weak. Crude oil is bearish, and short-term fluctuations don't change the overall bearish trend. Sell at 59.00 today.
Fundamental Analysis:
The Fed's interest rate decision was in line with market expectations. The rate cut didn't bring much surprise to the market, except for the official announcement of further rate cuts in 2026, which was somewhat unexpected. In the long term, this will weaken the dollar and support gold.
Trading Recommendation:
Crude Oil – Sell around 59.00, target 58.00-56.00

CRUDE OILDO YOU KNOW WHATS BEHIND THIS OR OTHER IDEAS?? in bio..
Preferably suitable for scalping and accurate as long as you watch carefully the price action with the drawn areas.
With your likes and comments, you give me enough energy to provide the best analysis on an ongoing basis.
And if you needed any analysis that was not on the page, you can ask me with a comment or a personal message.
Enjoy Trading ;)

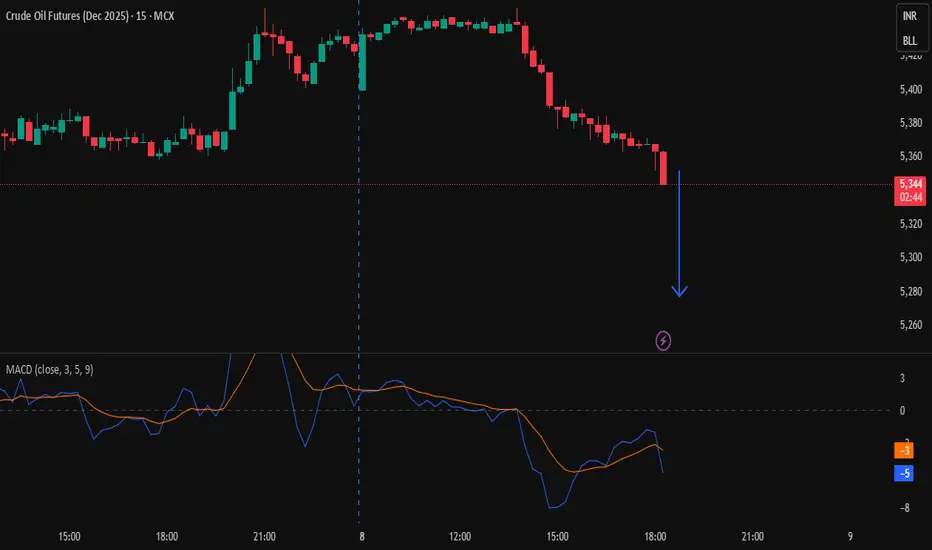
CRUDEOIL DEC 2025 FUTURESPrice making lower low and MACD making higher high and also MACD line if crosses below signal line, I thinks its going to be huge
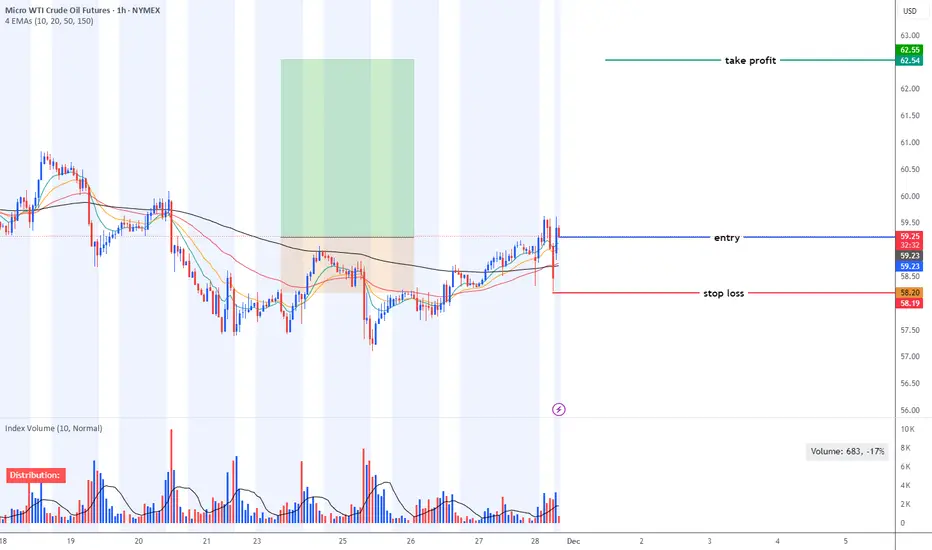
MCL - swing trade opportunity based on technical analysisMCL - swing trade opportunity based on technical analysis.
CRUDE OILDO YOU KNOW WHATS BEHIND THIS OR OTHER IDEAS?? in bio..
Preferably suitable for scalping and accurate as long as you watch carefully the price action with the drawn areas.
With your likes and comments, you give me enough energy to provide the best analysis on an ongoing basis.
And if you needed any analysis that was not on the page, you can ask me with a comment or a personal message.
Enjoy Trading ;)

Compressed SpringRecent crude oil price action reflects a clear compressed spring phase, characterized by an extended decline followed by progressively narrower ranges, repeated lower wicks, and a lack of downside follow-through despite sustained selling pressure. This behavior points to supply absorption by larger market participants, as the market stops reacting to negative news and volatility contracts in an atypical manner. Technically, the accumulation zone is concentrated between 55–57, while the true trigger is a breakout and daily close above 60.30–60.60. A strong confirmation of a regime shift would be a sustained close above 62, a scenario that historically precedes fast, directional expansions rather than gradual moves, shifting risk away from further downside toward an abrupt bullish impulse.
Crude Oil at Key Short-Term Reversal ZoneCrude Oil – 15 Min Short-Term View
Crude Oil is currently taking support in the 5100–5130 zone and is trading near the lower band of a falling channel.
Reversal Scenario:
If the support holds, a short-term reversal towards 5180–5190 is possible.
Breakdown Scenario:
A decisive break below the support may lead to a move towards the major support zone at 4900–5000.

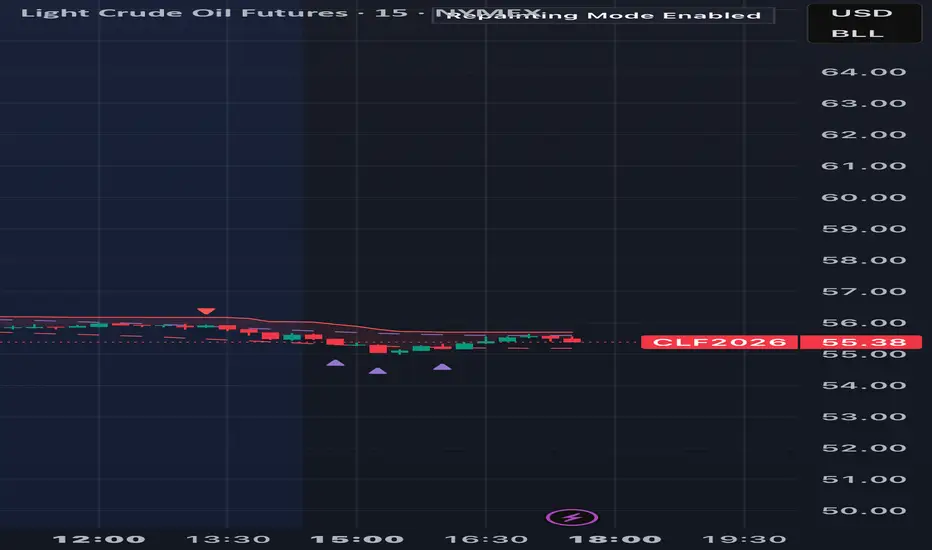
MCL | Wk 51T.A explained -
BackSide (BS)
FrontSide (FS)
Inverse BS (Inv.BS)
Inverse FS (Inv.FS)
BS & FS levels are expected support when dashed lines, tested when dotted and resistance when solid lines.
The inverse is true for the Inv. BS Inv. FS levels, they are resistance as dashed lines, tested as dotted and support as solid lines.
Monthly timeframe is color pink
weekly grey
daily is red
4hr is orange
1hr is yellow
15min is blue
5min is green if they are shown.
strength favors the higher timeframe.
2x dotted levels are origin levels where trends have or will originate. When trends break, price will target the origin of the trend. its math, when the trend breaks, the vertex breaks too so the higher timeframe level/trend that breaks, the more volatility there could be as strength in the orders flow in to fuel the move.

Crude Oil Pattern Formation: Breakout or BreakdownCrude Oil – 1 Hour Timeframe Analysis
Crude Oil is currently trading within a well-defined parallel channel between 5130–5150.
Price action is forming a symmetrical triangle pattern, with a key support zone near 5180–5200.
Breakdown Scenario:
If the price breaks below the pattern support, Crude Oil may first test the 5130–5150 support zone. A sustained breakdown could extend the downside move towards 5050–5030.
Upside Scenario:
If the support zone holds and price sustains above the pattern, an upside move towards 5300–5330 can be expected.
Thank You !!

Crude Oil standing there like an old nightclub bouncerresistance extremely strong
nobody gets in, nobody gets out only tension, stares, and ego.
The market knows it.
The algos know it.
And yet they keep running into it,
as if reality might change its mind today.
But this is where it gets interesting:
we’re no longer in the phase of “technical games.”
This is a turning point in time.
🌍 Venezuela quietly stepping back onto the stage with barrels.
🌍 Ukraine still a permanent geopolitical fault line risk isn’t an event anymore, it’s a condition.
🌍 OPEC talks, the US watches, China accumulates.
The result???
A market that doesn’t want to fall,
but also isn’t allowed to rise,
because this zone is poured with political, economic, and psychological concrete.
Anyone going blind long here
believes in hope.
Anyone blind short
believes in nostalgia.
The market?
It waits.
And that’s exactly what makes this resistance so dangerous.
Crude Oil won’t decide today.
But when it does it won’t be quietly.

Crude Oil MCX Future - Intraday Technical Analysis - 15 Dec., 25MCX:CRUDEOIL1!
Crude Oil MCX Futures — Chart Pathik Intraday Levels for 15-Dec-2025
(If these levels add value to your trades, a quick boost or comment goes a long way in supporting this free content and keeping our trading community thriving!)
Crude Oil Futures are trading around 5,228, compressing exactly at the zero line of 5,228 after a strong intraday recovery, making this band the key battleground between continuation buyers and fresh intraday sellers. Price is stalling just under the Short Exit at 5,238 and the Day Bias – Short / Sell Till Safe at 5,260, so reactions here will define the next impulse.
Bullish Structure
Longs activate above the Long Entry level at 5,231 once price holds above the zero line at 5,228 with convincing follow-through.
Targets: 5,276 (Long Target 1 / primary booking zone) and 5,305 (Long Target 2 / extended move if buyers stay in control).
Control: Place stops or trail risk near 5,222–5,205 (Add Long Pos. base and Long Exit) to avoid being trapped if the breakout fails and price rotates back into the lower range.
Bearish Structure
Shorts remain attractive while price stays below 5,238–5,260, especially on rejection wicks from this resistance band after failed attempts to hold above the zero line.
Fresh shorts open below the Short Entry at 5,212, or on quick reversals from 5,231–5,238 that break back under 5,228.
Targets: 5,180 (Short Target 1 / first profit zone) and 5,151 (Short Target 2 / extended downside if selling pressure resumes).
Neutral Zone
5,228 is today’s inflection—expect choppy, stop-hunting action while crude oscillates between roughly 5,212 and 5,231 without decisive 5‑minute closes beyond either side.
Every setup is designed for structure, plan, and logic—let the chart work for you, not your emotions.
Boost or comment if these levels help your preparation—help Chart Pathik keep delivering quality analysis to more intraday traders!

Looks good above 58.30Looks good above 58.30. Do your self analysis also before going in. But I am bullish.

The #1 Re-entry On Sell Shorting OilCrude oil has found a good re- entry
to a short sell this is something you
really need to look into.
On the press you will see that the president of
the USA recently captured
an oil tanker vessel on the sea port.
It belonged to Venezuela
Which has the largest oil reserves in the world
AM not sure of the details.
But the president Donald Trump
told the media
that it was a huge ship
carrying lots of oil reserves.
Understand that a oil tanker is
so huge approximately
about 16 blocks of
an average neighbourhood
This means if you was on an oil
tanker you would need a car to drive from
one end of the ship to the other end
This drive would take you about 20 mins at a slow speed.
Thats how big these ships are.
I got this concept from Robert Kiyosaki
who was once a ship officer
Having oil reserves allows countries
with this commodity to control
the price of oil which is transported via the sea
ports
Oil is the life blood of the economy
since the beginning of time.
The country that has oil
will gain political and economy power
all around the world
Some speculators say
that the oil price is cheap relative
to the price of bottled water.
this is a signal to note
that the best short price is
in the price of oil NYMEX:CL1!
Trade safe.
Rocket boost this content to learn more.
Disclaimer:Trading is risky please learn risk
management and profit taking strategies
also feel free to use a simulation trading account
before you trade with real money,.

Will Crude Oil Rise or Fall?Crude Oil Futures (Jan 2026) - Market Analysis
Crude oil is trading at $58.39 per barrel, down 0.19%. Recent data show prices ranging from $58.12 to $58.62, indicating a period of consolidation. Key support is forming around $58.12, while resistance is at $58.62.
The overall momentum suggests limited near-term volatility, with the price hovering near its recent lows. Traders should watch for a breakout above resistance or a drop below support for the next directional move.
Stay tuned for further updates as market conditions evolve, and always manage risk
appropriately when trading futures.
#crudeoil #oilprices #trading #commodities #marketanalysis

3 Reasons Oil Prices Are Falling — The Rocket Booster Strategy The Rocket Booster Strategy Explained
🔥 The Rocket Booster Strategy:
Why Oil Prices Are Falling Right Now
==
In the current market environment,
Oil has entered a powerful bearish phase,
and the chart is telling the whole
story. One of the simplest yet most
effective technical confirmations is
what I call
The Rocket Booster Strategy — a momentum
-based system built
around the 50 EMA and 200 EMA.
🚀 What Is the Rocket Booster Strategy?
Think of the 50 EMA and 200 EMA
as “boosters” that guide trend
direction and strength.
When price is above both EMAs,
the trend has bullish thrust.
When price is below both, the boosters
point downward, signaling
strong downside momentum.
Right now, Oil is experiencing exactly that.
📉 Why Oil Is Falling
1. Price Has Broken Below the 50 EMA
The 50 EMA is the first momentum filter.
When price closes below it, short-term
strength weakens and buyers lose control.
2. Price Is Also Below the 200 EMA
This is the bigger confirmation.
The 200 EMA represents long-term trend direction.
Once price sits below it together
with the 50 EMA, the market enters a
“gravity zone,” where selling pressure accelerates.
3. EMAs Are Widely Spread
The distance between the two EMAs
is expanding — a sign that the bearish
momentum is not just a pullback
but a trend continuation.
This is a classic rocket-booster
alignment but pointed downward.
🧭 What This Means for Traders
The Rocket Booster Strategy tells
you one thing:
➡️ The path of least resistance for
Oil right now is DOWN.
This setup is often used by
trend followers to:
Take short positions on pullbacks
to the 50 EMA
Ride momentum moves as long
as price stays below both EMAs
Target previous swing lows or
major demand zones
It’s not about predicting — it’s about
trading with the flow.
⚠️ Risk Notes
No strategy is perfect.
Always watch for:
Fakeouts above the 50 EMA
Sudden news-driven spikes
Oversold conditions on
higher timeframes
Key support levels that
may attract buyers
📌 Final Thoughts
The Rocket Booster Strategy is powerful
because it keeps trading simple.
When the 50 EMA and 200 EMA are
stacked above price, the boosters
are firing downward.
Oil is currently in this
formation, meaning
sellers still control the market.
Until price climbs back above the
EMAs with strong candles, rallies
may simply be
opportunities to sell into
strength.
Rocket boost this content to learn more.
Disclaimer: Trading is risky please learn risk
management and profit
taking strategies
also feel free to use a simulation
trading account before
you trade with real money
