IF GOLD drop below 96400 next targets would be 96290 and 96160 If price break 96400 level then u can look to short it for small targets.
Gold Guinea Futures
GOLDGUINEA1! trade ideas

NEUTRAL ON Gold FOR NOWI dont see a clear direction for Gold just yet, I am on the sidelines, waiting for buy side or sell side to get ran first,
I am more bearish than bullish because Dxy seems to be cooling off from its down trend.

GOLD WATAFALL INCOMINGOkay so this is called a channle and golds not holding it to well so down we go also with war pressues relaxing its a real GOLDKiller anyws use SL be safe and
have fun! XD

#XAUUSD Bearish on GOLDLooking for shorts from these zone on XAUUSD, Will be looking for confirmation before entering.

Gold to double in value over the next 3 years!Keeping in line with the massive dollar dump that is about to occur, it is gold that will be the biggest beneficiary.
If it keeps its current rate of advance, it will double in value before the end of '28!

Gold Futures BOS does Bearish move might steps in?There is a breakout of the EMA with confirmation of rising Volume, which indicate a strong short position also with NFP shows strong job claims that's why we anticipated a fall in gold, especially for those who want to enter lastly you should consider waiting for a pullback to catch the second move. Follow GoldenZoneFX For more content and valuable insights.

Buying the Dip or Catching a Knife? My Gold Setup Explained.Entered a long position on XAU/USD from the 1H demand zone following sharp intraday selling into a key support level. With gold hovering near $3,300 and a significant testimony from Fed Chair Powell on deck, the setup aligns with both technical rebound potential and fundamental uncertainty that could fuel upside.
The goal here is to play the liquidity vacuum left after aggressive positioning was cleared, with tight invalidation and asymmetric reward.
Technicals:
• Entry aligned with prior price inefficiency and confluence of multiple demand zones
• 1H structure shows clear deviation below the range with immediate buy-side response
• EMA channel flattening, indicating potential compression ahead of expansion
• First target: $3,352
• Risk-managed with defined stop-loss below $3,260
Execution Note: This is not a “hold forever” trade. It’s an opportunistic reaction to unwind + sentiment imbalance.
Fundamentals
• Gold saw a 25% surge in 2024 due to safe-haven demand and dovish policy, but enters 2025 under pressure from:
▫️ A strong USD
▫️ Higher cost of carry
▫️ Speculators taking profit
• Fed policy remains the core variable:
▫️ A hawkish tone from Powell could weigh on price
▫️ Rate cuts would likely revive bullish momentum
• Central bank demand remains supportive
• Geopolitical tensions (Russia-Ukraine, Israel-Iran) could trigger safe-haven bids again.
Bearish headwinds:
• Waning bullish momentum per RSI divergence
• Reduced rate cut expectations post-election
• Powell’s testimony could revive volatility either way.
This is a short-term tactical long, not a macro bet. With sentiment temporarily overextended and key support defended intraday, this is a high R/R window to exploit Powell-related volatility.
Let’s see how price reacts into $3,350+. Any sustained strength there would open room toward $3,400, while failure would confirm a retest of $3,260s.
Note: Please remember to adjust this trade idea according to your individual trading conditions, including position size, broker-specific price variations, and any relevant external factors. Every trader’s situation is unique, so it’s crucial to tailor your approach to your own risk tolerance and market environment.

Gold Update: Possible Triangular Consolidation Before New RallyIt looks like corrective wave 4 is in the making within a large Triangle
3 waves A, B and C already emerged in 3-waves structure
which confirms triangle
Wave D should stay under the top of wave B
Wave E could either touch or break down the support line
It should keep above the valley of wave C
Target area changed higher as this consolidation tends to narrowing within a
contracting triangle.
Lowest target now $3,900
Optimistic target is at $4,300
Breakdown below $3,123 would invalidate the pattern

Double Top Breakdown at Resistance ZoneThe chart reveals a classic Double Top pattern formation near the 3,360–3,480 resistance zone, followed by a clear bearish rejection (highlighted with red arrows). This confirms the presence of strong supply pressure in that region.
🔍 Key Technical Highlights:
🔺 Double Top Pattern
The price formed two swing highs near the resistance zone, failing to break above.
After the second peak, the price started declining, confirming the reversal pattern.
📉 Bearish Channel
The recent downtrend is contained within a descending channel, with consistent lower highs and lower lows.
Price broke below the neckline of the double top pattern around 3,270.
🎯 Target Projection
Based on the height of the double top pattern, the projected downside target is near 3,207.5, aligning perfectly with the support zone marked below.
🟠 Historical Support Areas
The large orange circles indicate key reaction points, confirming that the 3,207–3,220 area has acted as support in the past.
📊 Outlook:
If the current bearish momentum continues, price is likely to head towards the support target zone at 3,207.5. Any pullback toward 3,320–3,350 could provide a shorting opportunity with stops above the recent highs.
🔧 Bias: Bearish
📍 Resistance: 3,360–3,480
📍 Support: 3,207–3,220
📍 Target: 3,207.5

Gold May Find Support From These Various FactorsGold May Find Support Amid Concerns Over U.S. Debt Sustainability, Economic Weakness, and Renewed Geopolitical Tensions
Gold prices are holding steady today, near $1,353 per ounce in spot trading, in what is expected to be a low-liquidity session due to the early closure of U.S. markets. This follows three consecutive days of gains.
The yellow metal’s subdued movement comes as markets await key labor market data that may offer further insight into the health of the U.S. economy, especially after the recent shock from ADP figures.
Gold continues to find support from several underlying factors that could sustain its upward trend this week. These include rising uncertainty around the long-term sustainability of U.S. public finances and the risk of renewed conflict in the Middle East.
Concerns over U.S. fiscal stability have intensified following the introduction of the “One Big Beautiful Bill Act,” which combines tax cuts with spending reductions. In an opinion article for The New York Times , former Treasury Secretaries Robert Rubin and Lawrence Summers warn of the bill’s potentially severe consequences, including persistently high interest rates, reduced business confidence, falling investment, and the risk of a financial shock that markets may struggle to absorb. This could also leave the economy more vulnerable to economic and geopolitical threats.
Such risks may erode investor confidence in U.S. government debt, potentially boosting gold’s appeal as a safe-haven asset even in an environment of elevated bond yields and prolonged high interest rates.
On the geopolitical front, the specter of renewed escalation in the Middle East looms, and this time, the consequences could be more severe. Amid conflicting reports and statements regarding the extent of the damage to Iran’s nuclear facilities, both sides appear to be preparing for the possibility of renewed hostilities.
Diplomatic efforts remain stalled, and hardline voices continue to call for a return to conflict. In an opinion piece for The New York Times, former National Security Advisor John Bolton described negotiations with Iran as ineffective and dangerous, calling instead for regime change and the use of force.
While previous rounds of conflict have not caused lasting damage to the global economy or energy supply chains, a new round may prove more disruptive. According to Reuters , Iran has reportedly loaded naval mines onto vessels, raising fears that it may attempt to close the Strait of Hormuz.
Such a move would cross a critical threshold and turning a contained conflict into one with global economic implications. The Strait of Hormuz handles over one-fifth of the world’s crude oil and liquefied natural gas exports.
However, Iran may avoid this step as long as its own oil exports continue flowing through the strait, as was the case during the last conflict in June.
On the trade front, there is growing optimism about the potential for new agreements that could ease tensions that have disrupted global supply chains and threatened U.S. and global economic growth. This optimism follows President Trump’s announcement of a trade deal with Vietnam.
There is also hope that progress can be made with China. Recent reciprocal steps, that involve the easing of restrictions on rare earth exports by China and some relaxation of U.S. technology export controls, suggest that the de-escalation agreed upon earlier in Switzerland could hold, potentially laying the groundwork for a broader trade agreement.
Samer Hasn

Gold is Pushing Bullish but is it really ready???This looks like a early move to move full on bullish. I feel like it might need to sweep the low from mid week before they really ready to go bullish. waiting for things to show a bit more clear during the Kill Zone.

Gold back to $3300 - Week of July 4thPretty clear cut and dry, we have a significant mark down followed by a pump overnight.
Today and into tomorrow I’m looking for a drop back to the $3300 levels.

Navigating Gold Futures: Support, Resistance, and ProjectionsCOMEX:GC1!
The chart appears to depict a clear five-wave pattern: I, II, III, IV, and V.
Waves I to III show strong upward movements, indicating bullish sentiment.
Wave IV looks like it could be a corrective phase, with a potential dip before another upward movement in Wave V.
Support and Resistance Levels:
The horizontal lines around 2,800 and 2,575.3 indicate critical Fibonacci retracement levels (38.20% and 50%).
If the price approaches these levels during the correction, they could serve as support, making it a potential buying opportunity.
RSI Indicator:
From the bottom indicator (RSI), we can see fluctuations in momentum, which can aid in timing trades.
Look for interpretations of the RSI: if it trends towards the extremes (overbought/oversold), that could signal reversal points.
Future Projections:
Should the market respect the outlined support levels, Wave V could potentially push towards a new high above 4,000 as indicated by the upward projection.
Market Sentiment:
Overall, the pattern suggests a bullish outlook long-term, but caution is warranted during corrective phases as prices might retrace towards support levels.

Gold, GC!, Sideway to the Downside (Long Term)06/30/2025, 10:30 PM PT
GC! is currently at its max around 3,500.
On the Weekly MACD, the crossover between MACD lind signal line already happened. There is also a bearish divergence on weekly chart.
On the Daily chart, RSI just crosses below 50 on RSI, and MACD shows weakness on the bull (it still not in the bear's territory just yet).
Reversasl to bear side may happen if price stays below 3,200
Bullish will continues if price break out of all time high
Current range for big timeframe from 3,200 - 3,500
Plan for swing trade:
Bullish Case (short term): break trendline. If hold above 3,360, price could go up to 3,400 -> 3,450
Bearish Case (short term): If price rejects and stays below 3,360, price could go down 3,310 -> 3,280
***Disclaimer: This analysis and trade plan are for educational and informational purposes only and should not be considered as financial or investment advice.

Whats the Play for the week? Are we bullish?Looking for more bullish activity to continue. Just need to see price confirm if it is indeed ready to proceed. if we can find a solid entry we will rock with it. but not trying to force anything.

Short GC futures at 3,290.Strategy: Short GC futures at 3,290.
Entry: 3,290 (near current price, aligning with resistance).
Target: 3,250 (support level, 1.2% downside).
Stop: 3,310 (above resistance to limit risk).
Rationale: Bearish technicals (RSI divergence, declining open interest) and USD strength support a short-term pullback, with US Retail Sales as a potential catalyst.

STEEL-NERVE SETUP – ARE WE RE-LIVING GOLD’S 2020 BEAR-TRAP?Retail sentiment is ultra-bearish, positioning is cooling, Silver is outperforming and the S&P 500 is screaming risk-on … exactly the cocktail we saw in June 2020, right before Gold & Silver exploded higher.
1️⃣ WHY THIS FEELS LIKE 2020 AGAIN
2025 (now) 2020 (pre-rally) Read-through
> 70 % of TradingView ideas are bearish 💬 > 60 % were bearish Crowd may be offsides again
Managed-money net-longs -18 % from April peak 📉 -25 % from March peak Powder for fresh longs
First monthly ETF outflow (-$1.8 bn) 🚪 Record inflows Capitulation, not euphoria
Gold/Silver ratio down to 94 ⚖️ Fell to 95 Silver leadership = bottoming tell
S&P 500 at new ATH 📈 S&P at new ATH Risk-on backdrop identical
2️⃣ WHAT’S DIFFERENT THIS TIME
Real 10-y TIPS yield +0.7 % (2020: -1 %) → smaller monetary tail-wind.
Gold already at inflation-adjusted ATH → upside could be shorter & sharper, not a fresh super-cycle (yet).
3️⃣ CHECKLIST FOR A REAL BEAR-TRAP
Signal Watch-level
Gold holds $3 200–3 250 (100-d SMA + fib) Daily close above zone
Gold/Silver ratio breaks < 90 Momentum confirmation
CFTC net-longs < 150 k Position flush
ETF flows turn positive Fear → FOMO
S&P stumbles / vols spike Classic risk-bid for Gold
Need 3 of 5 boxes ticked to validate the squeeze thesis.
4️⃣ CATALYST CALENDAR
3 Jul – NFP: sub-75 k print could fire the opening salvo.
9 Jul – Tariff freeze decision: escalation would revive safe-haven demand.
15 Jul – CPI & 30-31 Jul – FOMC: dovish turn + soft data could complete the squeeze.
Disclaimer: This post reflects my personal opinion for educational purposes only; it is not financial advice. Trading futures and commodities involves substantial risk and can lead to total loss of capital—do your own research (DYOR) and consult a qualified professional before acting.

GOLD TRADING IDEA FOR 14-18 JULY 2025The price of Gold currently at the H4 liquidity control area at 3376. It's seem like there candlestick H4 rejection at that area but still not valid for market structure shift direction.
If the candlestick breakout above at H4 liquidity control ,I will looking opportunity for long position with target at next H4 liquidity control at 3390 or extension target at 3410.
short term SELL
Price retracement before the price going up.
If small timeframe show market structure shift or develop bearish engulfing pattern at H1 0r m30 below 3376 . The target will be h4 liquidity control at 3354 or 3320 depend on how price act at that area.

Performance Audit GC Precision Week (W/E July 11, 2025)This week’s operations focused solely on GC (Gold Futures) with a disciplined structure-first model. Only five trades were executed — all pre-validated, rule-based, and logged. The result: +6.8% portfolio gain, a controlled 1R max risk profile, and no strategy deviation.
No forecasts. No overtrading. Only defined setups and asymmetric execution.
Staakd isn’t about high-frequency noise it’s about data-driven decisions, edge alignment, and position sizing that compounds over time.
Weekly Summary
Trades Taken 5
Wins 4
Losses 1
Win Rate 80%
Avg R/R Ratio 2.1:1
Net R Gained +6.4R
Portfolio Growth +6.8%
Max Drawdown (in-session). < 1R
Strategy Deviation 0%
Overtrading Incidents 0
Context:
Most professional day traders target 1–3% per week. Prop firms often expect 8–10% per month. A +6.8% weekly gain, on just 5 trades with strict risk control, reflects not just profitability — but edge, structure, and execution precision.
Systems Deployed
ORB Breakout Model — NY Open-based volatility extension
Pre-Market Liquidity Sweep Model — Asia Close setups
Supply/Demand with Imbalance Filtering
Session Volatility Overlay — Trade windows confined to high-probability timeframes
All positions were triggered only after full multi-signal confirmation:
▫️ HTF structure validation
▫️ Liquidity mapping
▫️ FVG/inefficiency alignment
▫️ Volume + time-of-day confluence
No trades taken outside predefined protocols. No scalping. No overrides.
Trade Validity Scoring
Entry Logic Precision 91.6%
Setup Integrity 100%
SL Discipline 100%
Journal Compliance 100%
Emotional Bias Detected 0%
The one loss was structurally valid, aligned with bias, and managed with precision. Losses don’t damage equity emotional errors do. None occurred.
Next Week Model Update
Asset Focus: GC (Gold Futures) remains primary
Schedule: Monday–Thursday only (Friday excluded for edge decay)
Sessions: NY Open and Asia Close exclusively
Setup Preference: Structure > Imbalance > Sweep
Trade Limit: 1 per session max
Bias: Continue compounding gains through mechanical execution
Why Follow Staakd?
If you’re tracking setups like a quant not a gambler and you value transparency, discipline, and systems over hype: @stakkd on TradingView Every move is structured. Every result is tracked. No guesswork. Just edge.
GOLD - Lovers Elliott wave - looking strong Short/Medium termGOLD-----Daily counts indicate Excellent bullish wave structure.
Both appear to be optimistic and this stock invalidation number (S L) wave 2 low
target short / long term are already shared as per charts
correction wave leg seems completed (C)
Investing in declines is a smart move for short/ long-term players.
Buy in DIPS recommended
Long-term investors prepare for strong returns over the next two to five years.
one of best counter
Every graphic used to comprehend & LEARN & understand the theory of Elliot waves, Harmonic waves, Gann Theory, and Time theory
Every chart is for educational purposes.
We have no accountability for your profit or loss.

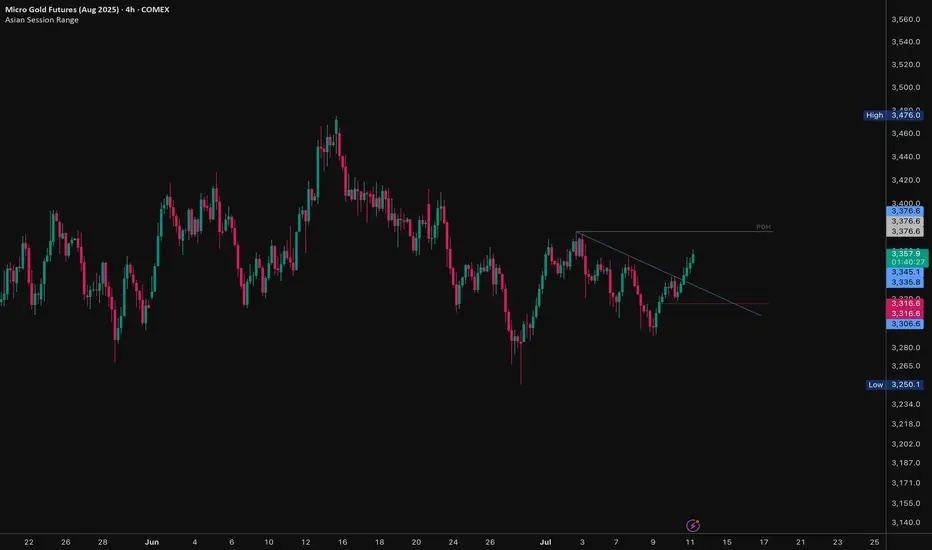
Gold - Watching for Trendline Retest Gold has shown a significant breakout from a recent downtrend resistance line on the 4-hour chart. The price action suggests a shift in momentum, but a potential retest of the broken trendline offers a high-probability entry point.
Technical Analysis:
Trendline Breakout Confirmed: The provided chart clearly shows XAUUSD breaking above a descending trendline that has defined the recent short-term consolidation/downtrend. This breakout indicates a potential resumption of bullish momentum or the end of the consolidation phase.
Immediate Resistance: The price has encountered resistance near the area of the previous daily high (PDH) or a local swing high around 3,376.6. This level will be the immediate target for buyers if the breakout holds.
Potential Retest Zone: A common occurrence after a trendline breakout is a "retest" of the broken resistance level, which now acts as support. The trendline itself and the immediate support levels identified on the chart (e.g., 3,335.8 to 3,316.6) form a potential retest zone.
Trade Idea & Strategy:
The primary trade idea is to wait for a technical confirmation of the breakout by observing a retest of the broken trendline.
Entry Strategy (Bullish Confirmation):
Wait for the price to pull back towards the broken trendline (approximately 3,330 to 3,345 area, depending on the exact slope).
Look for bullish reversal signals (e.g., candlestick patterns like hammers, engulfing patterns, or significant buying volume) at the trendline support.
Enter a long position upon confirmation of support at the retest zone.
Potential Target 1: The recent swing high/PDH area around 3,376.6.
Potential Target 2: If Target 1 is cleared, the high of 3,476.0 (or previous major resistance levels).
Stop Loss: Place a stop loss below the low of the retest candle or below the significant support area (e.g., below 3,300), invalidating the bullish setup.
Alternative Scenario (Bearish Rejection):
If the price fails to hold the trendline support during the retest and decisively breaks back below it, the breakout may be considered a false breakout. In this scenario, the market could revert to the previous downtrend structure.
Disclaimer: This is an analysis for educational purposes and is not financial advice. Always perform your own research and risk analysis before trading.
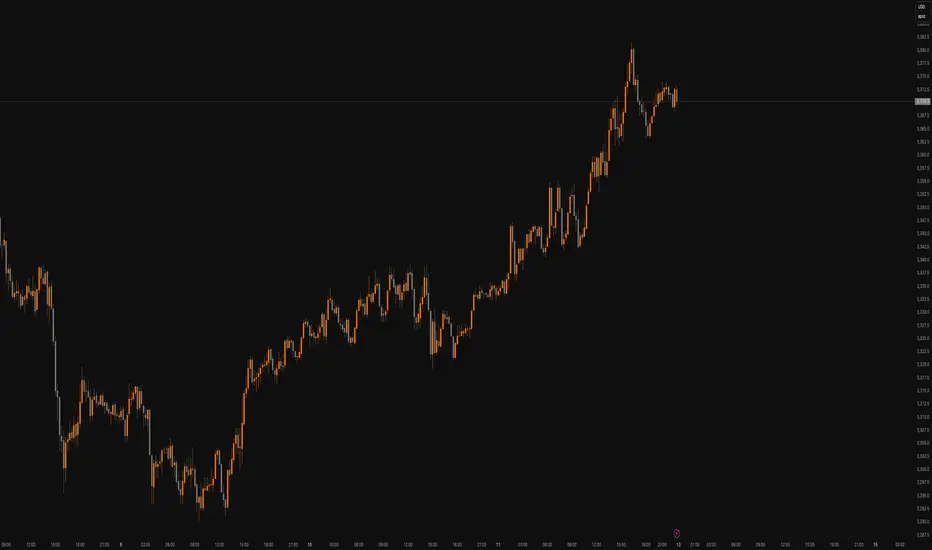
NY Open PlaybookGold is extended heading into NY, but structure is clean and bullish. We’re sitting above PDH and holding a reclaimed supply zone. If $3,364 holds, we expect continuation toward $3,384–$3,390. If NY rejects at the top, watch for a clean reversion to $3,346 and possibly lower. Key decision level is $3,364.
Key Levels
PDH - $3,359
Previous day high (currently holding above)
PDL - $3,310
Previous day low
Displaced HVRA - $3,346 – $3,350
Reclaimed supply → demand (buy zone)
FR Demand Block - $3,324 – $3,335
Fair range support if trend fails
Primary HVRA - $3,372 – $3,384
Main target / short trigger zone
ATE Extension - $3,390+
Final bullish extension target
Bullish Scenarios
(b]Reactive Long
Entry: $3,346 – $3,350
SL: $3,343 (aggressive) or $3,339 (safe)
TP1: $3,364
TP2: $3,372
TP3: $3,384
Momentum Breakout Long
Trigger: Break + hold above $3,364
SL: $3,358
TP1: $3,372
TP2: $3,384
TP3: $3,390+
Bearish Scenario
Rejection Short
Entry: $3,372 – $3,384 (on wick/failure)
SL: $3,390
TP1: $3,358
TP2: $3,346
TP3: $3,335
Direction is binary at $3,364. Whether we rotate down or extend up, both plays are valid execute with discipline, not bias.

Gold vs UNI – Is UNI in the Early Stages of AccumulationThis comparison between Gold (MGC1!) and Uniswap (UNIUSDT) on the weekly timeframe suggests that UNI could be in Phase 1 of a buy program, similar to how gold accumulated before its major breakout.
📌 Key Observations in the Chart Comparison:
PHASE 1: The Accumulation Zone (Green Highlighted Area)
Gold went through a long accumulation period (2013–2017), trading in a sideways range before its parabolic impulse leg kicked in.
UNI is currently in a similar consolidation phase, potentially in the early stages of accumulation.
The monkey face + pointing emoji suggest a "stealth phase" where most retail traders remain unaware of the underlying accumulation.
Old High & Market Structure
Gold formed a major high, crashed, and accumulated before breaking out.
UNI also reached an all-time high (~$44), crashed, and is now ranging in what looks like a potential accumulation phase.
Similar structural formation suggests UNI could be following gold’s footsteps.
Impulse Leg & Breakout Potential
Gold’s first major breakout came after a long accumulation, followed by a massive impulse move (Phase 2).
If UNI is mirroring gold, the next breakout could start the impulse leg leading to a retest of old highs and beyond.
Standard Deviation Extensions (STDVN) – Potential Price Targets
Gold reached 0.5 and 1 STDVN levels after its breakout, which became short-term targets before continuation.
If UNI follows a similar trajectory, targets could be $44.77, $64.98, and eventually $85+ if the accumulation plays out.
🔮 What This Means for UNI?
Early accumulation phase means the smart money is likely positioning.
Price compression leads to expansion—UNI could be preparing for an explosive move.
Similar to gold, UNI could break above accumulation and enter Phase 2, targeting 0.5 and 1 STDVN levels.
If UNI truly follows gold’s structure, long-term price discovery is on the table.
🚨 Lord MEDZ Trading Perspective
"Not financial advice, but let’s keep it real…"
Gold showed the exact same pattern before making a historic move. UNI is mirroring the early accumulation phase.
This is the shakeout before the breakout. Smart money is accumulating while retail panics.
Patience = Wealth. Stay ahead of the crowd.
🚀 UNI could be setting up for something massive. 🚀
