Gold loading up on buys but first, more drops!Gold is in a place where many are loading up on buys and I understand why. Gold has been taking some significant drops since pushing all time highs but check my charts and reason with me.
In the large timeframes gold still has some movement down to complete the cycle before going back for all time highs again.
Additionally it’s holding the $3388 resistance level (futures price) pretty strong on the 15 minute chart. It’s gonna be an interesting week for gold to say the least.
Gold Mini Futures
GOLDM1! trade ideas
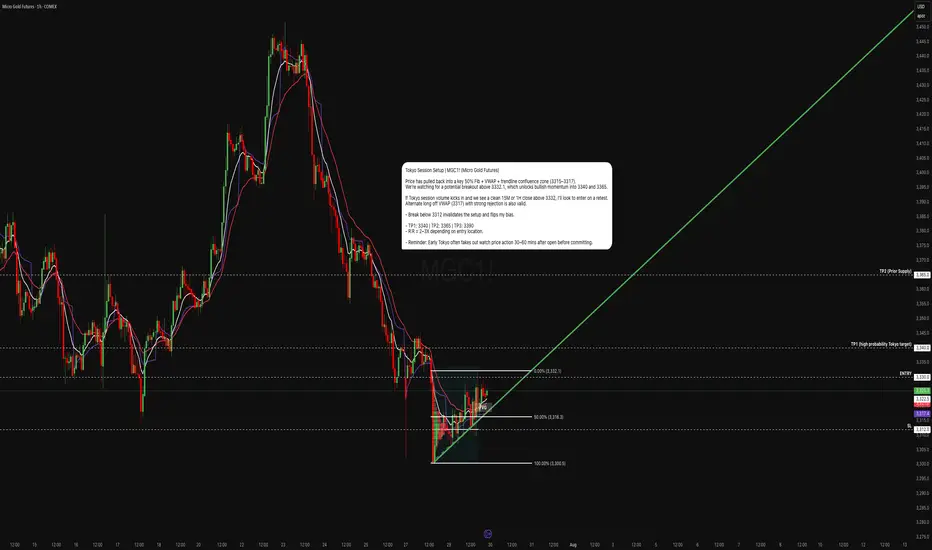
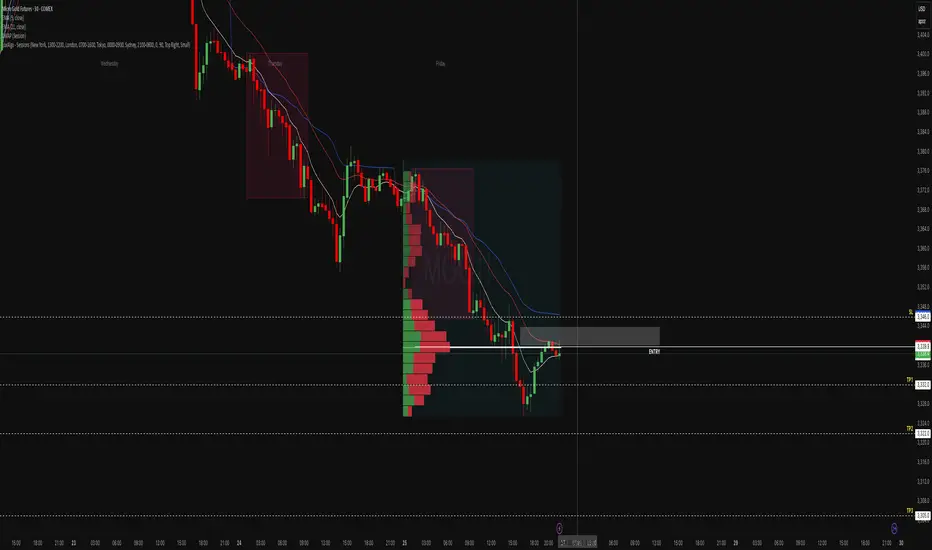
Gold’s in the Chop Shop. Tokyo’s Got the KeysGold has entered a key decision zone ahead of Tokyo. After a controlled retracement off the 3332 swing high, price has now compressed into a high-probability confluence pocket:
- 50% Fibonacci retracement (3316.3)
- VWAP acting as dynamic support (~3317)
- Trend line support holding from prior structure lows
- Compression below 3332.1 the breakout gate
If Tokyo volume engages, this could trigger a clean structural breakout into higher liquidity zones.
Primary Entry:
- Trigger: 15M or 1H candle close above 3332.1
- Entry Range: 3333.0 – 3334.5 on retest confirmation
- Stop Loss: 3312 (below trend line + VWAP)
Aggressive Entry (Mean Reversion):
- Bounce off VWAP/Fib zone (3316–3317.5) with bullish reaction
- Tighter SL: 3312–3314
- Lower R:R, but better pricing
Target Zones:
- TP1 3340 Minor resistance & round number
- TP2 3365 Prior breakdown zone / supply
- TP3 3390–3400 Extended Tokyo move + trend reversal territory
If I'm Wrong:
A breakdown below 3312 invalidates the bullish thesis. That would signal VWAP failure, trend line break, and potential reversion to 3300 or lower.
Technical Confluence Checklist:
- VWAP support holding - Complete
- 50% Fib bounce attempt - Complete
- EMAs compressing for potential crossover - Complete
- Clean trend line structure intact - Complete
- Low volume chop zone between 3312–3332 - Caution
Tokyo often fakes the initial move. Ideal trigger confirmation comes 30–60 mins after Tokyo open, once liquidity builds. Watch for manipulation wicks around VWAP before committing.
This is a classic quant compression setup, price is coiled into structure, and all major intraday tools align. If we see a clean move above 3332 with volume, the breakout could unfold fast. But lose VWAP and trend line, and the bias flips instantly.
Stay reactive, not predictive. Let price prove direction.
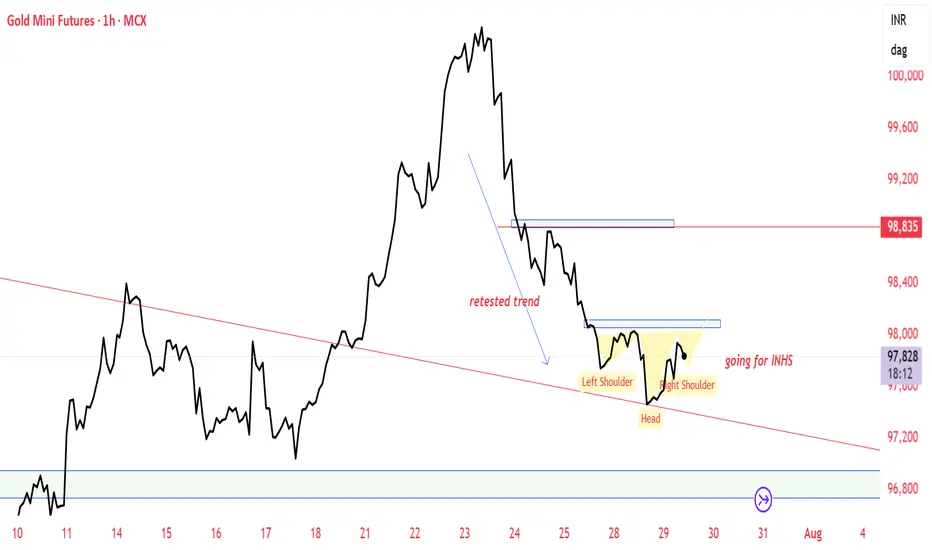
GOLD MCX BULLISH VIEWAfter 4 days continuous down side Some pullback relief expected till 99000. Tested trendline near support zone of 96900 and supply zone near 98200-98500-99000
Please do your own research before taking any trading decisions

mcx future gold price moving we are prepare technical chart upcoming price expected down 98100 R
97890, 97690, EXPECTED S1 & S2
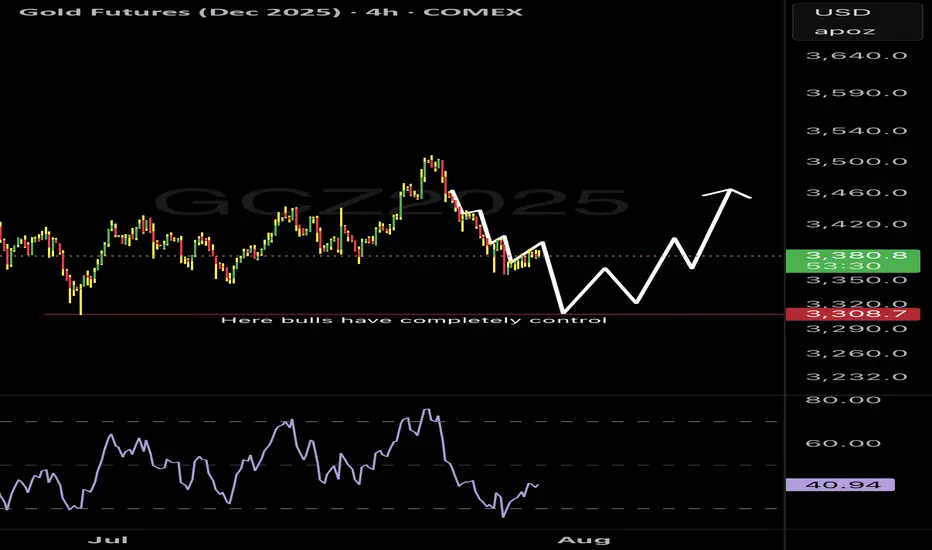
GOLD - GC Weekly Recap & Outlook | 27.07.2025🧾 Weekly Recap:
• Price tapped into the 1H Demand Zone (red box) and ran the 4H swing liquidity before bouncing to clear internal range liquidity.
• This move was followed by a retracement which led to a break of the bullish trendline.
This may signal the beginning of a broader accumulation phase. Expect choppy price action targeting internal liquidity both above and below, before a clear trend resumes.
📌 Technical Analysis:
Price has closed below the bullish trendline, leading to two possible scenarios:
1. Bullish scenario (black path):
– Price runs the W C DOL (3313$) →
– Finds rejection →
– Retests broken trendline →
– Breaks above the trendline →
– Continues toward 3444$ and potentially 3474$
2. Bearish scenario (orange path):
– Price runs W C DOL (3313$) →
– Rejects from the broken trendline →
– Fails to reclaim it →
– Continues downward to target M C DOL (3256$)
📈 Setup Trigger:
Wait for clear 1H–4H supply/demand zone creation and structure shift before initiating a trade.
🎯 Trade Management:
• Stoploss: Above/below relevant supply-demand zone
• Targets:
– Bullish: 3444$, 3474$
– Bearish: 3256$
🟡 If you liked the idea, feel free to drop a like & comment — and don’t forget to follow for more weekly updates.

Gold. GC1! Weekly Outlook. 27.07.2025, SundayCOMEX:GC1!
Outlining gold on HTF. Waiting for FOMC and NFP

MGC Tokyo Fade: If It Rejects, It DiesThis one was a request from someone asking for a breakdown of MGC heading into the Tokyo session so here’s the full quant review.
After Friday’s clean liquidation, gold found temporary footing around 3330. But the bounce is stalling under VWAP (3344) and Friday’s POC both stacking resistance like a ceiling of bricks. EMAs are fanned and directional, suggesting sellers still control the structure.
VWAP + POC = kill zone for a potential Tokyo fade.
Quant Review:
- Friday Session POC: 3341.9 — currently acting as resistance
- VWAP (Session): 3344.6 — unclaimed on the bounce
- 9 & 21 EMAs: Bearishly stacked, aligned with VWAP
- Volume Profile: Value area is lower; price is rejecting acceptance higher
- Microstructure: Weak bounce into resistance without reclaim of structure
Trade Plan (Short Bias):
- Entry Zone: 3340–3344 (VWAP/POC cluster)
- Trigger: Bearish engulfing or LTF rejection off VWAP shelf
- TP1: 3332 (prior low)
- TP2: 3322 (thin node sweep)
- TP3: 3305 (session low extension)
- Stop Loss: Above 3346 (structure + shelf break)
- R:R: 1.5–5 depending on scaling
- Probability of rejection and drop to 3332: 65%
- Probability of full leg to 3322–3305: 30%
- Risk of breakout above VWAP: 5%
If I’m Wrong
The Sunday open is always a wildcard sometimes you get pure trend continuation, other times it’s total chop or liquidity grabs before the real move unfolds in London.
If price cleanly reclaims 3346, closes above with strength, and holds the short idea is off. At that point, I’d expect a sweep toward 3355–3360, potentially tagging the high-volume node from mid-Friday.
In that case: Flip bias to bullish retrace into early London.
Bonus:
If you ever want a quant-style breakdown or session analysis like this just reach out. We break it down with structure, stats, and setups.
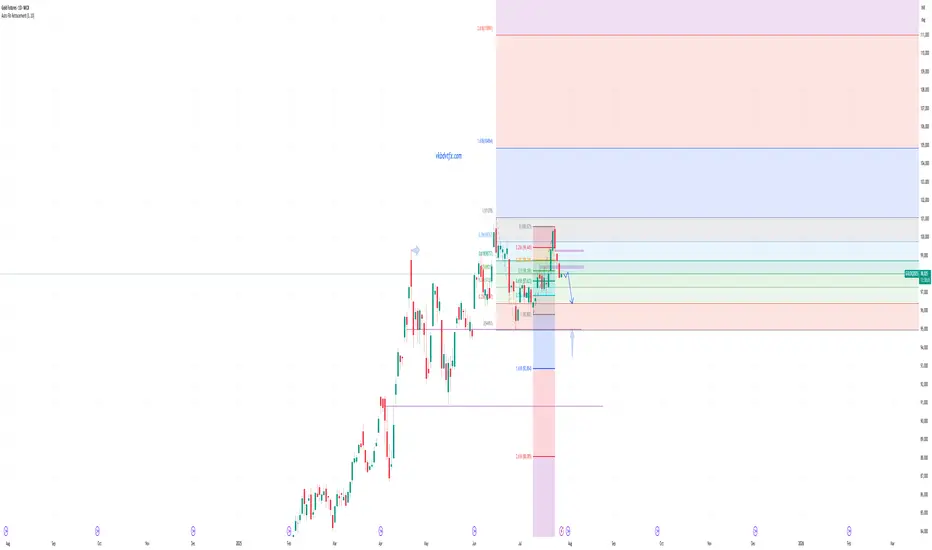
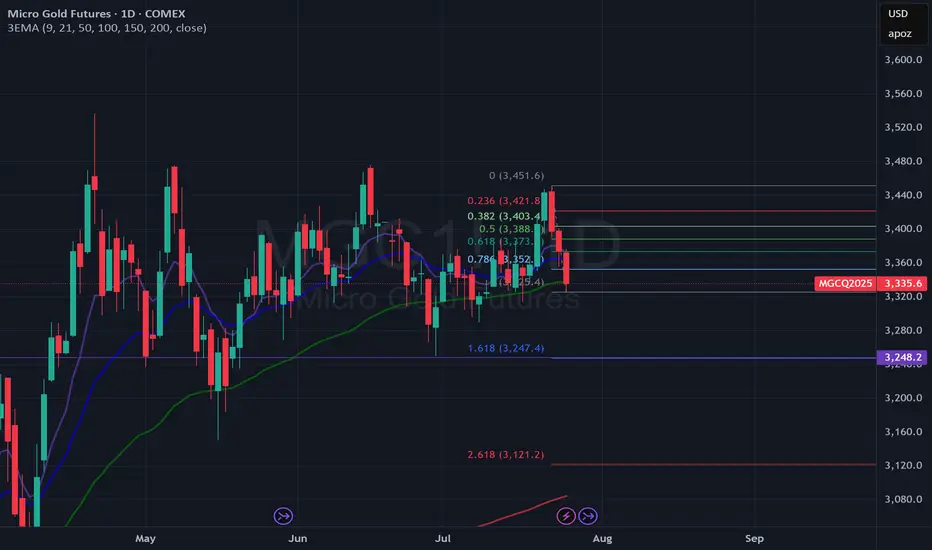
Near Term Bearish Development on Gold?The three bearish days in a row could be a potential near term bearish development on Gold. If a retest somewhere between 3370 and 3400 happens relatively soon and rejects it could potentially be in for a bearish extension. 3373 would be the 0.618 and 3388 would be the 0.5 retracement area. With a potential target down toward 3248 area
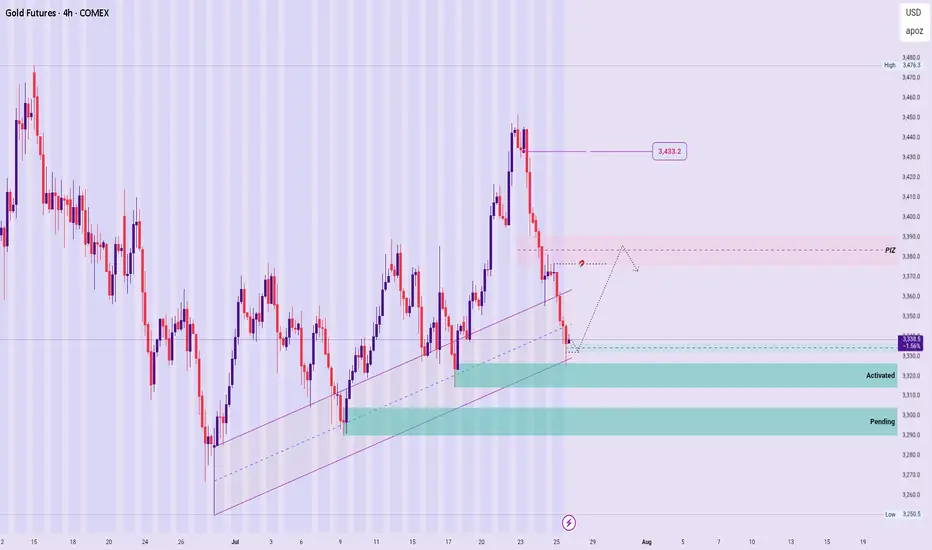
GOLD – New Week Technical Bias (Market Open)
Structural Outlook:
The broader bullish sequence remains valid, with no structural breach confirmed yet.
However, price is currently reacting at a sensitive level, warranting measured caution.
Zone Dynamics :
▪︎ A recently activated Rejection Zone is expected to support a gradual impulse toward the PIZ.
▪︎ From the PIZ, two scenarios unfold:
a. If it becomes a Price Base, we may see a continuation rally toward the 3433.2 region.
b. If the PIZ acts instead as a Price Cap, price may reject lower, targeting the pending Rejection Zone beneath or deeper, should the current zone fail to hold. Thereby presenting a Bearish structural formation.
Summary:
The directional bias remains bullish unless a clear Structure Breach (SB) occurs below key support levels.
Stay adaptive, and observe the PIZ reaction closely for directional confirmation.
🛑 Disclaimer:
This is not a trade signal. These are high-level technical insights meant for educational and analytical purposes. Always validate with your system and trade with discipline and risk awareness.
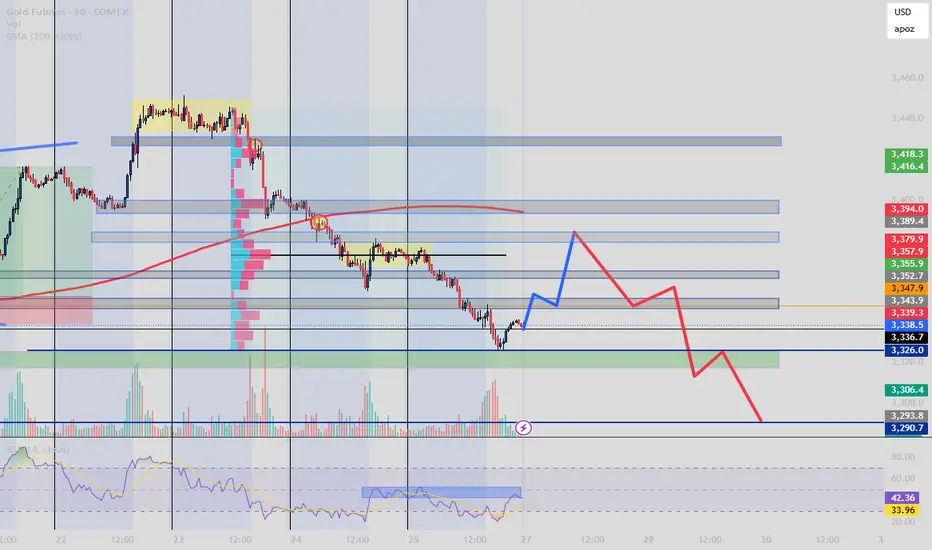
Gold Futures and the BOS Brearish Movement Steps In?After a clear break of structure and consistent rejection below the 209 EMA, price is retracing toward a key zone of confluence between 3347–3379.
This area aligns with:
Former demand turned supply (OB)
Volume cluster (high activity zone)
RSI hidden bearish divergence
Fair Value Gap (inefficiency fill target)
My expectation: a short-term bullish correction (blue) into that zone, followed by a high-probability sell-off (red) toward 3306–3290.
Bias : Bearish unless price reclaims 3394+
Strategy: Smart Money + Volume Profile + RSI Confirmation
Follow @GoldenZoneFX For more content and valuable insights.
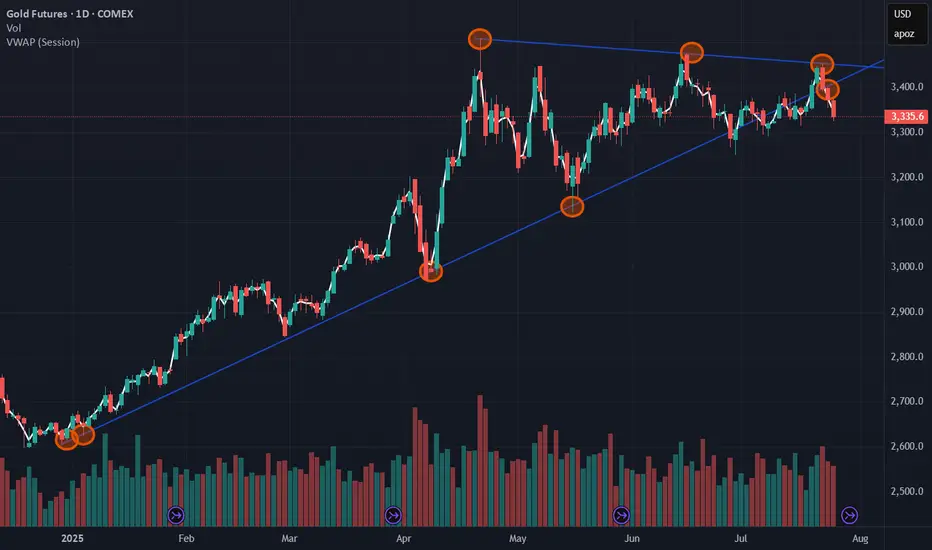
Is GC1! GOLD At A Turning Point - Idea On Short DirectionProbably Gold is not going to be cheaper in the near future but we have seen some points that hold in the past break recently...
This is a view on the Gold chart that is explanatory by itself.
Probably tracing some support horizontally under the price at key level with the idea of, if it break follow the trend in short direction side...
GOLD BULLISHHello,
Here's the gold analysis:
Gold will have started an upward trend with a good probability of 80%.

Gold to $3700 - $3800the price of gold has finally broken out of a long standing symmetrical triangle and an established 2 touch point trendline. It is currently consolidating above the broken trendline. If a 4H candle closes above the red dotted trend line we could see a massive pump up. If price closes below green upwards trendline then strategy is invalidated and reassessment needed. This is a long hold trade idea

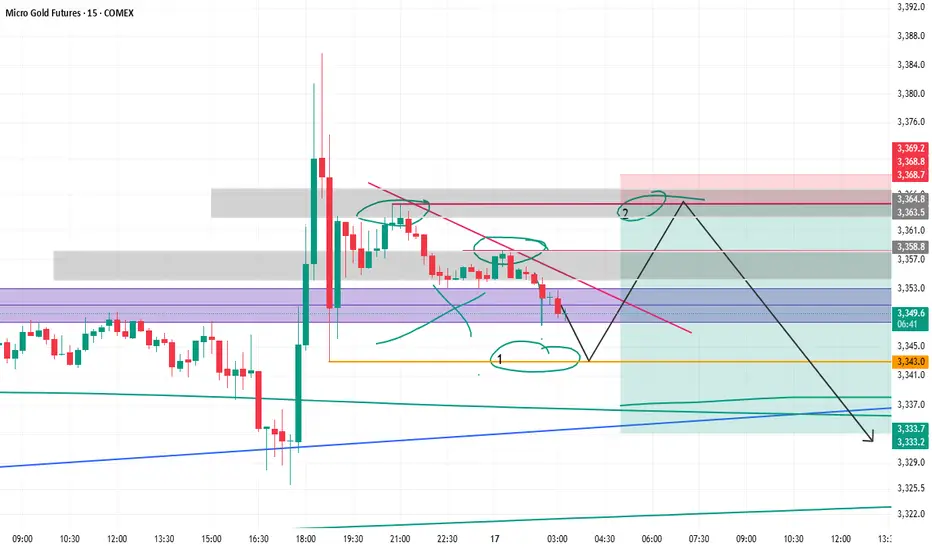
Gold short Read this clearly, my confidence in this trade is 3 out of 10.
Use very small size on this trade, as iam not sure at all that this is even the right thing to do.
The chart is messy, and there is consolidation is going on.
if the price didnt make it to nr 1 circle, dont worry about it. The most important thing is the close below the FVG.
Also confirm on lower time frame to see how the price reacts to the entry levels. If anything is going to happen, is going to happen at those levels.
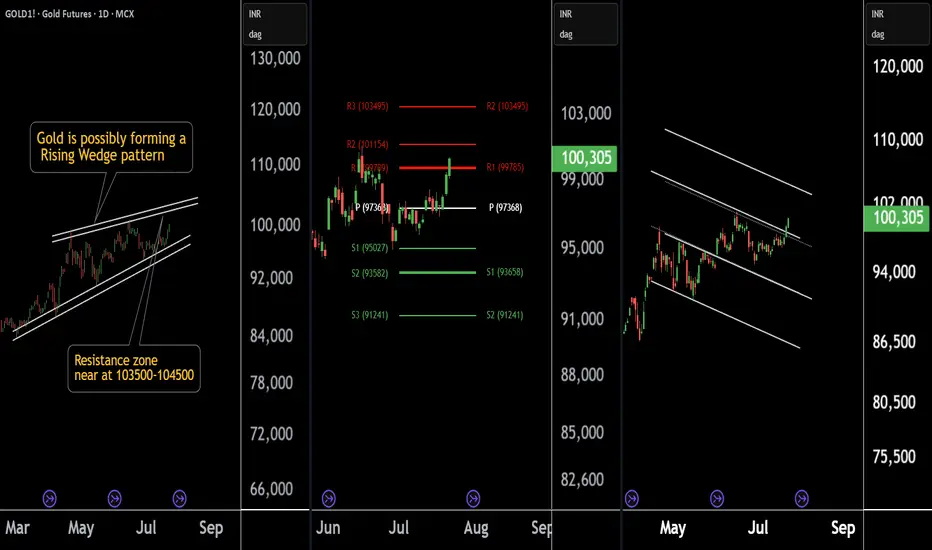
Gold at a Crossroad: Long or Short? Key Levels in FocusThere are three chart of Gold .
Gold1! is forming a Rising Wedge pattern, with resistance positioned between 103500-104000 levels.
Gold1! is facing Pivot Point resistance around the 103500 level, indicating potential supply pressure.
Gold1! is approaching the parallel channel resistance, and the upside move is nearly complete in percentage terms, with resistance around 103800-104000.
if this level sustain then we may see first of all higher prices then again fall in gold1!
Thank You !!
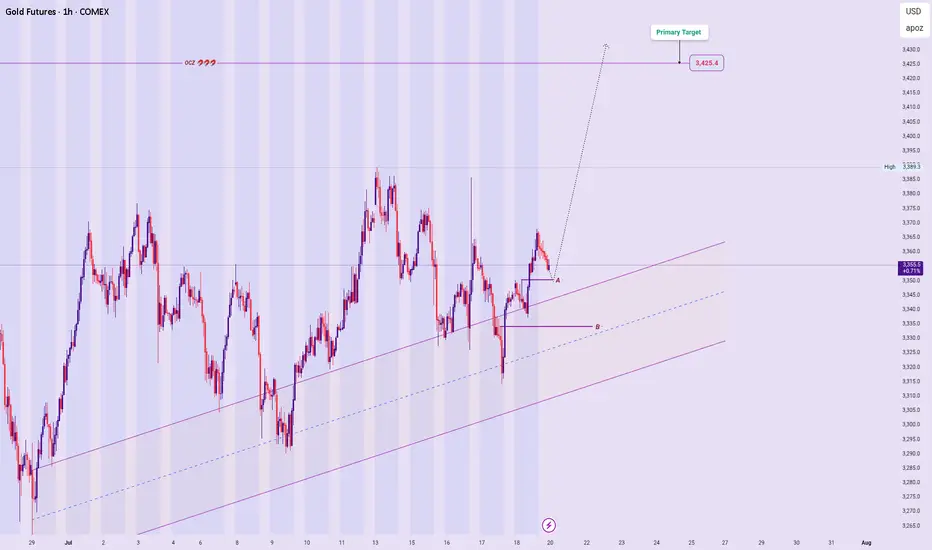
XAUUSD – New Week Technical Bias (Market Open)
Bias Overview:
Current outlook remains aligned with previous bullish analysis, supported by the broader Ascend Sequence on higher timeframes.
Price Expectations:
Anticipating a micro decline toward Price Zone A as a potential springboard for a bullish continuation.
While less likely, a deeper pullback into Price Zone B may occur before the rally unfolds — still within acceptable structure for HTF bullish intent.
Execution:
Will rely on micro-timeframe confirmations and reaction behavior within these zones to finalize entry decisions following market open.
Invalidation will be break and bearish structure below the ascending sequence Channel.
Summary:
Maintaining bullish bias while awaiting refined entry opportunities at defined price zones. Structural invalidation remains below key support and Sequence Line levels.
[b ]🔒 Disclaimer:
This analysis is for educational and strategic insight purposes only. It is not financial advice. Always manage your own risk and confirm with your personal trading plan before executing trades.
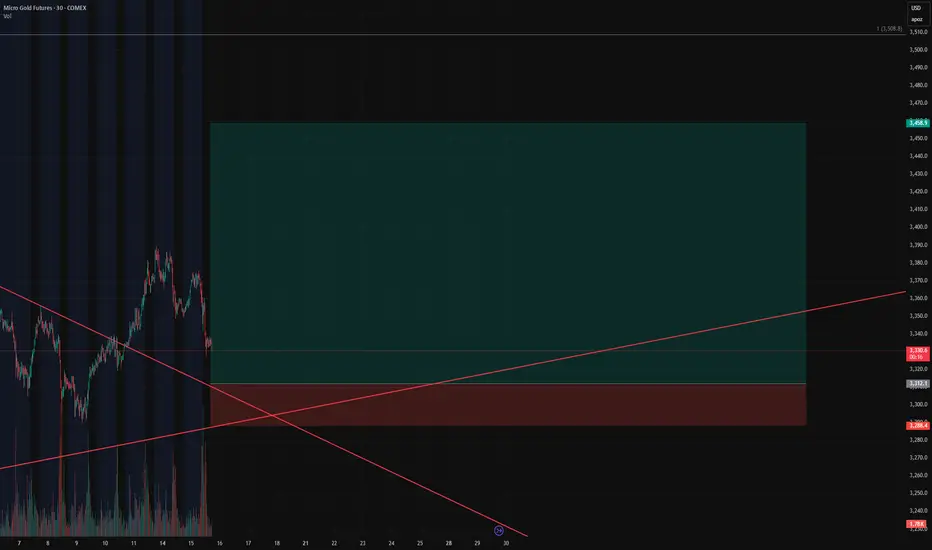
Gold Bulls Loading Up – Our Short Squeeze Trigger is Set!🚨 Gold Bulls Loading Up – Our Short Squeeze Trigger is Set!
We’re flipping the script on COMEX_MINI:MGC1! After a prolonged downtrend and textbook wedge compression, our breakout long is LIVE – but not without trapping the late shorts first.
💥 Entry: $3,312.1
🛑 Stop: $3,288.4
🎯 Target: $3,458.9
🧮 Risk/Reward: 6.19
Price just bounced at the retest of the wedge apex, and volume is confirming the move. If this holds, we’re riding momentum all the way up – and letting short pressure fuel the breakout.
📈 Trendline breached.
⏳ Time compression converging.
⚠️ If you’re still short, watch your stops!
GOLD BULISHHello, I hope you are well today. Gold will likely rise. I advise you to buy into your positions.
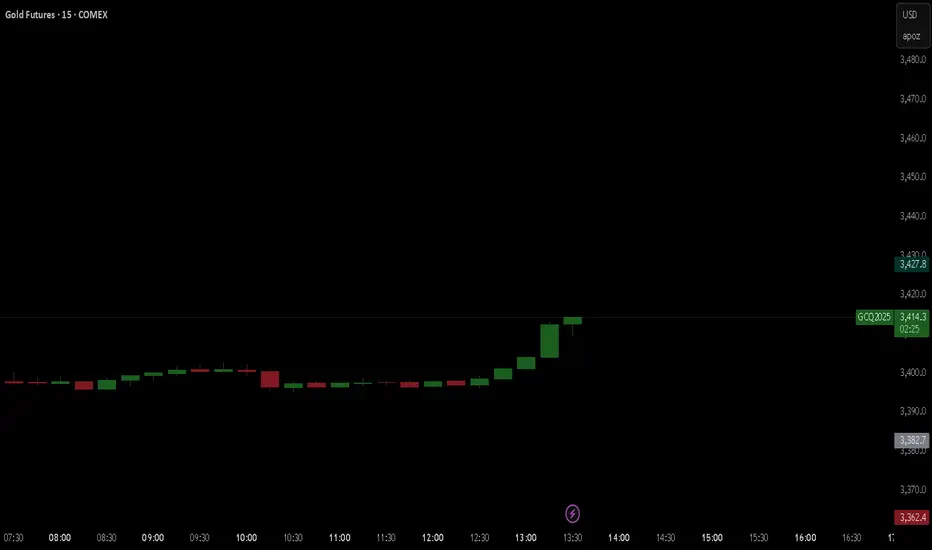
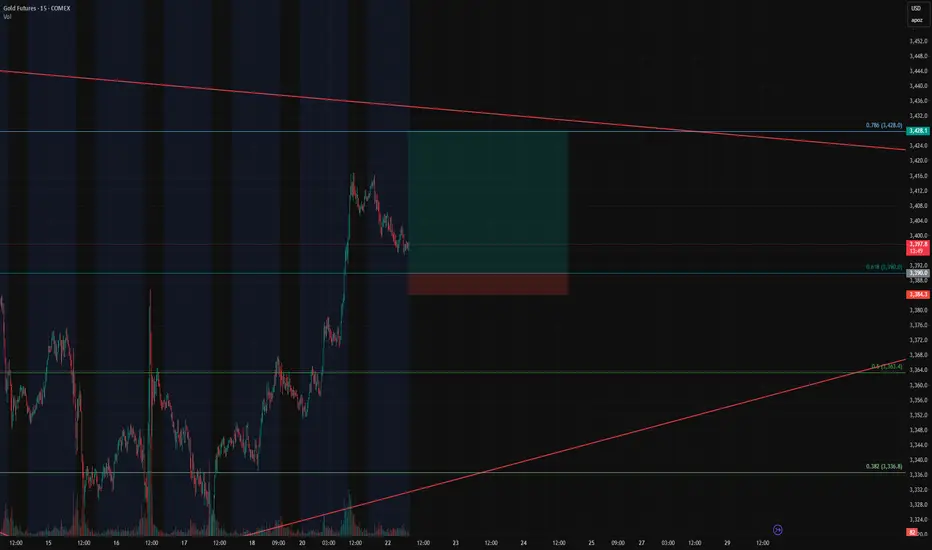
Gold Futures Long Setup – Breakout Continuation off the 0.618 FiGold Futures Long Setup – Breakout Continuation off the 0.618 Fib
Instrument: Gold Futures – COMEX ( COMEX:GC1! )
Timeframe: 15-Minute
Trade Type: Long – Breakout Continuation
Entry Zone: 3390 (0.618 Fibonacci retracement)
Take Profit: 3428 (0.786 Fib)
Stop Loss: 3384
Risk/Reward Ratio: 6.68
Setup: Bullish Flag on Retest
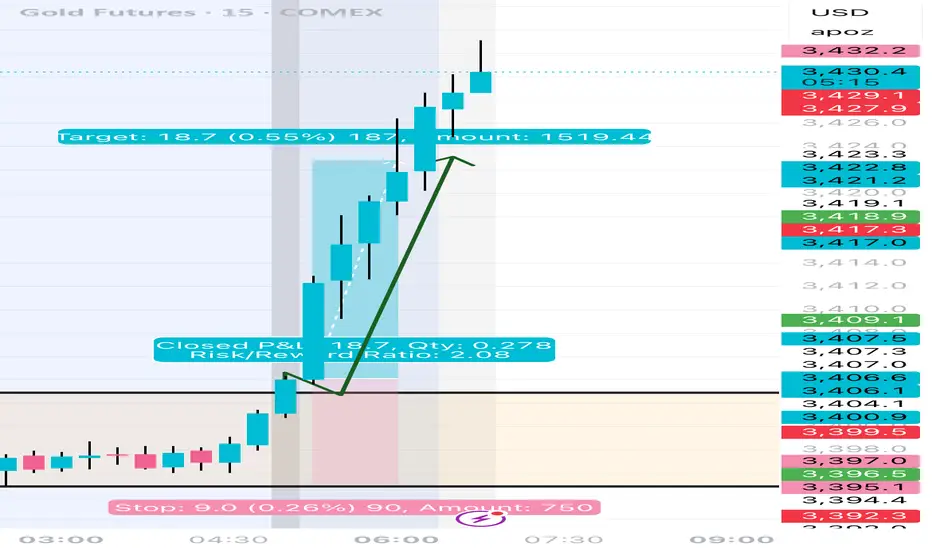
🔍 Trade Thesis
This trade is part of an ongoing breakout continuation strategy we've been trading, and now we're eyeing a pullback entry as price returns to a key retracement level.
Price nearly exploded through the 0.618 Fibonacci level (3390) during the prior breakout.
Now it's pulling back in a textbook bullish flag formation, suggesting healthy consolidation before the next leg.
The 0.618 retracement is aligning with previous intraday structure and trendline support — making this an ideal level to scale in.
This is a high R:R continuation play, with targets set at the 0.786 Fib level (3428) — right before macro resistance kicks in.
🎯 Entry & Exit Strategy
Entry: As price touches 3390 or forms bullish confirmation at the level.
Stop Loss: 3384 – tight and below key fib/flag structure.
Target: 3428 – based on 0.786 Fib extension and breakout continuation projection.
📊 Why This Works
Breakout behavior: Price respected the breakout impulse and retraced cleanly into a bull flag.
Fib confluence: 0.618 pullbacks are a classic entry in trending markets.
R/R of 6.68: Excellent reward profile vs. limited risk.
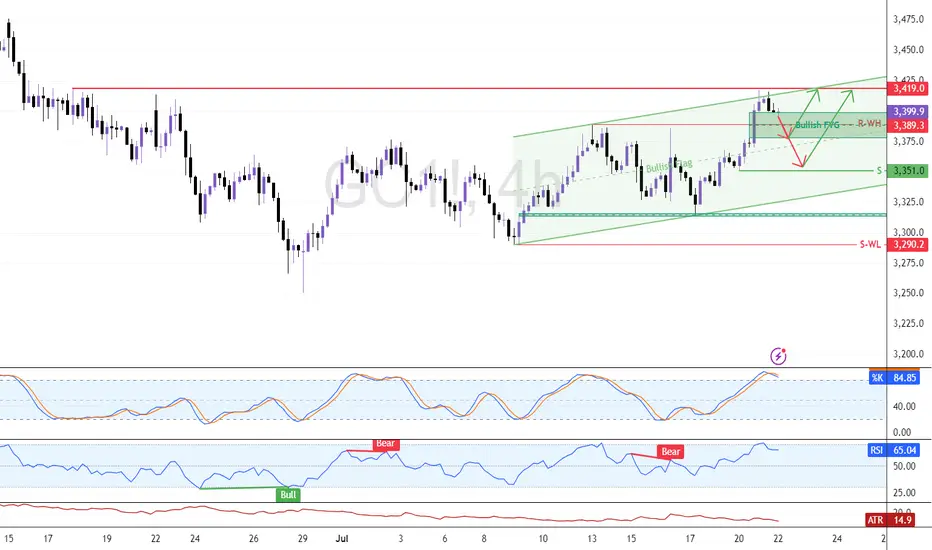
Eye These Levels to Go Long On GoldFenzoFx—Gold remains bullish but eased at $3,419.0 resistance. The Stochastic at 85.0 suggests a pullback may follow. Traders can watch support at $3,389.0 for short-term scalping.
Swing entries may emerge near $3,351.0 if bullish signals appear, such as candlestick patterns, structure breaks, or fair value gaps. Updates will follow if price reacts to these levels.
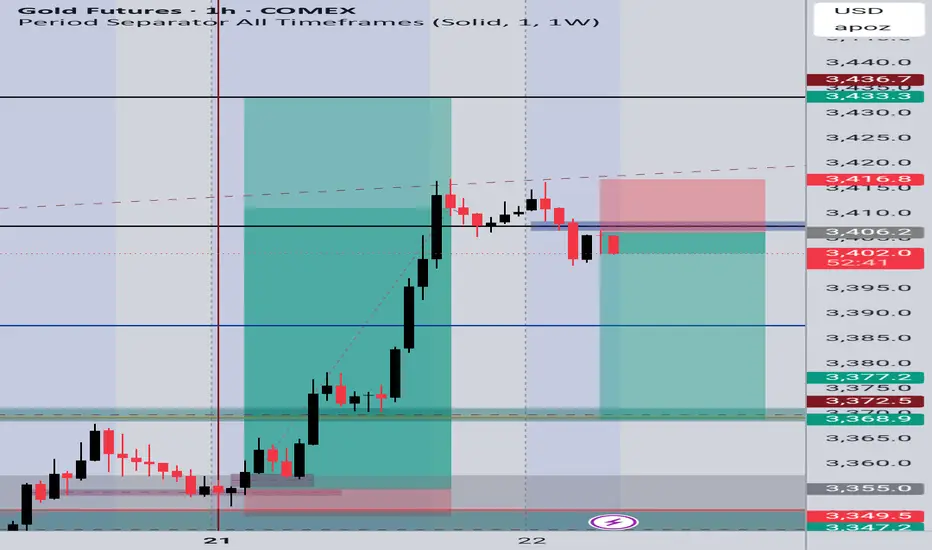
Gold Futures (GC1!)Gold Futures (GC1!) 1H – Bearish Rejection Setup
Price showed a strong bullish impulse followed by a rejection near the 3,416 resistance zone, forming a lower high and signaling potential exhaustion of buyers. After grabbing liquidity above the previous high, it failed to hold above the zone and retraced back below a key structure level around 3,406.
This setup aligns with a classic breakout and retest, now acting as resistance. I entered a short position after confirmation of bearish price action, targeting the demand zone around 3,372–3,368. Stop loss is placed just above the high at 3,416.8.