MDTUSDT Forming Descending TriangleMDTUSDT is currently forming a classic descending triangle pattern, which is typically a continuation pattern suggesting potential for a strong move once a breakout occurs. The price structure is showing repeated lower highs while maintaining a relatively stable support level, indicating pressure is
Related pairs
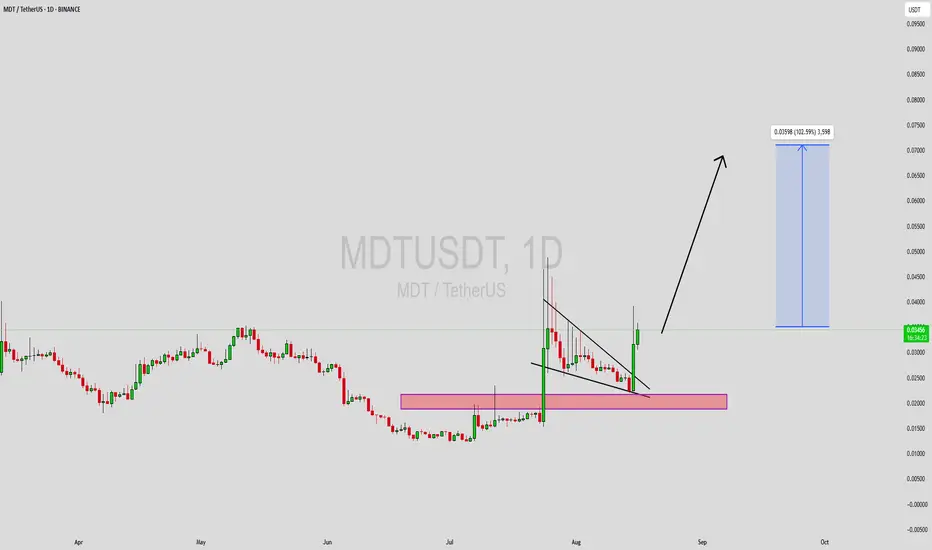
MDT (SPOT)BINANCE:MDTUSDT
#MDT/ USDT
Entry range (0.01950- 0.02250)
SL 1D close below 0.01870
T1 0.03500
T2 0.05500
_______________________________________________________
Golden Advices.
********************
* collect the coin slowly in the entry range.
* Please calculate your losses before the entry.

MDTUSDTFall down and hit down trend, maybe go for a growth!
But i think it will continue to fall than till the bo!
After hit the bo, will start a growth!
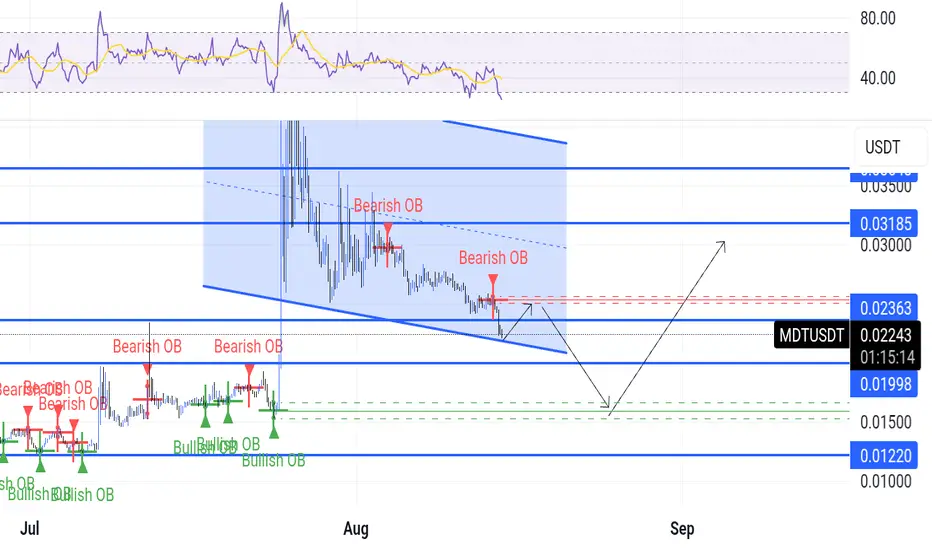
MDT / UsdtBINANCE:MDTUSDT
Just do it. Need to hold that area or we will .........
Disclaimer : Not Financial advice

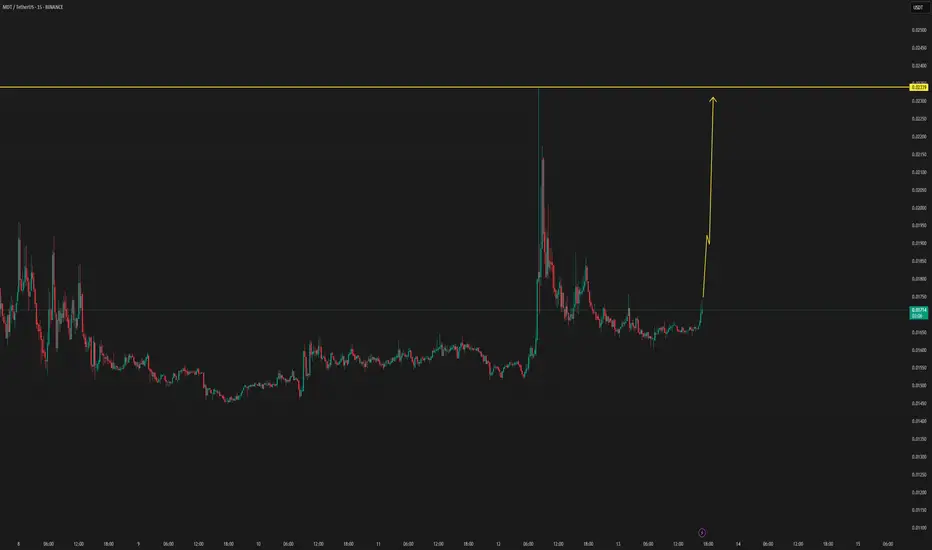
MDTUSDTI only publish this to show when every one on yester day wad hopeless i said be calm and groth will start soon😉😉

MDT (SPOT)BINANCE:MDTUSDT
#MDT/ USDT
Entry range (0.01350- 0.01480)
SL 4H close below 0.01251
T1 0.01900
T2 0.02200
T3 0.02438
_______________________________________________________
Golden Advices.
********************
* collect the coin slowly in the entry range.
* Please calculate your losses before t

MDTUSDT Forming Bullish WaveMDTUSDT is currently forming a bullish wave pattern, indicating a strong potential for continued upward momentum. This wave structure reflects healthy market cycles, with higher highs and higher lows suggesting that bulls are steadily gaining control. As this wave pattern matures, the current market

MDT (Measurable Data Token) 25 million lowcapMDT (Measurable Data Token)
trading at $0.036
mcap 25 million
all time high $0.8
27x profit to ath
rsi = avg bullish
macd = avg
project info
Measurable Data Token (MDT) is a decentralized data exchange ecosystem connecting users, data providers, and data buyers and denominates the value of data

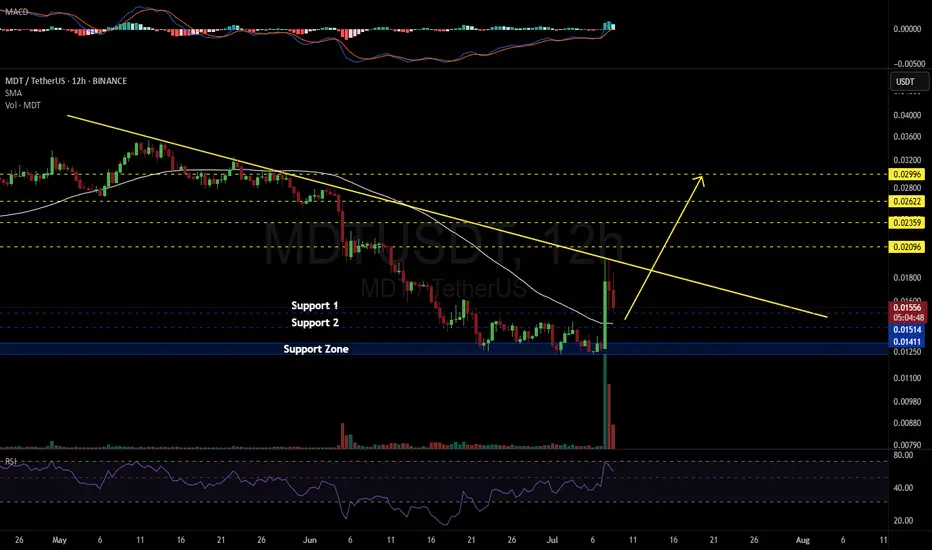
MDT NEW INCREASE VOLUMEMDT/USDT has new volume upcoming, which can be confirmed in the coming time frames. by new confirmations, the update will be followed below.
MDTUSDT 12H#MDT is currently holding Support 1 — consider buying a bag of it.
If it loses Support 1, enter gradually at the other support levels marked on the chart.
The 12H SMA50, which roughly aligns with Support 2, is a strong support zone.
In case of a breakout above the descending resistance, the targets
See all ideas
Summarizing what the indicators are suggesting.
Oscillators
Neutral
SellBuy
Strong sellStrong buy
Strong sellSellNeutralBuyStrong buy
Oscillators
Neutral
SellBuy
Strong sellStrong buy
Strong sellSellNeutralBuyStrong buy
Summary
Neutral
SellBuy
Strong sellStrong buy
Strong sellSellNeutralBuyStrong buy
Summary
Neutral
SellBuy
Strong sellStrong buy
Strong sellSellNeutralBuyStrong buy
Summary
Neutral
SellBuy
Strong sellStrong buy
Strong sellSellNeutralBuyStrong buy
Moving Averages
Neutral
SellBuy
Strong sellStrong buy
Strong sellSellNeutralBuyStrong buy
Moving Averages
Neutral
SellBuy
Strong sellStrong buy
Strong sellSellNeutralBuyStrong buy
Displays a symbol's price movements over previous years to identify recurring trends.
Frequently Asked Questions
The current price of MDT / TetherUS (MDT) is 0.02890 USDT — it has fallen −1.06% in the past 24 hours. Try placing this info into the context by checking out what coins are also gaining and losing at the moment and seeing MDT price chart.
MDT / TetherUS price has fallen by −8.75% over the last week, its month performance shows a 76.25% increase, and as for the last year, MDT / TetherUS has decreased by −38.31%. See more dynamics on MDT price chart.
Keep track of coins' changes with our Crypto Coins Heatmap.
Keep track of coins' changes with our Crypto Coins Heatmap.
MDT / TetherUS (MDT) reached its highest price on Dec 25, 2021 — it amounted to 0.17888 USDT. Find more insights on the MDT price chart.
See the list of crypto gainers and choose what best fits your strategy.
See the list of crypto gainers and choose what best fits your strategy.
MDT / TetherUS (MDT) reached the lowest price of 0.00788 USDT on Jun 11, 2020. View more MDT / TetherUS dynamics on the price chart.
See the list of crypto losers to find unexpected opportunities.
See the list of crypto losers to find unexpected opportunities.
The safest choice when buying MDT is to go to a well-known crypto exchange. Some of the popular names are Binance, Coinbase, Kraken. But you'll have to find a reliable broker and create an account first. You can trade MDT right from TradingView charts — just choose a broker and connect to your account.
Crypto markets are famous for their volatility, so one should study all the available stats before adding crypto assets to their portfolio. Very often it's technical analysis that comes in handy. We prepared technical ratings for MDT / TetherUS (MDT): today its technical analysis shows the buy signal, and according to the 1 week rating MDT shows the neutral signal. And you'd better dig deeper and study 1 month rating too — it's sell. Find inspiration in MDT / TetherUS trading ideas and keep track of what's moving crypto markets with our crypto news feed.
MDT / TetherUS (MDT) is just as reliable as any other crypto asset — this corner of the world market is highly volatile. Today, for instance, MDT / TetherUS is estimated as 2.78% volatile. The only thing it means is that you must prepare and examine all available information before making a decision. And if you're not sure about MDT / TetherUS, you can find more inspiration in our curated watchlists.
You can discuss MDT / TetherUS (MDT) with other users in our public chats, Minds or in the comments to Ideas.