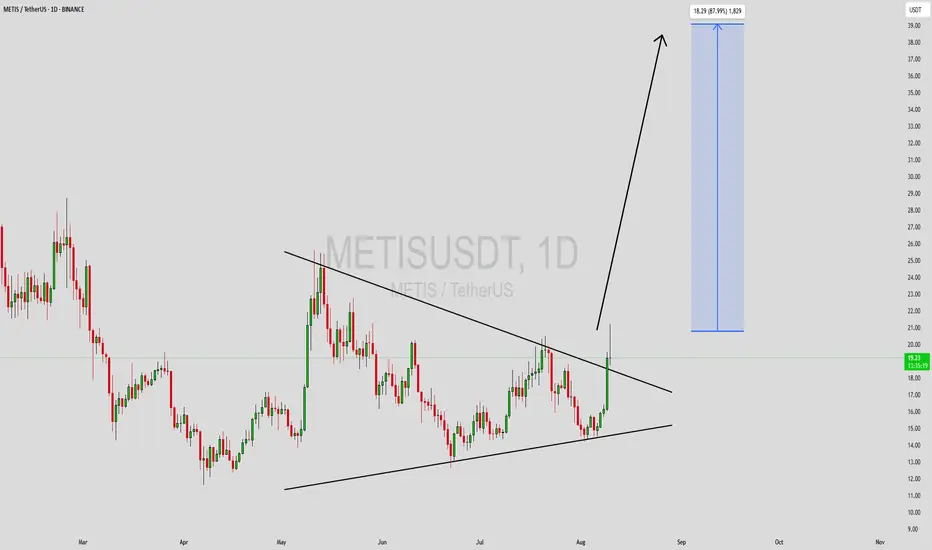
METISUSDT Forming Falling WedgeMETISUSDT is forming a well-defined falling wedge pattern, a classic bullish reversal setup indicating the downtrend may be nearing exhaustion. Price action has narrowed between descending support and resistance lines, signaling that selling pressure is fading and key levels are being defended by accumulation. When combined with solid trade volume, this setup points toward high probability upside.
Volume remains consistently strong, reflecting growing investor interest as the structure evolves. This accumulation behavior at lower levels is a telltale sign that market participants are positioning for a breakout. Should price pierce the upper wedge trendline with conviction, the expected move aligns well with the projected 70% to 80%+ rally, making it a compelling scenario for breakout-focused traders.
Investor sentiment around Metis is steadily improving, supported by broader awareness of its Layer-2 scaling solutions and active development roadmap. This renewed enthusiasm enhances the technical case and may provide momentum if the breakout occurs. Traders looking for high reward setups are especially attentive to the confirmation signals.
A confirmed breakout above the wedge resistance with sustained volume could mark the beginning of a strong trend reversal. If you’re watching for an attractive risk-to-reward opportunity backed by both chart structure and market interest, METISUSDT deserves a spot on your radar.
✅ Show your support by hitting the like button and
✅ Leaving a comment below! (What is You opinion about this Coin)
Your feedback and engagement keep me inspired to share more insightful market analysis with you!
METISUSDT trade ideas
METISUSDT 1W AnalysisMETIS ~ 1W Analysis
#METIS Buy back gradually from here if you still have confidence in this coin with a short term target of at least 20%+ from here.

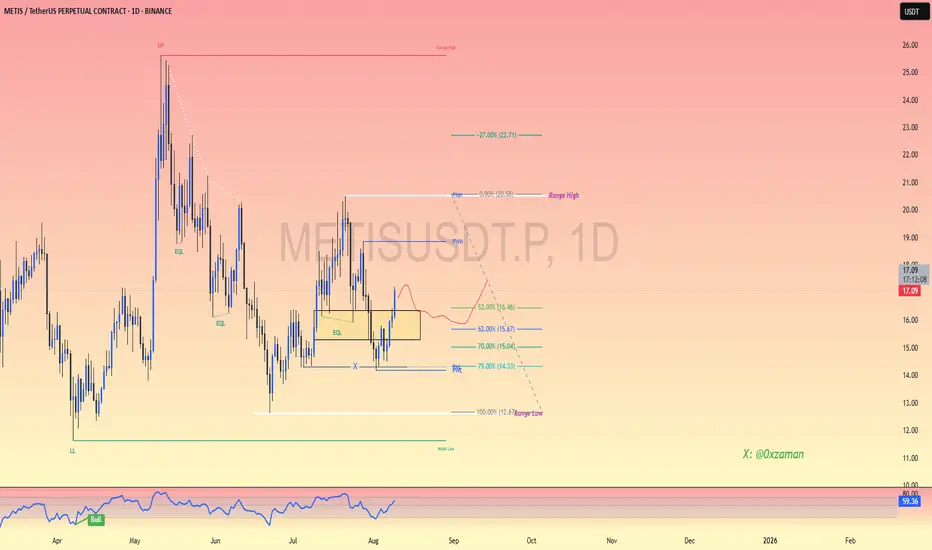
Is $METISUSDT ready to move ??Following a breakout and retest of a resistance zone and now turning it to a support zone. BINANCE:METISUSDT seems to be ready for some bullish moves. So be on the look out as the expected targets are marked out already.
Kindly support this analysis to enable it reach to other people, and do comment your thoughts.

$METIS Breakout Complete – Retest in Progress!!SEED_DONKEYDAN_MARKET_CAP:METIS just completed a massive breakout and is now cooling off!
The downtrend is now over. The price broke through resistance and is currently re-testing important levels.
Two clear scenarios from here:
A bounce at the $21 level will initiate the next wave up.
A dip at $18–19 will provide a golden entry before a strong rally next.
Focusing on $25+ soon with increasing momentum.
The staging is tidy and the repositioning is only just starting.
DYOR, NFA

METIS Successfully breakout this resistant lineSuccessfully breakout this resistant line with a short -term target of at least 10%+.

Metisusdt buying opportunityMETISUSDT is consolidating within a long-term symmetrical triangle, with price currently testing a key demand zone around $23.00, a historically reactive level aligning with trendline support. Multiple liquidity taps at this area indicate strong accumulation interest, reinforced by RSI bouncing off historical oversold conditions.
This presents a high-probability buying opportunity, as a sustained hold above this level could initiate a reversal. A breakout above the triangle’s upper boundary, currently near $47.00, would confirm bullish continuation, opening the path for the mid-term target at $322.85. The measured move projection from the triangle pattern suggests a full upside extension towards the $6,774.72 final target.
However, invalidation occurs if price breaks below $10.61, which would shift the bias toward deeper price discovery.

METIS LONGS /INVERSION📊 15-Minute Chart Analysis (METISUSDT.P) 🔍
Key Zones:
Liquidity Cluster (Left Side): Potential accumulation zone before price reversal.
Fair Value Gap (FVG): Marked in blue, indicating an area of imbalance that may act as a demand zone.
Fibonacci Levels:
0.618 (15.55)
0.786 (15.67) (Potential resistance or liquidity grab area)
Market Structure:
Recent Downtrend: Price formed a lower high before continuing downward.
Potential Reversal: If price taps into the FVG (~15.10) and holds, a move towards 15.65–15.83 is possible.
Trade Idea:
Bullish Scenario: Price rejects the FVG zone, breaking back above 15.55, targeting 15.67–15.83.
Bearish Risk: A break below the FVG could signal further downside.
#KAT3

METISUSDT UPDATEMETISUSDT is a cryptocurrency trading at $17.57. Its target price is $32.00, indicating a potential 80%+ gain. The pattern is a Bullish Falling Wedge, a reversal pattern signaling a trend change. This pattern suggests the downward trend may be ending. A breakout from the wedge could lead to a strong upward move. The Bullish Falling Wedge is a positive signal, indicating a potential price surge. Investors are optimistic about METISUSDT's future performance. The current price may be a buying opportunity. Reaching the target price would result in significant returns. METISUSDT is poised for a potential breakout and substantial gains.

#METIS/USDT#METIS
The price is moving within a descending channel on the 1-hour frame, adhering well to it, and is heading for a strong breakout and retest.
We are seeing a bounce from the lower boundary of the descending channel, this support at 14.73.
We have a downtrend on the RSI indicator that is about to be broken and retested, supporting the upward trend.
We are looking for stability above the 100 moving average.
Entry price: 18
First target: 19.78
Second target: 22
Third target: 25

METISUSDT 1WMETIS ~ 1W Analysis
#METIS Buy gradually from here with a short -term target of at least 20%+. This is the lowest support for now.

METIS Rebuy Setup (2D)The METIS token, after experiencing significant drops, is approaching a strong support level.
We are looking for buy/long positions within the green zone.
A daily candle closing below the invalidation level will invalidate this analysis.
Do not enter the position without capital management and stop setting
Comment if you have any questions
thank you

SPOT METIS LONG 5.03.2025Pinning after exhaustion of sales.
💰I enter at the market price.
I'll let you know when I record it manually.
‼️Risk per trade: 1% of the allocated funds for spot trading.
Thank you!


METISlooks like alts are trying to wake up
same is Metis doing, trying to break the downtrend
lets see what will happen till the end of this month, will this try to gain power and give some profits...?

SPOT METIS LONG 11.02.2025Pinning after abnormal purchases.
💰I enter at the market price.
🔏The trade be closed manually or with a limit order by:
31.01
I'll let you know when I record it manually.
‼️Risk per trade: 1% of the allocated funds for spot trading.
Thank you!

METIS/USDT | 1W🩸 SEED_DONKEYDAN_MARKET_CAP:METIS ⁀➷
#MetisL2. Macro chart Another
💯 Intermediate Target - $160
🚩 Macro Target 1 - $250
🚩 Macro Target 2 - $460
🚩 Macro Target 3 - $780
- Not financial advice, trade with caution.
#Crypto #Metis #METIS #Investment #L1
✅ Stay updated on market news and developments that may influence the price of Metis. Positive or negative news can significantly impact the cryptocurrency's value.
✅ Exercise patience and discipline when executing your trading plan. Avoid making impulsive decisions driven by emotions, and adhere to your strategy even during periods of market volatility.
✅ Remember that trading always involves risk, and there are no guarantees of profit. Conduct thorough research, analyze market conditions, and be prepared for various scenarios. Trade only with funds you can afford to lose and avoid excessive risk-taking.

MetisIt seems that the Metis has completed a bowtie diametrical and if it breaks $40, this pattern will be confirmed. After this pattern, we expect the currency to grow to $100.

SPOT METIS LONG 20.01.2025Pinning after buyout of correction.
🎯Purpose:
56.14
I'll let you know when I record it manually.
‼️Risk per trade: 1% of the allocated funds for spot trading.
Thank you for follow and the reaction🚀.

METISUSDT 4DMETIS ~ 4D
#METIS So far it still maintains this support block,. If you still have Conviction on this coin,. Buy from here with a minimum target of 20%+

Metisusdt Buy opportunityMETISUSDT reversed strongly from a critical demand zone, completing impulsive wave (i) of larger wave 3, followed by a correction forming subwave (ii) of 3. Currently, the price is progressing into subwave (iii) of 3. The plan is to buy within the designated buyback zone and patiently hold as the setup unfolds. Target levels are marked on the chart, with further updates to follow as the structure develops.

METIS I view this as a diagonal move. As long as it remains above the pink support, the upcoming targets show a high potential win rate.

Wave 3I expected the downward trend to continue until the lower yellow box, which corresponds to the levels of 0.707 and 0.786. Now it is possible that wave 3 will move up to the yellow box at least until the box comes.
