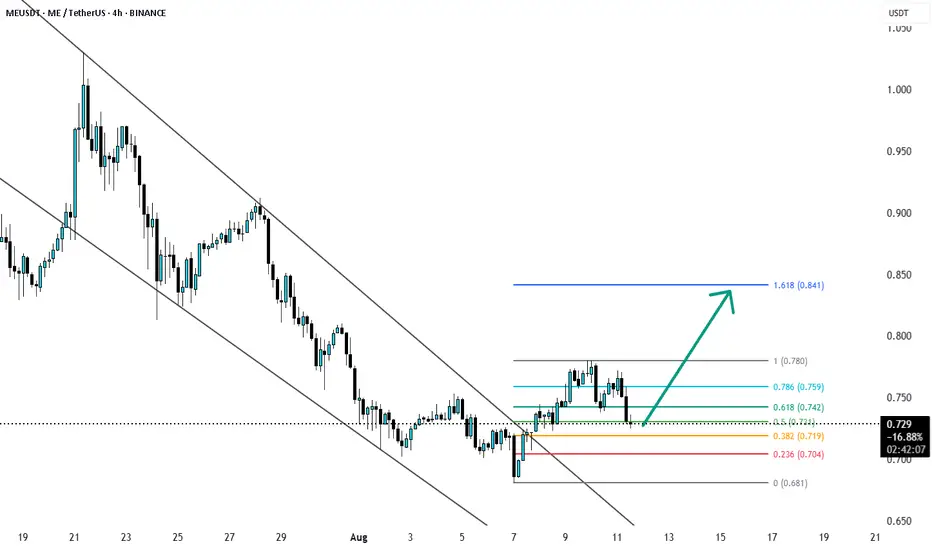
MEUSDT at Fib 0.5_0.392 support MEUSDT has reached the Fibonacci 0.5 and 0.382 levels. From here, the bullish trend may resume toward the 0.81–0.85 range. Recently, it broke out of the bullish wedge, and the price moved as predicted. As part of the correction, the price has now bounced from this area.
ME/USDT (2D) — Last Stand at the Support Zone!ME/USDT is now at a make-or-break moment. After a prolonged downtrend since the start of the year, price action has formed a Descending Triangle — a combination of a falling trendline pressing down from above and a strong horizontal support between 0.65 – 0.85 USDT.
📌 Why this zone matters:
This y

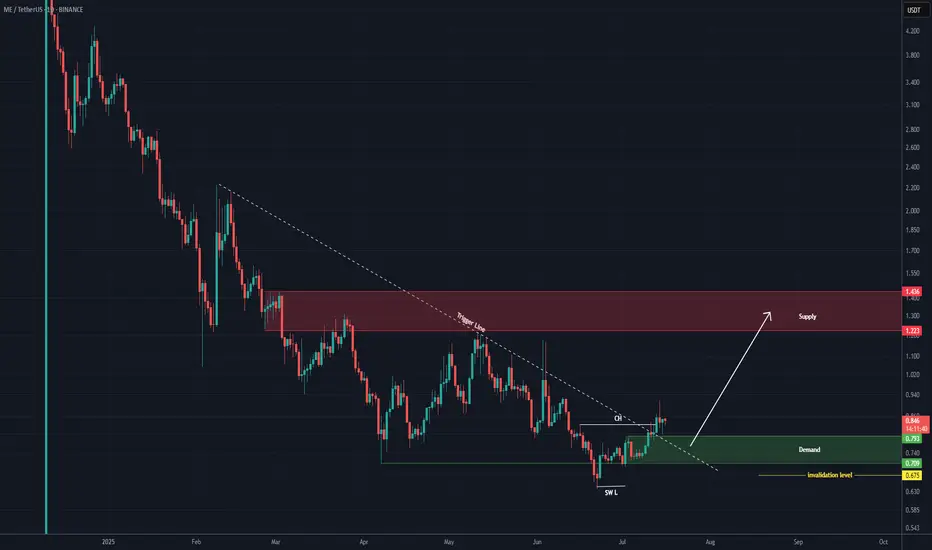
ME Analysis (1D)After holding above the support zone, we have a bullish Change of Character (CH) on the chart, which is a bullish sign. Additionally, the trigger line has been broken.
After a slight pullback, the price may move toward the targets.
The targets are marked on the chart.
A daily candle closing below
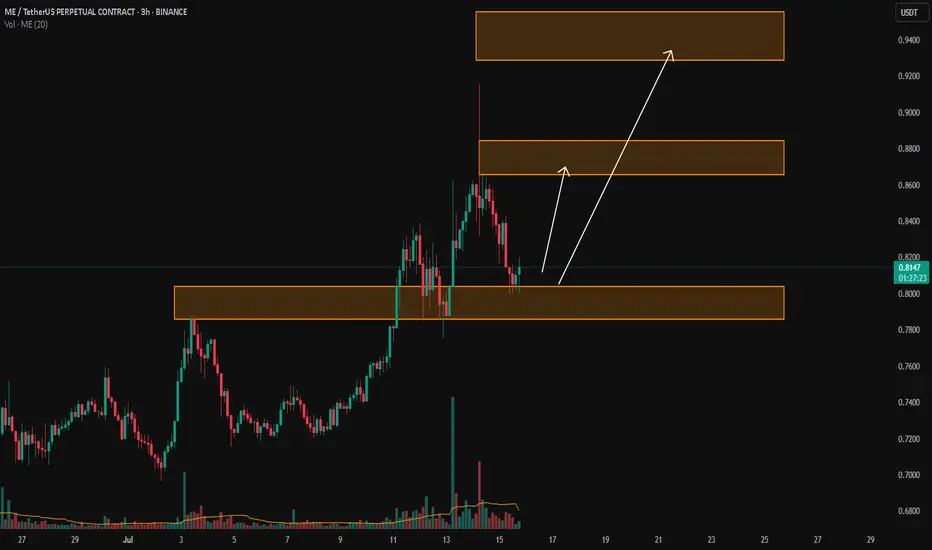
ME/USDTKey Level Zone: 0.7860 - 0.8040
LMT v2.0 detected.
The setup looks promising—price previously trended upward with rising volume and momentum, then retested this zone cleanly. This presents an excellent reward-to-risk opportunity if momentum continues to align.
Introducing LMT (Levels & Momentum Tr
ME/USDT 300%!!!ME/USDT is showing signs of strength after a classic liquidity sweep below the $0.75 zone, which flushed out weak hands and provided a clean setup for a potential trend reversal. Price has now reclaimed the $0.80 level, a key support/resistance flip zone, signaling growing buyer confidence.

MEUSDT 1D AnalysisME ~ 1D Analysis
#ME This trade is very high risk
Buy gradually from here with a short term target of at least 15%+ from here.

Magic Eden’s ME Token Eyes Bounce After Trump Wallet VolatilityOn June 3, , Magic Eden ( BINANCE:MEUSDT ) announced a collaboration with a project called to launch a new" Trump Wallet "
This announcement triggered a + 35% price increase , pushing the price of ME Token to approximately $1.17 .
However, shortly afterward, members of the Trump family, inclu

Me !!!The price on the daily timeframe is within a triangle, which can create some uncertainty about which direction it will move. Here, we should wait to see which side of the triangle the price breaks out from. Remember, the trend is our friend.
Best regards CobraVanguard.💚

ME Likely to Revisit 1.415 ZoneBased on the MissedPrice concept, rapid price moves often skip levels that price later revisits. The 1.415 level shows an Open Interest leap, suggesting missed positions.

MEUSDT 1D AnalysisME ~ 1D Analysis
#ME This trade is very high risk
Buy from here if you still have a Conviction on this coin with a short -term target of at least 10%+.

See all ideas
Summarizing what the indicators are suggesting.
Oscillators
Neutral
SellBuy
Strong sellStrong buy
Strong sellSellNeutralBuyStrong buy
Oscillators
Neutral
SellBuy
Strong sellStrong buy
Strong sellSellNeutralBuyStrong buy
Summary
Neutral
SellBuy
Strong sellStrong buy
Strong sellSellNeutralBuyStrong buy
Summary
Neutral
SellBuy
Strong sellStrong buy
Strong sellSellNeutralBuyStrong buy
Summary
Neutral
SellBuy
Strong sellStrong buy
Strong sellSellNeutralBuyStrong buy
Moving Averages
Neutral
SellBuy
Strong sellStrong buy
Strong sellSellNeutralBuyStrong buy
Moving Averages
Neutral
SellBuy
Strong sellStrong buy
Strong sellSellNeutralBuyStrong buy
Displays a symbol's price movements over previous years to identify recurring trends.