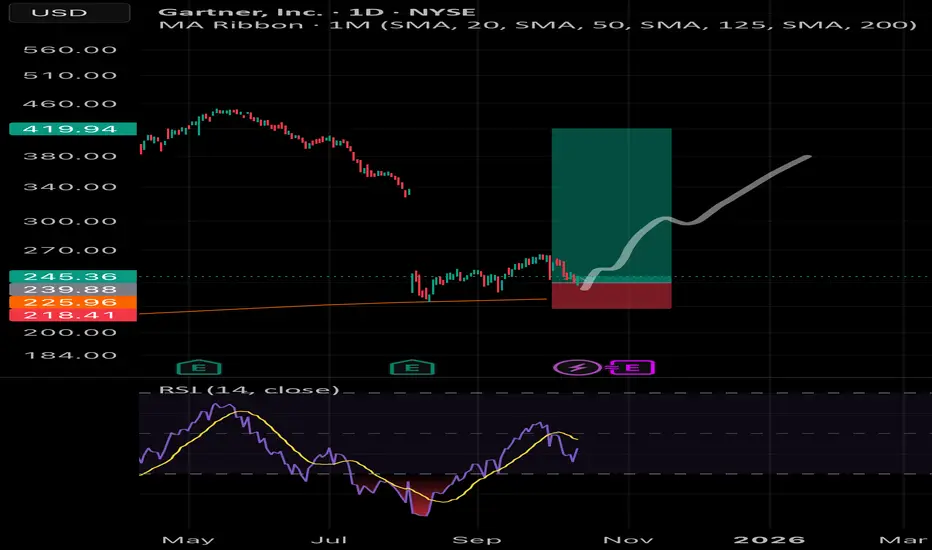
Gartner | IT | Long at $240.25Technical Analysis
The stock price for Gartner NYSE:IT recently fell below my selected "crash" simple moving average zone (green lines) and touched off the "major crash" area in August 2025. It's been consolidating since. This could signal a near-term bottom. However, if the next earnings aren
Gartner, Inc.
No trades
Next report date
—
Report period
—
EPS estimate
—
Revenue estimate
—
9.8 EUR
1.21 B EUR
6.05 B EUR
69.73 M
About Gartner, Inc.
Sector
Industry
CEO
Eugene A. Hall
Website
Headquarters
Stamford
Founded
1979
Identifiers
3
ISINUS3666511072
Gartner, Inc. is a research and advisory company, which engages in the provision of insights, advice, and tools that help build organizations. It operates through the following segments: Research, Consulting, and Conferences. The Research segment delivers insights through subscription services that include access to published research content, data and benchmarks, and direct access to a network of research experts. The Consulting segment serves the chief information officer and other senior executives who are driving technology-driven strategic initiatives to optimize technology investments and drive business impact. The Conferences segment focuses on information technology and business executives as well as decision makers looking to adapt and evolve their organizations through disruption and uncertainty, navigate risks, and prioritize investments. The company was founded by Gideon I. Gartner and Dave L. R. Stein in 1979 and is headquartered in Stamford, CT.
Related stocks

IT: Long ideaThe price of IT as been holding above 125 monthly SMA for some time,
On the smaller timeframe we could potentially forming a triple bottom accumulation before reversing to the upside.
Bought some shares, pray this will play out as planned.
IT-Golden opportunity?IT is currently testing/ attempted to stand on the 125 SMA monthly timeframe,
It has done this in the past, 2020 covid crash then it has been on a bull run.
5 years later, almost in to Q4 2025, here we here we are, the price has corrected down to the exact trend line.
If the fundamental of the co


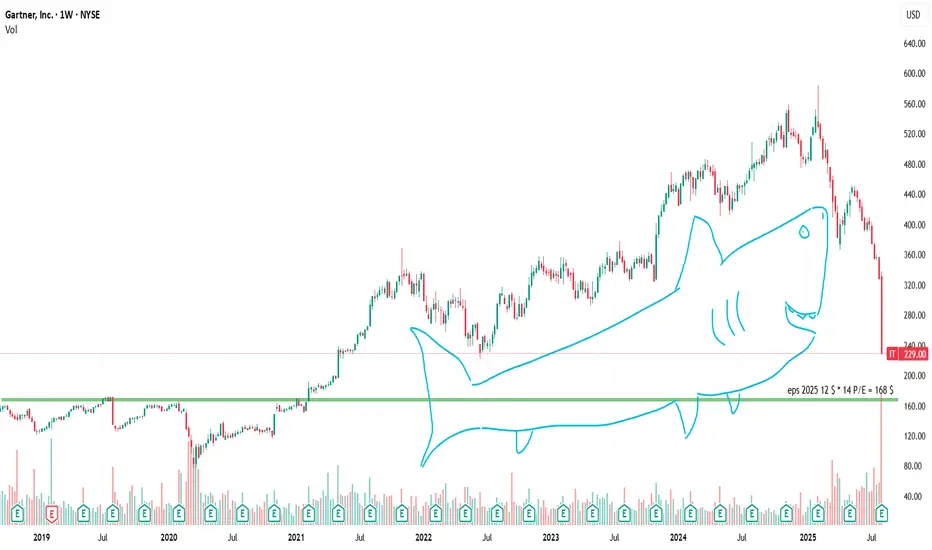
The Shark PatternA “shark pattern” in stock charts is a completely made-up formation where the price action looks like a dorsal fin cutting through calm market waters.
Traders say it signals “blood in the water” — which usually just means your stop-loss is about to get eaten.
Legend has it, if you spot a shark patte
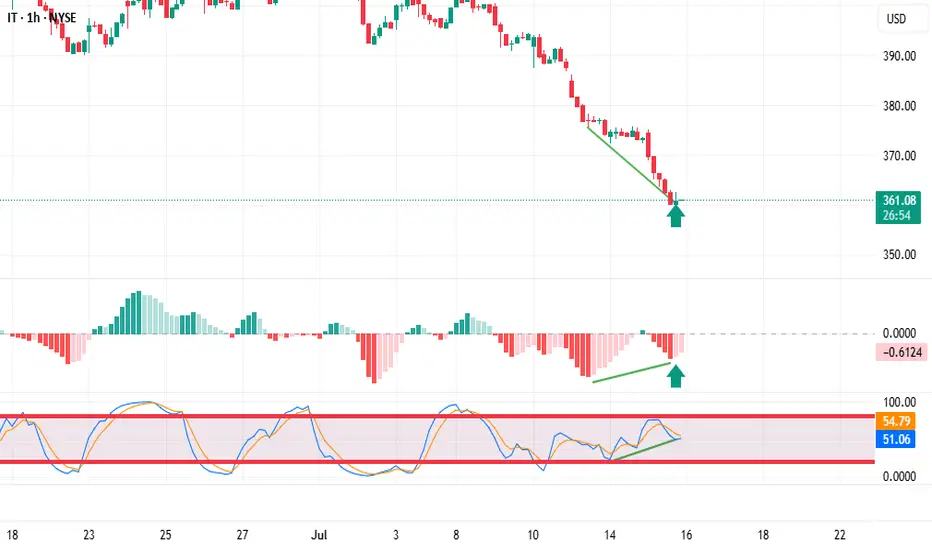
Trading stocks using Dr. Elder's "Three Screen Method"On the Weekly chart I see excellent price divergence to the MACD indicator
On the daily chart there is also an excellent price divergence towards the indicator.
The hourly chart confirms the analysis; there is also a price divergence to the indicator.
The signal for me to enter a trade i
$IT (Gartner) – Discount Rally Setup Forming📈 NYSE:IT (Gartner) – Discount Rally Setup Forming
Timeframe: 1D | Date: July 8, 2025 | VolanX DSS Scan – SMC + Liquidity Framework
Gartner ( NYSE:IT ) is exhibiting a textbook reaccumulation structure off the Discount Zone, following a series of CHoCH + BOS confirmations. Price is now pushing of

Gartner IT Buy Signal I see Gartner provides opportunity and buy option. I will watch today and it seems it is really potential. Will post my analysis in detail.

IT - 3 months ASCENDING TRIANGLE══════════════════════════════
Since 2014, my markets approach is to spot
trading opportunities based solely on the
development of
CLASSICAL CHART PATTERNS
🤝Let’s learn and grow together 🤝
══════════════════════════════
Hello Traders ✌
After a careful consideration I came to the conclusion that:
-

IT short termIT looks interesting.
The price just retested the resistance range so it´s perfect time to enter the short position.
Our estimated target is 325.13 $.
Good luck!

See all ideas
Summarizing what the indicators are suggesting.
Neutral
SellBuy
Strong sellStrong buy
Strong sellSellNeutralBuyStrong buy
Neutral
SellBuy
Strong sellStrong buy
Strong sellSellNeutralBuyStrong buy
Neutral
SellBuy
Strong sellStrong buy
Strong sellSellNeutralBuyStrong buy
An aggregate view of professional's ratings.
Neutral
SellBuy
Strong sellStrong buy
Strong sellSellNeutralBuyStrong buy
Neutral
SellBuy
Strong sellStrong buy
Strong sellSellNeutralBuyStrong buy
Neutral
SellBuy
Strong sellStrong buy
Strong sellSellNeutralBuyStrong buy
IT6234373
Gartner, Inc. 5.6% 20-NOV-2035Yield to maturity
5.59%
Maturity date
Nov 20, 2035
USU33791AC5
Gartner, Inc. 3.75% 01-OCT-2030Yield to maturity
5.06%
Maturity date
Oct 1, 2030
IT6234372
Gartner, Inc. 4.95% 20-MAR-2031Yield to maturity
4.80%
Maturity date
Mar 20, 2031
GRTN5204259
Gartner, Inc. 3.625% 15-JUN-2029Yield to maturity
4.79%
Maturity date
Jun 15, 2029
GRTN5003842
Gartner, Inc. 4.5% 01-JUL-2028Yield to maturity
4.75%
Maturity date
Jul 1, 2028
IT5003843
Gartner, Inc. 4.5% 01-JUL-2028Yield to maturity
—
Maturity date
Jul 1, 2028
See all 1IT bonds
Frequently Asked Questions
The current price of 1IT is 212.2 EUR — it has decreased by −0.70% in the past 24 hours. Watch Gartner, Inc. stock price performance more closely on the chart.
Depending on the exchange, the stock ticker may vary. For instance, on MIL exchange Gartner, Inc. stocks are traded under the ticker 1IT.
1IT stock has risen by 1.05% compared to the previous week, the month change is a 7.17% rise, over the last year Gartner, Inc. has showed a −41.83% decrease.
We've gathered analysts' opinions on Gartner, Inc. future price: according to them, 1IT price has a max estimate of 332.19 EUR and a min estimate of 185.69 EUR. Watch 1IT chart and read a more detailed Gartner, Inc. stock forecast: see what analysts think of Gartner, Inc. and suggest that you do with its stocks.
1IT stock is 0.71% volatile and has beta coefficient of 0.67. Track Gartner, Inc. stock price on the chart and check out the list of the most volatile stocks — is Gartner, Inc. there?
Today Gartner, Inc. has the market capitalization of 15.30 B, it has increased by 7.97% over the last week.
Yes, you can track Gartner, Inc. financials in yearly and quarterly reports right on TradingView.
Gartner, Inc. is going to release the next earnings report on Feb 10, 2026. Keep track of upcoming events with our Earnings Calendar.
1IT earnings for the last quarter are 2.35 EUR per share, whereas the estimation was 2.07 EUR resulting in a 13.73% surprise. The estimated earnings for the next quarter are 2.98 EUR per share. See more details about Gartner, Inc. earnings.
Gartner, Inc. revenue for the last quarter amounts to 1.30 B EUR, despite the estimated figure of 1.30 B EUR. In the next quarter, revenue is expected to reach 1.48 B EUR.
1IT net income for the last quarter is 30.13 M EUR, while the quarter before that showed 204.40 M EUR of net income which accounts for −85.26% change. Track more Gartner, Inc. financial stats to get the full picture.
No, 1IT doesn't pay any dividends to its shareholders. But don't worry, we've prepared a list of high-dividend stocks for you.
As of Dec 25, 2025, the company has 21.04 K employees. See our rating of the largest employees — is Gartner, Inc. on this list?
EBITDA measures a company's operating performance, its growth signifies an improvement in the efficiency of a company. Gartner, Inc. EBITDA is 1.19 B EUR, and current EBITDA margin is 22.14%. See more stats in Gartner, Inc. financial statements.
Like other stocks, 1IT shares are traded on stock exchanges, e.g. Nasdaq, Nyse, Euronext, and the easiest way to buy them is through an online stock broker. To do this, you need to open an account and follow a broker's procedures, then start trading. You can trade Gartner, Inc. stock right from TradingView charts — choose your broker and connect to your account.