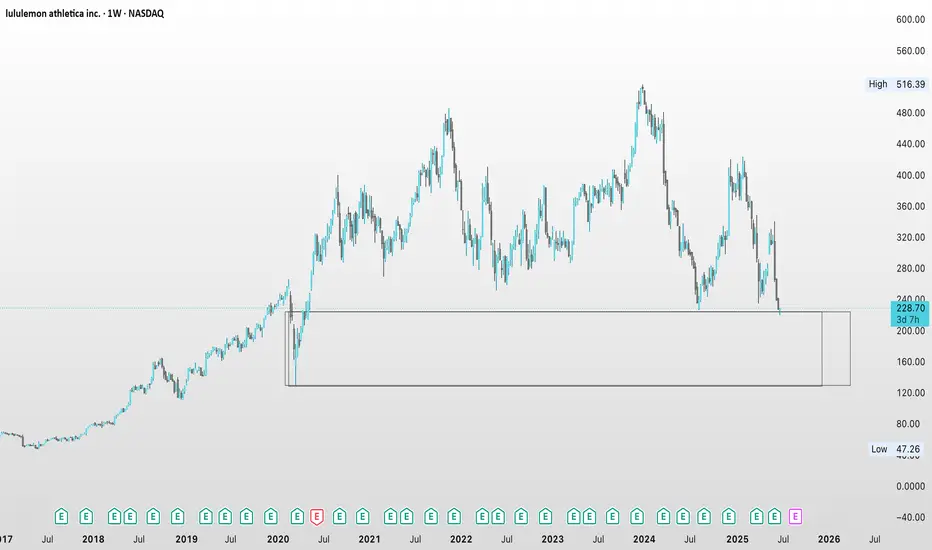
LULU into supportLulu is on sale as its just come into an area it has only sold at, 3 other times out of the past 5 years. As you can see by the Orange line, LULU has been holding this area of support for the past 5 years. This is a great buying opportunity. A close below the line on a weekly basis would stop out of
Next report date
—
Report period
—
EPS estimate
—
Revenue estimate
—
12.95 EUR
1.75 B EUR
10.22 B EUR
104.44 M
About lululemon athletica
Sector
Industry
CEO
Calvin R. McDonald
Website
Headquarters
Vancouver
Founded
1998
FIGI
BBG01TNXXY33
lululemon athletica, Inc. engages in the business of designing, distributing, and retailing technical athletic apparel, footwear, and accessories. It operates through the following segments: Company-Operated Stores, Direct to Consumer, and Other. The company was founded by Dennis James Wilson in 1998 and is headquartered in Vancouver, Canada.
Related stocks

LULU – Compression Complete? Reversal in Progress | WaverVanir PTicker: NASDAQ:LULU
Timeframe: 1D (Daily)
Posted by: WaverVanir International LLC | VolanX DSS Framework
🧠 Technical Thesis:
LULU is showing signs of a potential macro reversal after a sharp capitulation and retest of key demand (~$235–240). The double-bottom formation and absorption at prior sup

LULU LongMarket Structure Analysis
Break of Structure (BOS): A clean BOS was confirmed following a strong bullish impulse off the low at $219. This suggests a transition from a bearish trend into potential accumulation.
Higher Lows and Re-accumulation: After the BOS, price is forming a clear series of highe

Looking for a leap on LULU. OptionsMastery:
🔉Sound on!🔉
📣Make sure to watch fullscreen!📣
Thank you as always for watching my videos. I hope that you learned something very educational! Please feel free to like, share, and comment on this post. Remember only risk what you are willing to lose. Trading is very risky but it can c

LULU Daily | Smart Money + Fibonacci Reversal Setup📢
📆 July 1, 2025 | ⏱ 1D Chart
🔹 SMC + Volume + FVG Confluence
🔹 Powered by WaverVanir DSS Protocol
📍 Context:
LULU printed a strong bullish engulfing off the 0.786–0.886 Fibonacci retracement zone, following a BOS and liquidity sweep at $233.
Volume surged near the bottom — potential institutional

Safe Entry Zone LuLuStock current at SIGNIFICANT Support Level.
P.High's & P.Lows(Previous Highs & Previous Lows) acts as good Support and resistances levels.
1D Green Zone Is Buying Zone.
1D Red Zone is Selling Zone.
Take Profit Line is where you may secure Profit in case any selling Pressure showed-up near the Li

Lulu Long15-Minute Chart: Head and Shoulders Pattern
A head and shoulders pattern has formed on the 15-minute chart, signaling a potential reversal from a short-term downtrend, suggesting bullish momentum may be building.
Daily Chart: Hammer Candlestick & RSI Oversold
The daily chart shows a hammer candle

Lululemon Chart Breakdown Lululemon (LULU) Chart Breakdown
Buy around $200-$250 Dollar Levels
Sell/TP: Above $275-$300

Lululemon Stock Chart Fibonacci Analysis 062725Trading Idea
1) Find a FIBO slingshot
2) Check FIBO 61.80% level
3) Entry Point > 225/61.80%
Chart time frame:D
A) 15 min(1W-3M)
B) 1 hr(3M-6M)
C) 4 hr(6M-1year)
D) 1 day(1-3years)
Stock progress:C
A) Keep rising over 61.80% resistance
B) 61.80% resistance
C) 61.80% support
D) Hit the bottom
E)

LULU investment ideaprice coming bck to 2020 prices,
mitigation POI at a deeep retracement
even a conservative reaction could go for imbalance
See all ideas
Summarizing what the indicators are suggesting.
Neutral
SellBuy
Strong sellStrong buy
Strong sellSellNeutralBuyStrong buy
Neutral
SellBuy
Strong sellStrong buy
Strong sellSellNeutralBuyStrong buy
Neutral
SellBuy
Strong sellStrong buy
Strong sellSellNeutralBuyStrong buy
An aggregate view of professional's ratings.
Neutral
SellBuy
Strong sellStrong buy
Strong sellSellNeutralBuyStrong buy
Neutral
SellBuy
Strong sellStrong buy
Strong sellSellNeutralBuyStrong buy
Neutral
SellBuy
Strong sellStrong buy
Strong sellSellNeutralBuyStrong buy
Curated watchlists where 1LUL is featured.

Frequently Asked Questions
The current price of 1LUL is 208.95 EUR — it has decreased by −1.52% in the past 24 hours. Watch LULULEMON ATHL stock price performance more closely on the chart.
Depending on the exchange, the stock ticker may vary. For instance, on MIL exchange LULULEMON ATHL stocks are traded under the ticker 1LUL.
1LUL stock has risen by 2.97% compared to the previous week, the month change is a −29.74% fall, over the last year LULULEMON ATHL has showed a −11.24% decrease.
We've gathered analysts' opinions on LULULEMON ATHL future price: according to them, 1LUL price has a max estimate of 427.49 EUR and a min estimate of 149.62 EUR. Watch 1LUL chart and read a more detailed LULULEMON ATHL stock forecast: see what analysts think of LULULEMON ATHL and suggest that you do with its stocks.
1LUL reached its all-time high on Jun 3, 2025 with the price of 296.25 EUR, and its all-time low was 190.10 EUR and was reached on Jun 23, 2025. View more price dynamics on 1LUL chart.
See other stocks reaching their highest and lowest prices.
See other stocks reaching their highest and lowest prices.
1LUL stock is 1.54% volatile and has beta coefficient of 1.01. Track LULULEMON ATHL stock price on the chart and check out the list of the most volatile stocks — is LULULEMON ATHL there?
Today LULULEMON ATHL has the market capitalization of 25.25 B, it has decreased by −5.17% over the last week.
Yes, you can track LULULEMON ATHL financials in yearly and quarterly reports right on TradingView.
LULULEMON ATHL is going to release the next earnings report on Aug 28, 2025. Keep track of upcoming events with our Earnings Calendar.
1LUL earnings for the last quarter are 2.30 EUR per share, whereas the estimation was 2.28 EUR resulting in a 0.60% surprise. The estimated earnings for the next quarter are 2.46 EUR per share. See more details about LULULEMON ATHL earnings.
LULULEMON ATHL revenue for the last quarter amounts to 2.09 B EUR, despite the estimated figure of 2.08 B EUR. In the next quarter, revenue is expected to reach 2.17 B EUR.
1LUL net income for the last quarter is 277.77 M EUR, while the quarter before that showed 722.56 M EUR of net income which accounts for −61.56% change. Track more LULULEMON ATHL financial stats to get the full picture.
No, 1LUL doesn't pay any dividends to its shareholders. But don't worry, we've prepared a list of high-dividend stocks for you.
As of Jul 5, 2025, the company has 39 K employees. See our rating of the largest employees — is LULULEMON ATHL on this list?
EBITDA measures a company's operating performance, its growth signifies an improvement in the efficiency of a company. LULULEMON ATHL EBITDA is 2.66 B EUR, and current EBITDA margin is 27.83%. See more stats in LULULEMON ATHL financial statements.
Like other stocks, 1LUL shares are traded on stock exchanges, e.g. Nasdaq, Nyse, Euronext, and the easiest way to buy them is through an online stock broker. To do this, you need to open an account and follow a broker's procedures, then start trading. You can trade LULULEMON ATHL stock right from TradingView charts — choose your broker and connect to your account.