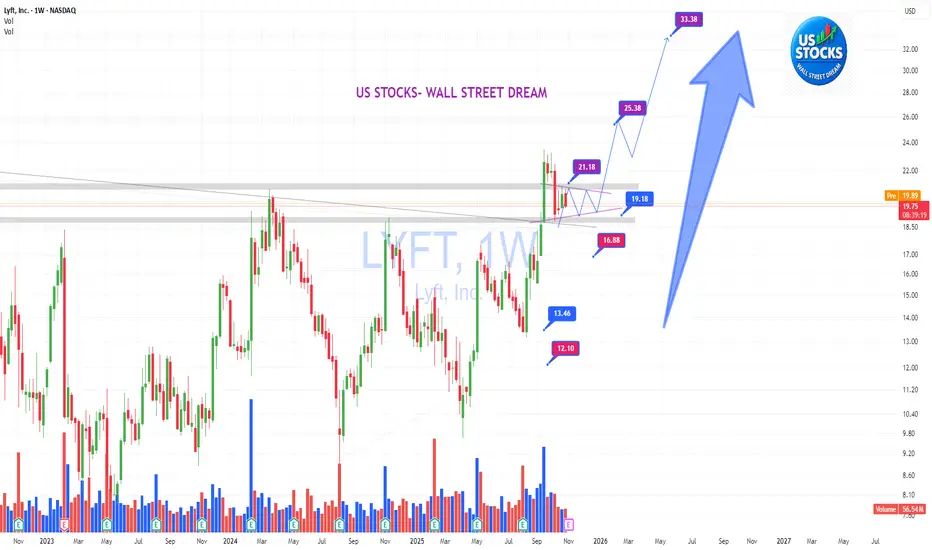
LYFT 1W from losses to profit investors believe,but for how longLYFT broke out of its long accumulation range between $8 and $20 and is now consolidating above the breakout level. The “breakout + retest” structure remains intact, with $20–21 acting as key support. A golden cross on the weekly chart confirms a shift toward bullish momentum. As long as price hold
Next report date
—
Report period
—
EPS estimate
—
Revenue estimate
—
0.310 EUR
22.01 M EUR
5.59 B EUR
379.96 M
About Lyft, Inc.
Sector
Industry
CEO
John David Risher
Website
Headquarters
San Francisco
Founded
2007
ISIN
US55087P1049
FIGI
BBG019VR3KX1
Lyft, Inc. engages in the provision and management of an online social rideshare community platform. It offers access to a network of shared bikes and scooters for shorter rides and first mile and last-mile legs of multimodal trips, information about nearby public transit routes, and Lyft Rentals to offer riders a view of transportation options when planning any trip. The company was founded by Marcus Cohn, John Zimmer, Rajat Suri, Matt van Horn, and Logan Green in 2007 and is headquartered in San Francisco, CA.
Related stocks

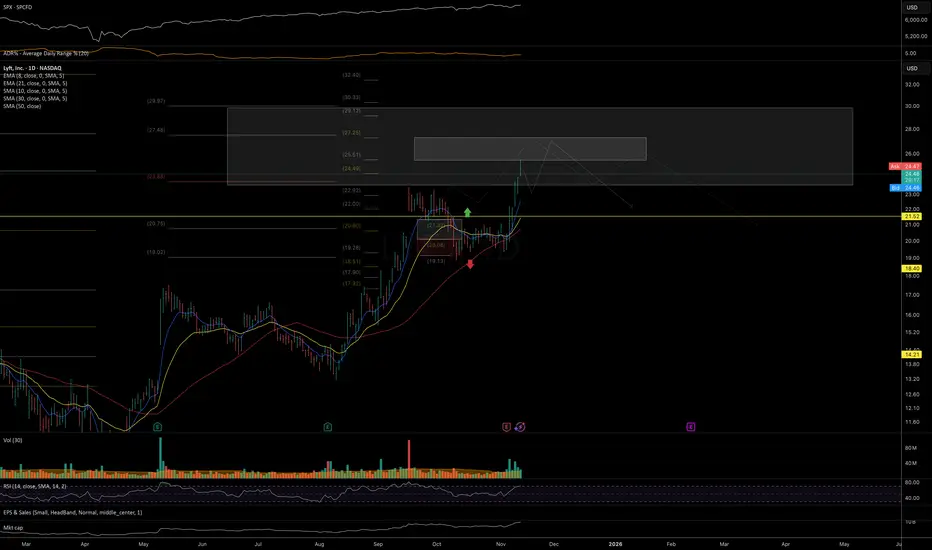
LYFT testing important resistance zone Price has held the mid-term support zone highlighted in the September update and is now entering a key resistance area at 25–27, where selling pressure could begin to dominate.
Chart:
Previously:
On support and bullish potential (Sep 27):
www.tradingview.com
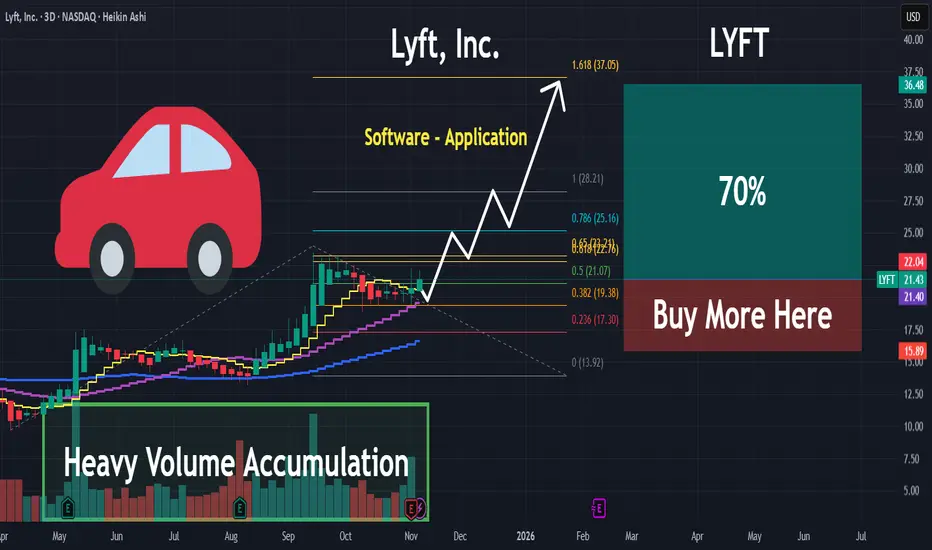
LYFT | Expect an Accelerated Move Higher | LONGLyft, Inc. engages in the provision and management of an online social rideshare community platform. It offers access to a network of shared bikes and scooters for shorter rides and first mile and last-mile legs of multimodal trips, information about nearby public transit routes, and Lyft Rentals to
LYFT US🌎Q3 Key Results: Growth is strong, momentum is growing
Lyft's third-quarter report confirms that its comeback strategy is working.
Record Performance: The company achieved historic highs in active riders (28.7 million, 1.2 million above expectations) and bookings ($4.78 billion, +16% YoY).
Stable
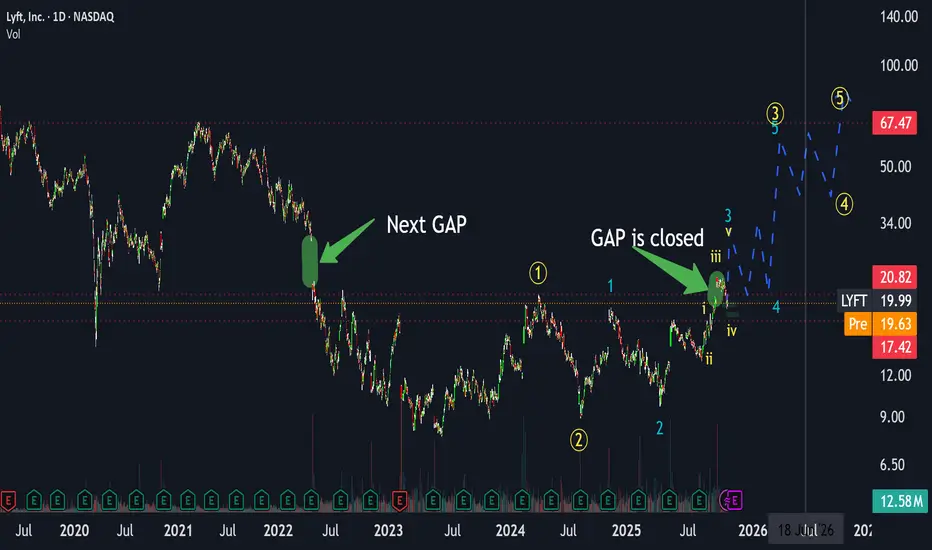
Lyft OffMomentum looks really strong in LYFT. clean breakout out of wedge pattern above key resistance at 20 and a MACD bullish cross in the making, we should be off to the races.
This is a long that I would add to here at this key level.
medium-term target 70 a share.

LYFT: A swing pause to rest before preparing for a strong trendLYFT:
.
A swing pause to rest before preparing for a strong trend.
Backup/ SOS befofre next movements.\
.
US STOCKS- WALL STREET DREAM- LET'S THE MARKET SPEAK
LYFT: The Hidden Gem in My October Top 3 PicksAs I’ve mentioned in my recent videos, LYFT is one of my top 3 priority stocks for October — and for good reason.
The fundamentals have exploded while the price is still lagging far behind.
🔸 Fundamentals
EPS growth has been massive .
– In March, EPS was up +128% YoY,
– and by June, it jump
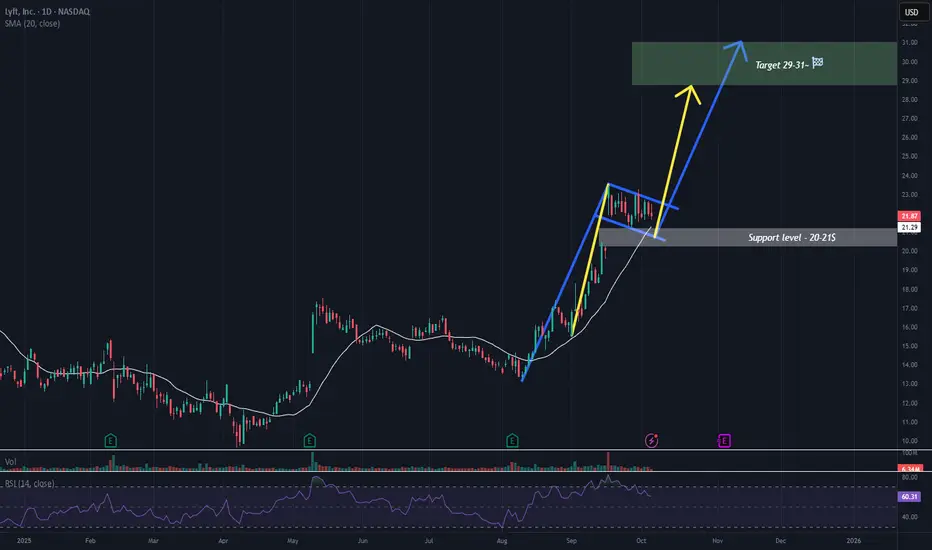
$LYFT - Bullish Momentum and Flag Formation in Higher RangesLYFT has made a remarkable upward move. The stock currently appears to be holding strong in the higher price ranges, potentially forming two bullish flag patterns, which could signal continuation toward the next target zone of $29–$31. On the downside, key support levels are identified at $21.20 and
Bullish continuation.. from the bottom, good unlimited upsideNASDAQ:LYFT is looking at a strong bullish continuation trend and is likely to trend higher going forward as a bullish flag was seen forming above the strong bullish gap seen in 17 Sep 2025. Prices is looking strong after a bullish candle was seen closing above the 9-period conversion line.
Weekly

LYFT – Major Weekly BreakoutTechnical Context:
LYFT has broken through a multi-year resistance zone around $20–$22 with strong momentum. This is the first weekly close above this key level since 2022. Price is now extended, so I’ll wait for a potential pullback or consolidation to confirm support.
Trade Plan:
Entry: Only on

See all ideas
Summarizing what the indicators are suggesting.
Neutral
SellBuy
Strong sellStrong buy
Strong sellSellNeutralBuyStrong buy
Neutral
SellBuy
Strong sellStrong buy
Strong sellSellNeutralBuyStrong buy
Neutral
SellBuy
Strong sellStrong buy
Strong sellSellNeutralBuyStrong buy
An aggregate view of professional's ratings.
Neutral
SellBuy
Strong sellStrong buy
Strong sellSellNeutralBuyStrong buy
Neutral
SellBuy
Strong sellStrong buy
Strong sellSellNeutralBuyStrong buy
Neutral
SellBuy
Strong sellStrong buy
Strong sellSellNeutralBuyStrong buy
Displays a symbol's price movements over previous years to identify recurring trends.
LYFT6019003
Lyft, Inc. 0.625% 01-MAR-2029Yield to maturity
—
Maturity date
Mar 1, 2029
US55087PAE4
Lyft, Inc. 0.0% 15-SEP-2030Yield to maturity
—
Maturity date
Sep 15, 2030
See all 1LYFT bonds
Curated watchlists where 1LYFT is featured.


Frequently Asked Questions
The current price of 1LYFT is 19.235 EUR — it has decreased by −5.24% in the past 24 hours. Watch Lyft, Inc. Class A stock price performance more closely on the chart.
Depending on the exchange, the stock ticker may vary. For instance, on MIL exchange Lyft, Inc. Class A stocks are traded under the ticker 1LYFT.
1LYFT stock has fallen by −0.90% compared to the previous week, the month change is a 15.06% rise, over the last year Lyft, Inc. Class A has showed a 10.56% increase.
We've gathered analysts' opinions on Lyft, Inc. Class A future price: according to them, 1LYFT price has a max estimate of 27.54 EUR and a min estimate of 8.61 EUR. Watch 1LYFT chart and read a more detailed Lyft, Inc. Class A stock forecast: see what analysts think of Lyft, Inc. Class A and suggest that you do with its stocks.
1LYFT reached its all-time high on Nov 12, 2025 with the price of 21.145 EUR, and its all-time low was 7.440 EUR and was reached on May 24, 2023. View more price dynamics on 1LYFT chart.
See other stocks reaching their highest and lowest prices.
See other stocks reaching their highest and lowest prices.
1LYFT stock is 5.53% volatile and has beta coefficient of 1.04. Track Lyft, Inc. Class A stock price on the chart and check out the list of the most volatile stocks — is Lyft, Inc. Class A there?
Today Lyft, Inc. Class A has the market capitalization of 7.95 B, it has increased by 7.37% over the last week.
Yes, you can track Lyft, Inc. Class A financials in yearly and quarterly reports right on TradingView.
Lyft, Inc. Class A is going to release the next earnings report on Feb 11, 2026. Keep track of upcoming events with our Earnings Calendar.
1LYFT earnings for the last quarter are 0.09 EUR per share, whereas the estimation was 0.21 EUR resulting in a −55.10% surprise. The estimated earnings for the next quarter are 0.11 EUR per share. See more details about Lyft, Inc. Class A earnings.
Lyft, Inc. Class A revenue for the last quarter amounts to 1.44 B EUR, despite the estimated figure of 1.45 B EUR. In the next quarter, revenue is expected to reach 1.52 B EUR.
1LYFT net income for the last quarter is 39.26 M EUR, while the quarter before that showed 34.22 M EUR of net income which accounts for 14.73% change. Track more Lyft, Inc. Class A financial stats to get the full picture.
No, 1LYFT doesn't pay any dividends to its shareholders. But don't worry, we've prepared a list of high-dividend stocks for you.
As of Nov 18, 2025, the company has 2.93 K employees. See our rating of the largest employees — is Lyft, Inc. Class A on this list?
EBITDA measures a company's operating performance, its growth signifies an improvement in the efficiency of a company. Lyft, Inc. Class A EBITDA is 143.19 M EUR, and current EBITDA margin is 1.17%. See more stats in Lyft, Inc. Class A financial statements.
Like other stocks, 1LYFT shares are traded on stock exchanges, e.g. Nasdaq, Nyse, Euronext, and the easiest way to buy them is through an online stock broker. To do this, you need to open an account and follow a broker's procedures, then start trading. You can trade Lyft, Inc. Class A stock right from TradingView charts — choose your broker and connect to your account.
Investing in stocks requires a comprehensive research: you should carefully study all the available data, e.g. company's financials, related news, and its technical analysis. So Lyft, Inc. Class A technincal analysis shows the buy rating today, and its 1 week rating is buy. Since market conditions are prone to changes, it's worth looking a bit further into the future — according to the 1 month rating Lyft, Inc. Class A stock shows the strong buy signal. See more of Lyft, Inc. Class A technicals for a more comprehensive analysis.
If you're still not sure, try looking for inspiration in our curated watchlists.
If you're still not sure, try looking for inspiration in our curated watchlists.