#MINA/USDT#MINA
The price is moving in a descending channel on the 12-hour frame and is sticking to it very well and is about to break upwards
We have a bounce from the lower limit of the channel at 0.3900
We have an upward trend on the RSI indicator that is about to break, which supports the rise
We have a trend to stabilize above the moving average 100
Entry price 0.4790
First target 0.5996
Second target 0.6687
Third target 0.7551
MINAUSDT trade ideas

MINA Hits Bottom; Trading Strategy; 888% Potential & More!MINA hit bottom recently and this is good news...
This is an analysis for MINAUSDT. The MINABTC trade-idea can be found by looking at the 'Related publications' at the bottom of this post.
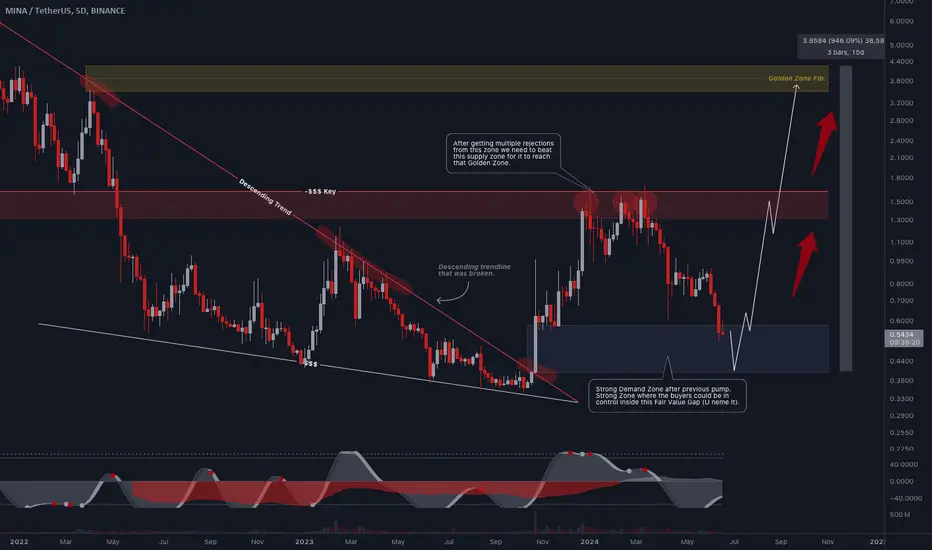
We are looking at the best possible prices before the 2025 bull-market, literally. MINAUSDT is now trading within its long-term accumulation zone after a small recovery from a new All-Time Low hit last month, August 2024.
The ATL happened on a wick, by a few cents, so we can also call this a double-bottom. So the early 2024 correction removed all the gains generated from the 2023 recovery wave. This is good because it means that we can now expect long-term growth.
The market never moves straight up so you can expect to see some swings, but the trend will be bullish.
When MINAUSDT starts growing, we look strictly to the upside. Any retraces and corrections will be an opportunity to rebuy and reload.
When there is strong growth, a portion can be sold at resistance of your holdings.
When a correction comes, more can be bought at support. This is trading 101.
It sounds easy but it becomes hard because we have to move against the herd. People will be buying at the top and selling at resistance, we have to do the inverse.
For example, right now there are not many people around and all these pairs are being ignored. Three to six weeks from now we will be looking at a local top, and people will be rushing to buy but their timing will be wrong. The time to buy is now, when prices are low.
The easier strategy for beginners is to hold long-term. Since it can get messy pretty fast and quite easily, instead of selling at each resistance, one can hold long-term until big profits are secured. However you approach the market is completely up to you.
I can write much here but this won't change your own individual results. We tend to act based on our habits and according to what we are set to experience based on our subconscious programming.
Some people are ready to earn big and they will earn big regardless of what they do. Some people are programmed to lose, due to certain mental blockages and these people will lose regardless of what the market does.
Some people can learn from these articles, become wiser, make the right moves and avoid mistakes. These people are the exception and not the norm.
Most of us have to learn the hard way. We do it wrong many times and from this experience we learn until eventually we get it right.
There is nothing wrong with making mistakes.
It doesn't matter which group you are in.
The fact that you are reading this now means you are on the right path and if you persist, you can easily win.
When things go bad, know that better is just around the corner.
When things are good, be grateful and share with those less fortunate, or those that help you in your journey to success.
We are all in this together and even though we have our differences of opinions and views of the market, we are all striving for profits, for gains, for wealth, health and success.
You are a human being and I am a human being.
We can easily relate.
I am the expression of the living Spirit, and you are exactly the same.
We both have light shinning forth from our spiritual heart.
Thank you for reading.
Namaste.

MINAUSDT.4HExamining the 4-hour chart for MINA/USDT, we notice a prevailing downward trend with the price currently at around $0.4372. The chart displays a series of lower highs and lower lows, a hallmark of bearish momentum over the observed period.
Trend Analysis: A descending trendline captures the series of lower highs, indicating sustained selling pressure. The price recently tested this trendline and was rejected, reinforcing the strength of this downward trajectory.
Key Support and Resistance Levels:
Support 1 (S1): $0.3203 - This level represents a significant low point on the chart where the price could potentially stabilize or rebound if it continues to fall.
Resistance 1 (R1): $0.6060 - This marks the most recent peak before the price retraced. Overcoming this level would be crucial for reversing the current bearish sentiment.
Technical Indicators:
MACD: The Moving Average Convergence Divergence (MACD) line is close to the signal line, indicating a potential for either direction, but still below zero which suggests bearish dominance.
RSI: The Relative Strength Index (RSI) at approximately 59 indicates a neutral momentum, neither overbought nor oversold, suggesting potential for either upward or downward movement.
Conclusion: Given the established downtrend and current resistance testing, caution is advisable. The strategy would involve monitoring for any potential breaks above the trendline as a sign of bullish reversal. Should the price approach the support at $0.3203, watching for a strong bounce or further decline will be critical. Trading should consider these levels for setting entry and exit points, with a close watch on the MACD and RSI for any signs of momentum shift. Setting stop losses just below the support levels can help mitigate risk in case of a breakdown.

MINAUSDT 2D#MINA has formed a falling wedge pattern on the 2-day chart. In the event of a breakout above the pattern, the targets are:
🎯$0.6574
🎯$0.8610
🎯$1.0255
🎯$1.1900
🎯$1.4242

The MINA is based on a strong request areaAfter returning to the strong demand areas, the currency is trying to restore the price momentum for it and prepare for the launch

minausdt - wait for breakouthello, mina trading btw triangle from the many days, once its breakout its should be a good long position, all entry and tp/sl details i mention on the chart, th

MINA SELL LIMIT Hi dear traders
In the 1H time frame, a bearish divergence can be seen between the price and the RSI.
If the false breakout of the triangle is confirmed, we can open short position with suitable R/R.
Let's see what happens
This is not financial advice ( DYOR )
Good luck 👍

maybe this time its differentmina's team has been teasing about programmability for the longest time (~2 years i think).
its finally launched and some dapps are popping up (utility to be seen).
no 'killer apps' yet. but what they do feature is zk proofs (hopefully).
long term might make some moves.
currently the same market cap as launch despite price going down.

A descending trendline has been identifiedThe trend of MINA in higher time frames and overall remains in a ranging pattern, consistently moving sideways. A descending trendline has been identified, with the price currently stuck below this line and unable to break through.
The support and demand zone for MINA might prompt positive reactions. The likely scenario is a return to the specified demand zone, followed by an attempt to break the descending trendline.

$MINA #MinaProtocol Trading IdeaMINA/USD (MinaProtocol) and at other coins (5D-1W timeframe) I see a potential bottom. Just analyzing coins that have a huge upside potential and a sweet RR to my portfolio.
Triangle's topThe overall trend of MINA is rang, and we are seeing good fluctuations. It has a triangle pattern, and the price is currently continuing its range within this triangle, now positioned at the triangle's top.
The price might drop to the bottom of the triangle, and from there, it can move upwards to break the triangle.

$mina - 1 more sweep or pop ?showed some signs of coming back to life opened a 3x swing till Q4
looking for 2.9
so in my mind that r/r makes sense
close above the 7 ema tonite and we go tag the 200 ema and range high confluence before flipping it
so yeah lots of resistance on the way up but as we break each one the pumps get better
entries you snipe now will be golden Q3 onwards

MINA ready to bounce!MINA should go higher from here.
●Reclaim this 4h FVG and MINA is good to go for $0.97 and $1.13.
●We are in a bull market so I'll be only to go long.
●May is ending so being bearish is never a good idea for me..I share what I see.

MINAUSDT.4HBased on the technical analysis of the MINA/USDT 4-hour chart provided, here’s a detailed and professional first-person analysis in English:
Upon examining the MINA/USDT 4-hour chart, several key technical indicators and levels emerge, providing insights into potential price movements.
Trend and Resistance Analysis:
The chart shows that Mina (MINA) has been in a consolidation phase with the current price around 0.8899 USD. The price is currently attempting to break above the immediate resistance level marked as R1, around 0.9897 USD. A successful breakout above this level could lead the price to test the next significant resistance at R2, which is around 1.1607 USD. The overall trend is slightly upward, supported by a rising trend line indicating increasing buying pressure.
Support Levels:
On the downside, the primary support level is identified as S1 at 0.7125 USD. This level has shown strong buying interest previously and could act as a floor if the price starts to decline. Below S1, the next significant support level is at 0.6000 USD, which has been a critical support zone in the past.
RSI and MACD Indicators:
The Relative Strength Index (RSI) is currently at 61.72, indicating a neutral to slightly bullish position. The RSI is in the upper middle range, suggesting that there is room for potential upward movement without the asset being overbought. The Moving Average Convergence Divergence (MACD) indicator shows a bullish trend, with the MACD line (blue) above the signal line (orange)
and the histogram indicating positive momentum. This suggests that bullish momentum is currently building.
Volume Analysis:
The volume pattern indicates moderate trading activity, with no significant spikes during recent price movements. This suggests balanced participation from both buyers and sellers, contributing to the current consolidation phase.
Conclusion:
In conclusion, the MINA/USDT pair is currently in a consolidation phase with a slight bullish bias. The RSI indicates a neutral to slightly bullish position, while the MACD suggests building bullish momentum. Traders should closely monitor the support levels at 0.7125 USD and the resistance levels at 0.9897 USD and 1.1607 USD. A break above the resistance levels would confirm a bullish trend continuation, while a failure to hold the support levels could lead to further declines.
Overall, the market sentiment for MINA remains cautiously optimistic, with critical attention needed at the aforementioned levels and indicators to make informed trading decisions.

MINA Eyes Bullish Breakout: Potential RallyThe price is currently trading around $0.8137, having shown a recent increase in buying volume at $0.78.
There is a significant resistance level around $0.9941, which the price needs to overcome to continue its upward movement.
Key Levels to Watch:
Immediate Resistance at $0.9941 : Overcoming this level could see the price move towards the next resistance at $1.6048.
Immediate Support at $0.7272 : If the price falls, this level might act as a support.
Volume Analysis : The annotation on the chart indicates an increase in buying volume around the $0.78 level. This suggests that buyers are stepping in, which could provide support for a potential upward move.
Future Projections:
If the price breaks above the $0.9941 resistance , the next target could be the $1.6048 level.
If the price fails to hold above the current support levels, particularly $0.7272 , it could retest lower support levels at $0.3709 .
In summary, a potential bullish reversal following a long-term downtrend. Key resistance levels to watch are $0.9941 and $1.6048, while support levels to monitor are $0.7272 and $0.3709. The increase in buying volume around $0.78 is a positive sign for potential upward movement.

MINA looks bullishA Trigger Line is formed.
Higher Ls are forming and buyers look strong.
It can move up to maintain the green range.
Closing a 4-hour candle below the invalidation level will violate the analysis
For risk management, please don't forget stop loss and capital management
When we reach the first target, save some profit and then change the stop to entry
Comment if you have any questions
Thank You

#MINA/USDT#MINA
We have a bearish channel pattern on a 12-hour frame, the price moves within it and adheres to its limits well
We have a green support area at 0.7300 after the price touched it and bounced from it
We have a tendency to stabilize above moving average 100
We have an uptrend on the RSI indicator that supports the price higher
Entry price is 0.8000
The first target is 0.8946
The second target is 0.9761
the third target is 1.0540

Bearish continuationChart description:
Assuming the low is in and we finished wave 1.
Short/mid-term setup:
- Flat structure, currently in wave C.
- Although wave B did not touch the 1.23fib. It looks expanded because of the leading diagonal is invalid.
- Multiple 1-2 setup.
- Target box laid out in chart. Golden pocket ratio at $0.64.
- As price action progresses we can set clearer targets for short-term bullish/bearish scenario’s.

MINA/USDTMINA/USDT
MINA is breaking the Bearish channel. If it stabilizes and pullback, it can pump to $0.8815 range


MINA/USDT descending resistance breakout?👀🚀Mina Analysis
💎 Paradisers, get ready for a thrilling opportunity with #MINAUSDT as it approaches a critical point in its descending resistance, gearing up for a bullish breakout.
💎 Historically, we've seen #MINA adhering to a descending resistance pattern. Currently, it's on the cusp of a breakout. If the price can surpass this resistance and maintain its momentum, there’s a high chance it could launch into a robust bullish rally towards the supply area at $1.1355. While there's a possibility of encountering some resistance at this level, it’s crucial not to panic but to stay alert and monitor market sentiments closely. Surpassing this supply area could lead to a significant upward movement.
💎 On the flip side, if the price CSE:MINA loses momentum and the anticipated breakout doesn’t materialize, falling below the support level of $0.7406 could tilt the scales towards a prolonged bearish trend. In such a scenario, maintaining vigilance and applying strategic trading tactics are vital for navigating the markets successfully.
MyCryptoParadise
iFeel the success🌴

MINAUSDT 4H#MINA is trying to break out the trend line. However, it can retest the support levels. Wait for a clean breakout and then buy it. We are buying it here and will buy more at $0.8415 and $0.7411
Targets are:
$0.9909
$1.1116
$1.2323
$1.4042

MINAUSDT Elliott Waves AnalysisHello friends.
Please support my work by clicking the LIKE button👍(If you liked). Also i will appreciate for ur activity.
Everything on the chart.
Entry: Market and lower
Targets: 2 - 2.5 - 3.5 - 4.8
after first target reached move ur stop to breakeven
Stop: under 0.4 (depending of ur risk). ALWAYS follow ur RM .
RR: 1 to 10
risk is justified
It's not financial advice.
DYOR!
