MORPHO Analysis (12H)After losing the trendline and forming a bearish CH (Change of Character), the price is now pulling back into the supply zones. A rejection from the red zone toward the green zone could lead to a drop.
A candle close above the invalidation level would invalidate this analysis.
For risk management,
No news here
Looks like there's nothing to report right now


MORPHO Rebuy Setup (12H)From the point where we placed the red arrow, it appears that the bullish MORPHO wave has ended, and the price has entered a corrective phase. This phase could be a diametric or symmetrical pattern.
Wave G is expected to complete within the green zone.
We anticipate a return of 30% to 50% from the


MORPHO - NEUTRAL WITH POTENTIAL BULLISH REVERSALMORPHO/USDT: Key Levels Analysis & Trading Opportunities
Current Analysis:
Price is at a critical decision point around $1.94, forming a potential reversal pattern.
Key Levels:
→ Major Resistance: $2.60
→ Minor Resistance: $2.30
→ Current Support: $1.94
→ Major Support: $1.75
Trading Scenarios:

MORPHO Analysis (2H)From the point where we placed the red arrow on the chart, MORPHO appears to be forming a complex corrective pattern similar to a diametric.
Wave E could complete within the red box, leading the price into wave F.
A daily candle closing above the invalidation level will invalidate this outlook.
F

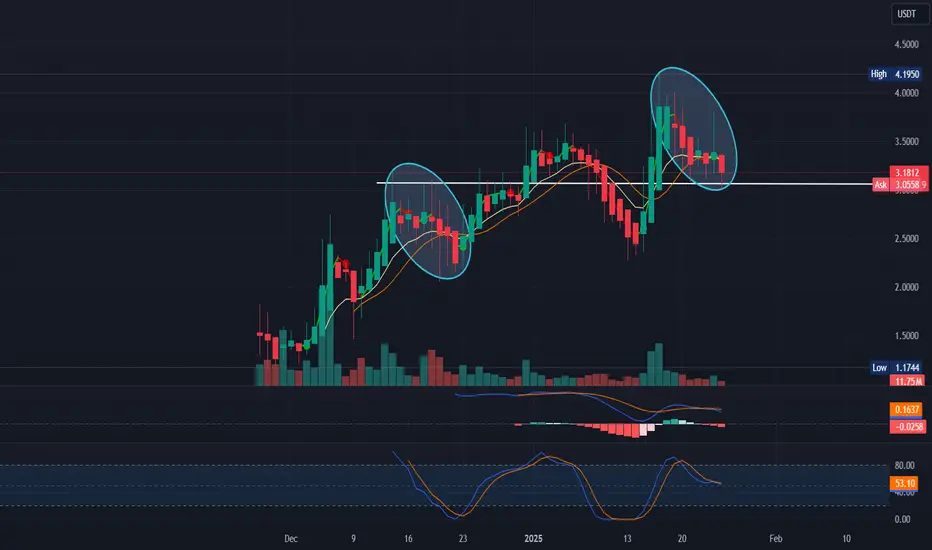
MORPHOi do love this project, there is no volatility and it is quiet good in understanding the way it works.
if you see the 2 marked points it very obvious that are quite similar, so regarding last time how it went up, i would say that the next price should be 4.6-4.8$
Probably i will buy in spot.
go

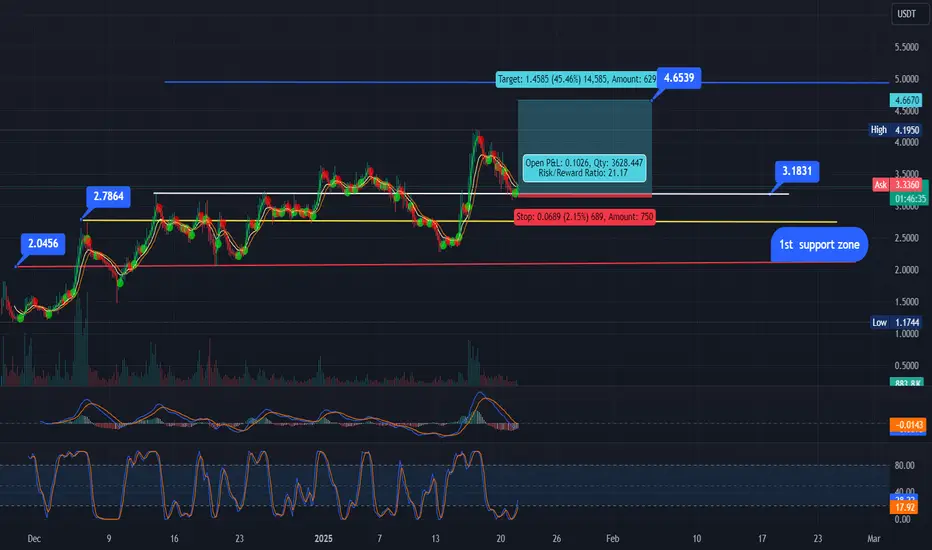
MORPHso, this is how i see MORPH to be next week.
what i would wait to see it is RSI and MACD confirmation in 1D tf, rn in 4h tf it is yet ready for long, so when MACD will blink the white light then it is time to ape long.
probably tomorrow night this could happen, lets wait and see how the markets will

See all ideas
Summarizing what the indicators are suggesting.
Oscillators
Neutral
SellBuy
Strong sellStrong buy
Strong sellSellNeutralBuyStrong buy
Oscillators
Neutral
SellBuy
Strong sellStrong buy
Strong sellSellNeutralBuyStrong buy
Summary
Neutral
SellBuy
Strong sellStrong buy
Strong sellSellNeutralBuyStrong buy
Summary
Neutral
SellBuy
Strong sellStrong buy
Strong sellSellNeutralBuyStrong buy
Summary
Neutral
SellBuy
Strong sellStrong buy
Strong sellSellNeutralBuyStrong buy
Moving Averages
Neutral
SellBuy
Strong sellStrong buy
Strong sellSellNeutralBuyStrong buy
Moving Averages
Neutral
SellBuy
Strong sellStrong buy
Strong sellSellNeutralBuyStrong buy
Displays a symbol's price movements over previous years to identify recurring trends.