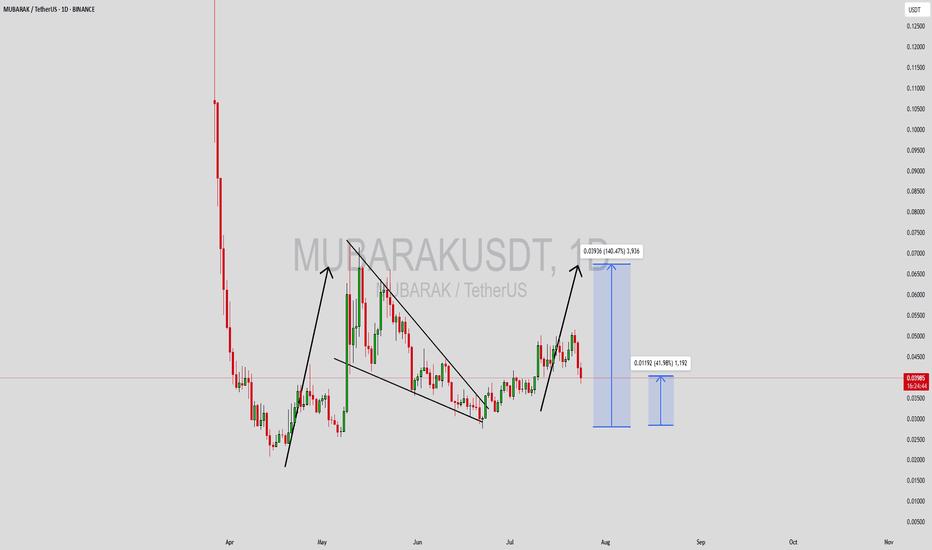
MUBARAKUSDT Forming Bullish PennantMUBARAKUSDT is currently displaying a bullish pennant pattern, which is often seen as a continuation signal following a strong upward price movement. This setup typically indicates a brief consolidation phase before the price resumes its upward trend. With volume remaining consistent and interest fr
MUBARAK/USDT Ready to Explode? Final Compression Phase?
📊 Complete Technical Analysis – 12H Timeframe (BINANCE)
The MUBARAK/USDT pair is currently in a tight consolidation phase, forming a classic Symmetrical Triangle pattern. This structure indicates mounting pressure from both buyers and sellers, typically leading to a high-volatility breakout once t
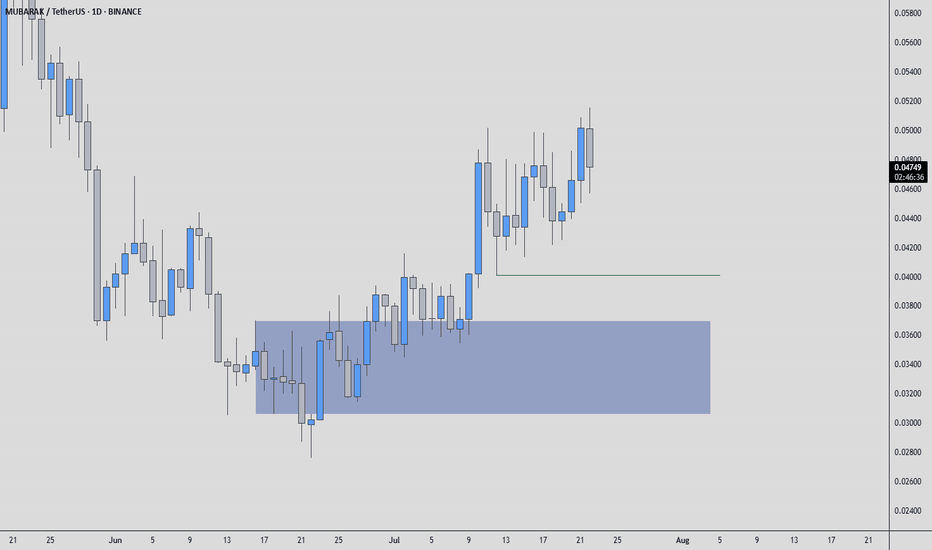
MUBARAKUSDT: Mid-Term Analysis🕌 MUBARAKUSDT Analysis
I think you can find a buyer from the blue box I’ve marked.
📍 Plan
If price comes into the blue box:
✅ Watch for footprint absorption (buyers holding the level)
✅ Look for CDV support or bullish divergence
✅ Wait for structure reclaim to confirm entry
⚡ Reminder
No chasing,
MUBARAKUSDT Forming Bullish WaveMUBARAKUSDT is starting to attract strong attention from traders and investors alike, thanks to its clear bullish wave pattern that suggests a significant upside move may be on the horizon. With good volume supporting this structure, the market is showing healthy participation, indicating that both
MUBARAK Analysis (12H)Note: This is a risky and highly volatile meme coin.
It appears that the bullish X wave has ended at the point where we placed the red arrow on the chart, and the price has now entered a corrective phase once again. This correction seems to be forming a diagonal pattern, and we are currently in wav
Mubarak Falling Wedge & Reversal Candle, Simple TradingAnother good chart setup, trade-opportunity, fully based on TA: MUBARAKUSDT.
The classic falling wedge is present on the chart, a perfect one.
The last candle that closed resulted in a reversal signal with increasing volume, also a higher low compared to April and May. Perfect market conditions. T
MUBARAKUSDT Forming Falling Wedge PatternMUBARAKUSDT is currently showcasing a classic falling wedge pattern, a widely recognized bullish reversal setup in technical analysis. After a period of steady decline within converging trendlines, the price appears to be approaching a breakout point. This pattern often signals a shift in market mom
MUBARAK - Last Trades were BeautifulThis coins has really nice reactions to Fib and volume. Honestly this is one of my simplest coins. So nice reactions to fib and Vol
There is a really nice Short possibilities on those yellow marks. Lets see, what happens to volume if we reach there.
- There are very interesting confluences there. 2x
$MUBARAKUSDT Long Trade Setup Setup 1h ChartLooks like price is respecting the ascending trendline well, showing strength at key support levels.
Here’s the plan:
- Entry Zone: $0.0580
- Stop Loss: $0.0548
- Targets:
• TP1: $0.0740
• TP2: $0.0883
As long as the price holds above the trendline, we may see a strong move toward the upside.
Br
See all ideas
Summarizing what the indicators are suggesting.
Oscillators
Neutral
SellBuy
Strong sellStrong buy
Strong sellSellNeutralBuyStrong buy
Oscillators
Neutral
SellBuy
Strong sellStrong buy
Strong sellSellNeutralBuyStrong buy
Summary
Neutral
SellBuy
Strong sellStrong buy
Strong sellSellNeutralBuyStrong buy
Summary
Neutral
SellBuy
Strong sellStrong buy
Strong sellSellNeutralBuyStrong buy
Summary
Neutral
SellBuy
Strong sellStrong buy
Strong sellSellNeutralBuyStrong buy
Moving Averages
Neutral
SellBuy
Strong sellStrong buy
Strong sellSellNeutralBuyStrong buy
Moving Averages
Neutral
SellBuy
Strong sellStrong buy
Strong sellSellNeutralBuyStrong buy


