GOLD BULISHHello, I hope you are well today. Gold will likely rise. I advise you to buy into your positions.
FGLD1! trade ideas
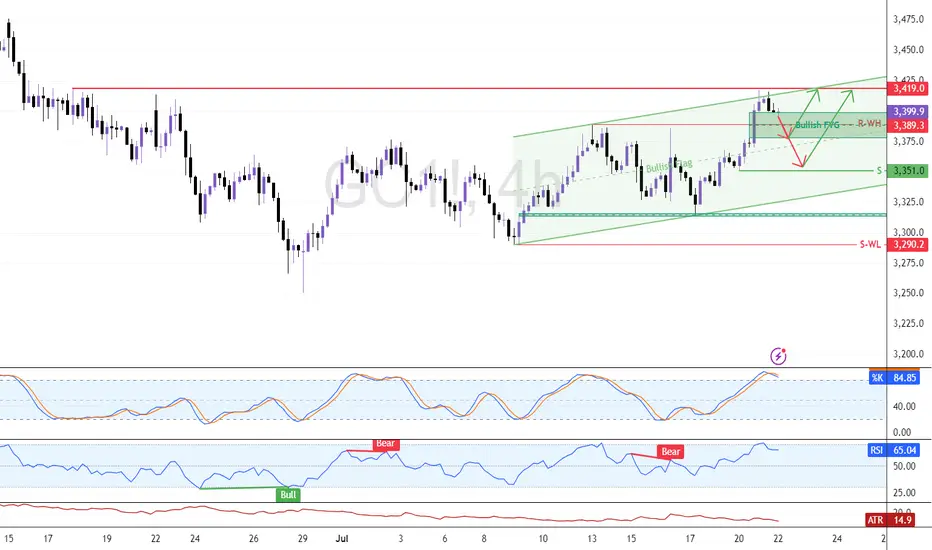
Eye These Levels to Go Long On GoldFenzoFx—Gold remains bullish but eased at $3,419.0 resistance. The Stochastic at 85.0 suggests a pullback may follow. Traders can watch support at $3,389.0 for short-term scalping.
Swing entries may emerge near $3,351.0 if bullish signals appear, such as candlestick patterns, structure breaks, or fair value gaps. Updates will follow if price reacts to these levels.
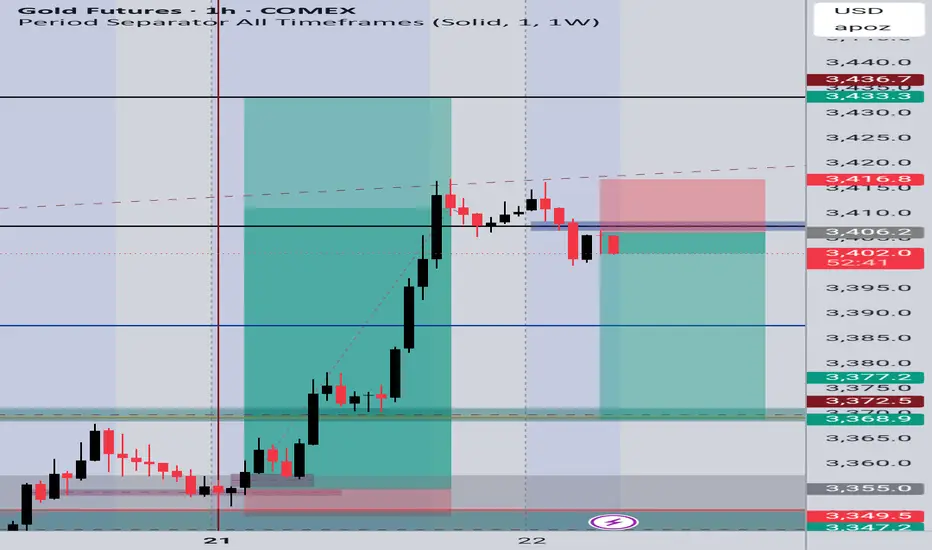
Gold Futures (GC1!)Gold Futures (GC1!) 1H – Bearish Rejection Setup
Price showed a strong bullish impulse followed by a rejection near the 3,416 resistance zone, forming a lower high and signaling potential exhaustion of buyers. After grabbing liquidity above the previous high, it failed to hold above the zone and retraced back below a key structure level around 3,406.
This setup aligns with a classic breakout and retest, now acting as resistance. I entered a short position after confirmation of bearish price action, targeting the demand zone around 3,372–3,368. Stop loss is placed just above the high at 3,416.8.
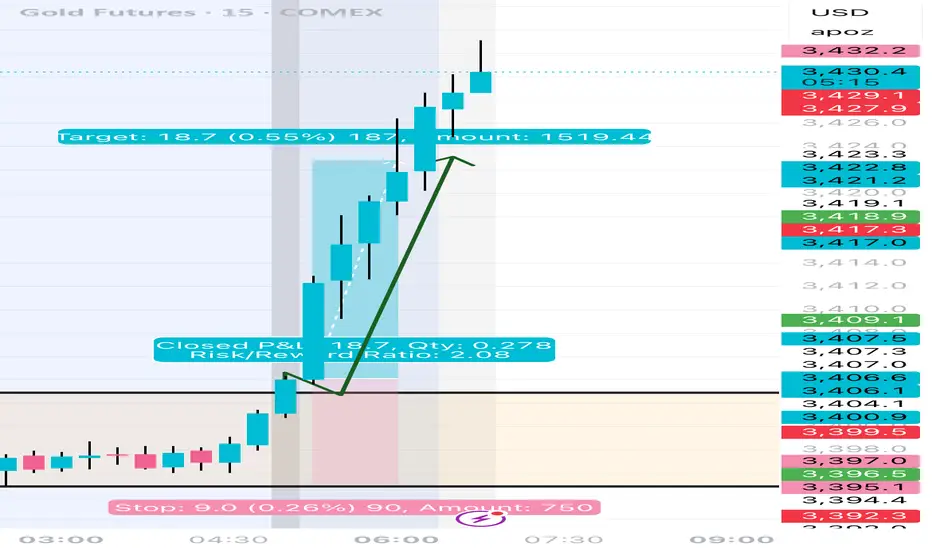
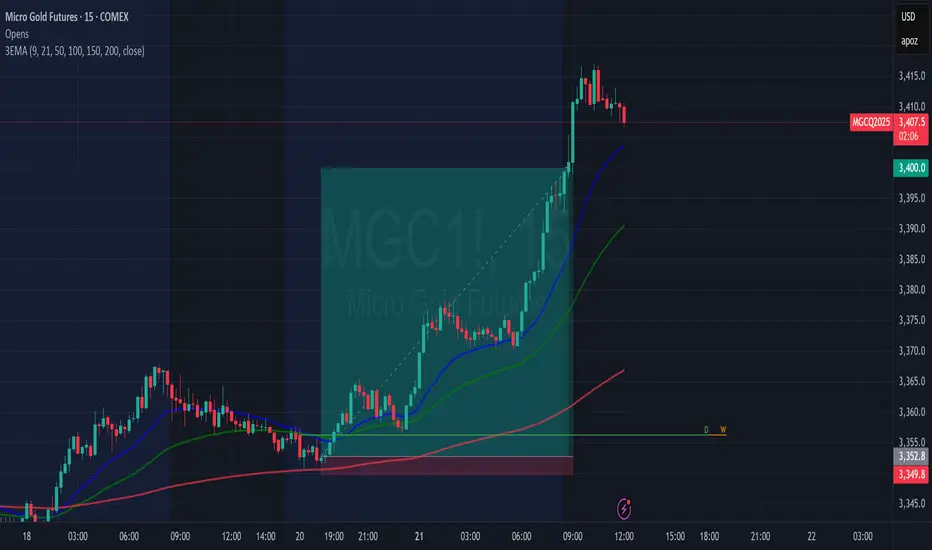
Gold 3400 target hitTook profits on 2/3 of the position at 3400. The monthly was holding above all three last monthly closes which suggested Bulls were in play
GOLD - Lovers Elliott wave - looking strong Short/Medium termGOLD-----Daily counts indicate Excellent bullish wave structure.
Both appear to be optimistic and this stock invalidation number (S L) wave 2 low
target short / long term are already shared as per charts
correction wave leg seems completed (C)
Investing in declines is a smart move for short/ long-term players.
Buy in DIPS recommended
Long-term investors prepare for strong returns over the next two to five years.
one of best counter
Every graphic used to comprehend & LEARN & understand the theory of Elliot waves, Harmonic waves, Gann Theory, and Time theory
Every chart is for educational purposes.
We have no accountability for your profit or loss.

$GC/Gold Elliot Wave Analysis Update - 7/21Hello fellow gamblers,
Both scenarios that we are watching are still valid and as price approaches a confirmation level, we do gotta be aware possible fakouts as we trade inside a flag/wedge pattern.
- A rejection of 3408 could drive us towards the other end of the pattern and a possible break to the downside.
- If we do have a rejection, I will be watching for price to find support at 3370 for my bullish bias.
- Levels to watch: 3408, 3346, 3283

GC Outlooklooking to for a continuation into 3390. then look for a retracement back towards the 50 ema. this will set up a push to the previous all time high. now keep in mind the fluid dynamic of the market based on the ever changing fundamental landscape, tariffs and other news that can shake the market. but the over all picture remains very bullish for gold
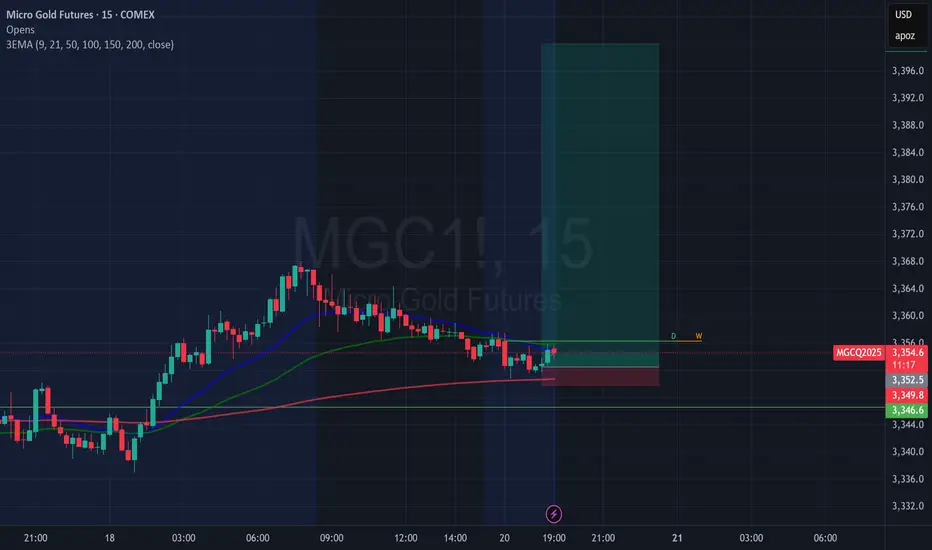
Gold Long for Weekly Open to 3400Since Bulls are holding above the last 3 monthly closes. Looking good for Bulls to 3400 and possibly higher given enough time
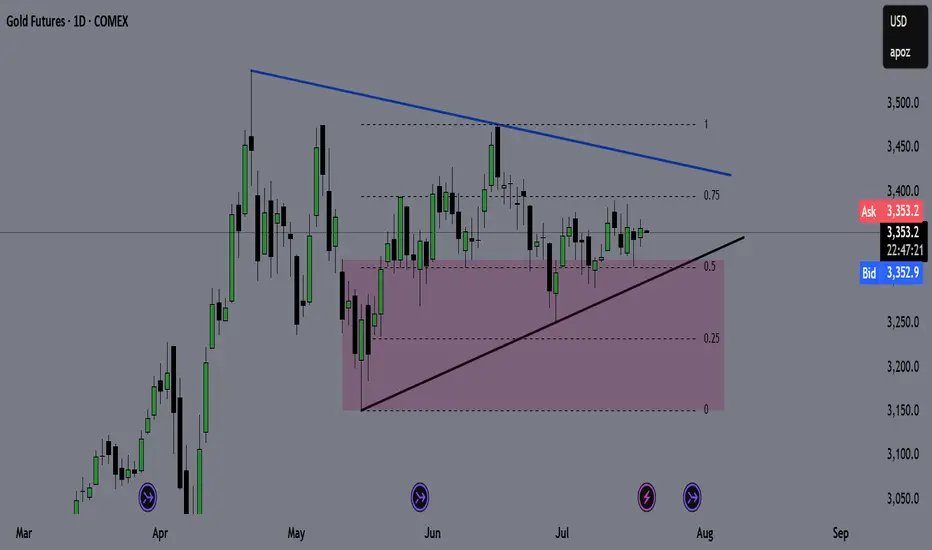
GOLD (GC) Weekly Recap & Game Plan 20/07/2025🪙 GOLD (GC) Weekly Recap & Game Plan
📊 Market Context:
Price is currently forming an accumulation pattern.
The purple zone marks a key weekly demand zone, and I expect a potential bounce from that level.
I'm closely watching for trendline deviations to determine the directional bias.
🎯 Game Plan:
If price drops below the trendline and bounces from the weekly demand, I’ll look for longs targeting the bearish trendline.
If price taps the bearish trendline and shows clear rejection, I’ll look for shorts targeting the bullish trendline.
I'll wait for LTF confirmations before entering any position.
✅ Follow for weekly recaps & actionable game plans.
Looking Over Gold Expectations for the coming Week!Last week had a solid play of moves. Ultimately closing out around 50% of its overall movement. Looking for price to continue with more bullish activity as we come into a new week. Keeping in tune to find areas I can take advantage and get active.

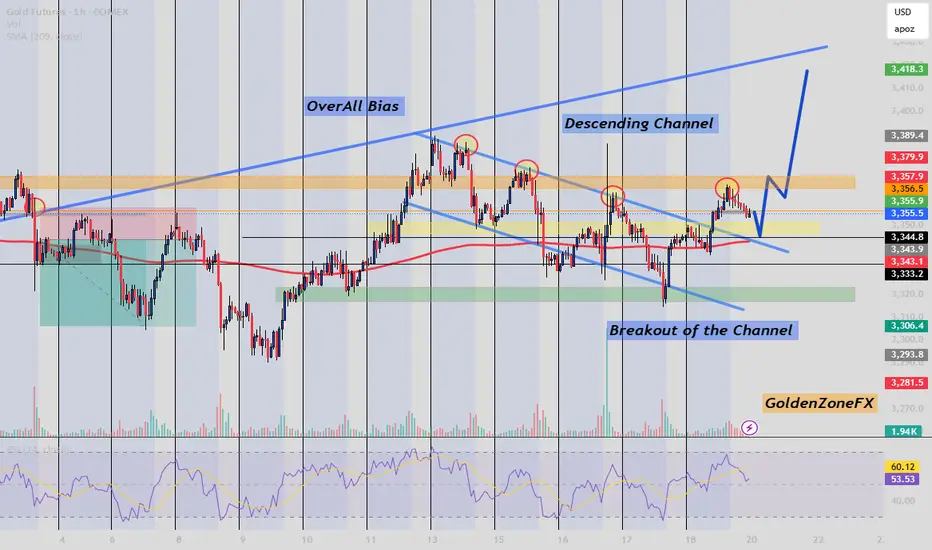
GC1! Breakout Confirmation & Bullish Continuation Potential Gold Futures Analysis – Breakout Confirmation & Bullish Continuation Potential
After an extended consolidation within a descending channel, Gold has successfully broken out, aligning with the overall bullish bias evident from the broader market structure.
Key Observations:
Overall Bias: Bullish, supported by higher-timeframe structure and trendline confluence.
Breakout Confirmation: Clean breakout above the descending channel, showing increased bullish momentum.
200 SMA Flip: Price reclaimed the 200-period SMA, reinforcing a shift in sentiment.
Key Zone Retests: The market is expected to retest the previous resistance (now support) around the 3345–3350 zone before any continuation.
Volume & RSI: Rising volume and RSI above 50 support further bullish continuation, with a short-term target toward the 3418 region.
Plan Ahead: I anticipate a short pullback to the support zone followed by bullish continuation if price holds above the breakout structure.
Follow @GoldenZoneFX For more content and valuable insights.
Sweep On levels and Confirmation of Bullish pressure! Now that we have a sweep on levels we are looking for bullish pressure to continue. They have closed the 4Hr bullish. Being that it is Friday keeping expectation low cause price can break out and push hard or it can end up being Rotational. I feel there is a move here. We just have to wait for it to line up inside of the killzone. NOFOMO Mayn!

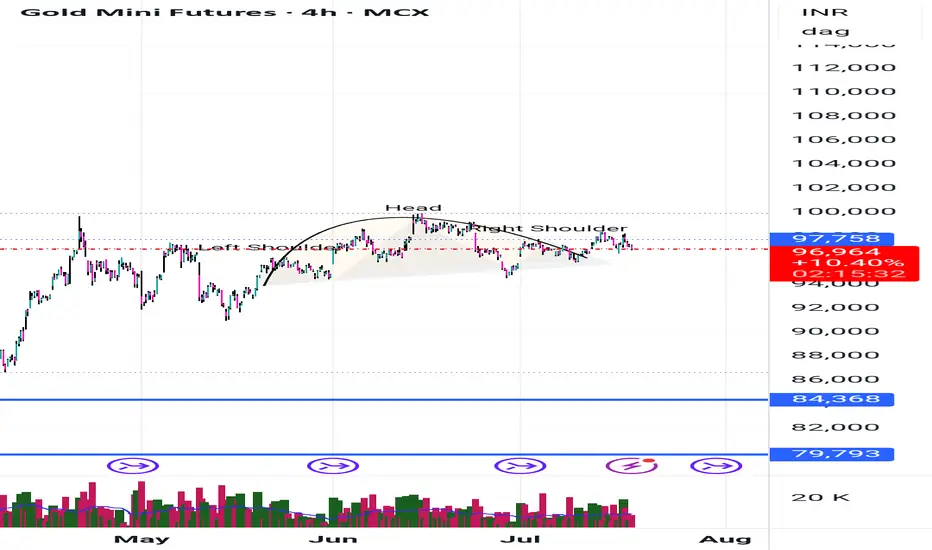
Gold might be possible can see a short side. A clear formation of Head and Shoulder, Cup and handle formation in 4 hourly chart
It might be possible that we can see a big short. THIS format is similar to nifty 50
Gold Futures ($GC1!) — US Session Setup: Bearish Retest from 618🟡 Gold Futures ( COMEX:GC1! ) — US Session Setup: Bearish Retest from 0.618 Fib in Bullish Breakout Context
⏳ Pre-US Session Playbook
We're currently watching Gold Futures ( COMEX:GC1! ) for a potential short opportunity into the US session open. While the broader structure has broken bullish, we're anticipating a bearish retest scenario from a key Fibonacci level — aligning cleanly with last week’s breakout structure.
No positions have been taken yet — we are setting up for the US session — and are closely monitoring price action near the 0.618 retracement zone before committing.
📍 Setup Breakdown
• 0.618 Fib Retracement from the last bearish impulse aligns with:
○ Recent volume shelf resistance
○ Retest zone from prior breakout
○ An overextended local push into thin volume above 3380
• Bullish Context:
○ HTF breakout from descending wedge structure remains valid
○ Macro buyers still in control
○ Upside continuation risk is high if sellers don’t show up
• Short Bias Conditions:
○ Rejection or absorption in the 3385–3390 zone
○ Weak follow-through above 0.618 (failed breakout scenario)
○ Breakdown of LTF higher low structure post-test
🧠 Strategy Commentary
Although we’re in bullish breakout mode, this is a tactical short setup — a fade into prior structure with clear invalidation. We're not fighting trend, but looking to short into exhaustion at a defined level, with tight risk parameters.
Confluence Factors:
• 0.618 fib alignment
• VRVP volume shelf
• Prior breakout structure retest
• LTF divergence or absorption confirming the fade
🎯 Trade Parameters (Planned)
• Entry Zone: ~3385–3390
• Stop Loss: Tight, 3395–3400
• Target Zone: 3342–3337 (full structure retest)
📌 Patience is key — this remains a setup until confirmed. We'll post live if and when conditions are met.
Let the market come to you.

Why says they want to short gold again, line up in hereLol, so far whales keeps manipulating the price to stop me out 🙄.
Nah, fr, i will short gold again today for sure, iam just waiting to see a confirmation that this is even the right decision.
But so far it looks massively short, it could yield anything from 1:3, or 1:4. Depends on the setup.
Wait for confirmation, will make sure that whales dont get me this time. LOL
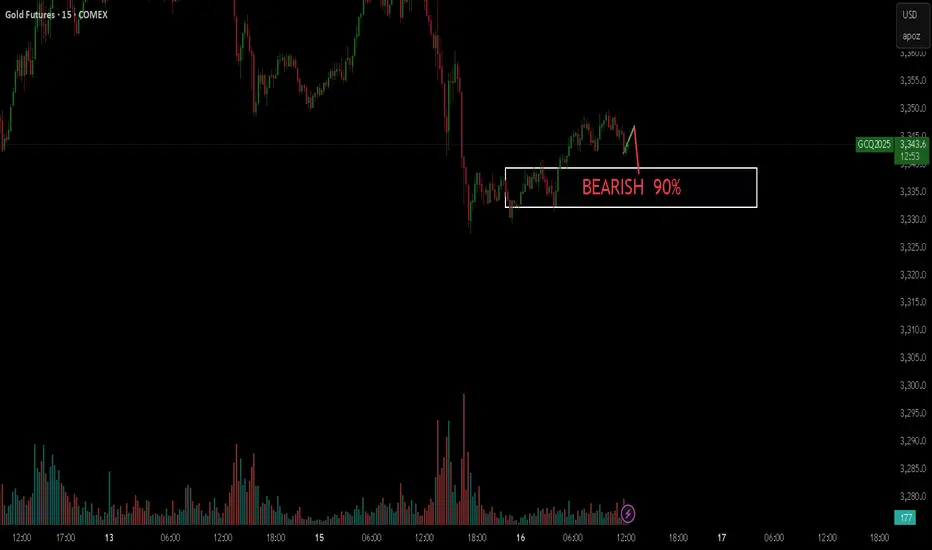
GOLD BEARISH 90%Hello,
I see a very high probability that the gold market will fall in the short term.
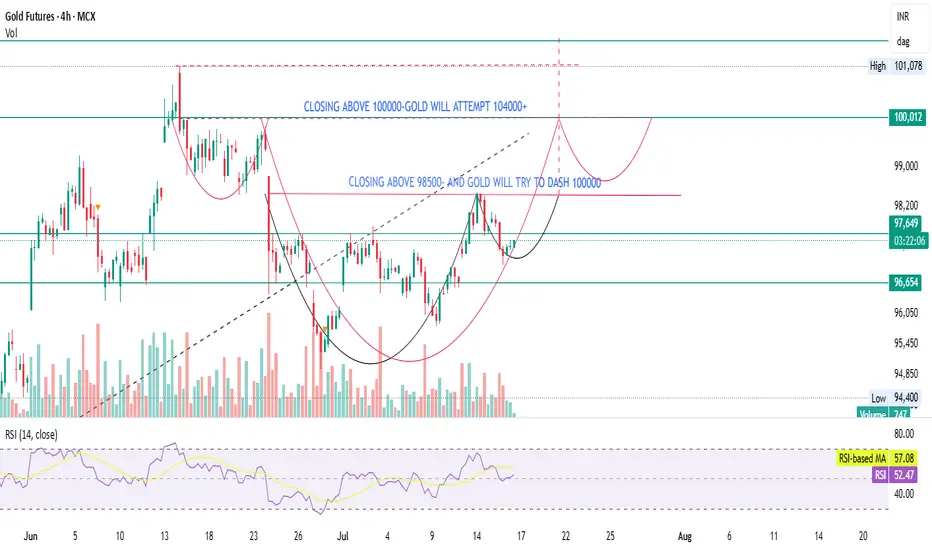
GOLD- CONTRARION OPINIONGold is forming a bullish structure, but a confirmed breakout above ₹98,500 (on volume) is essential for momentum toward ₹100,000.
If ₹100,000 is broken with strength, ₹104,000+ is a reasonable technical target.
RSI is neutral, allowing room for upside.
Watch for a volume spike and confirmation candles before entering.
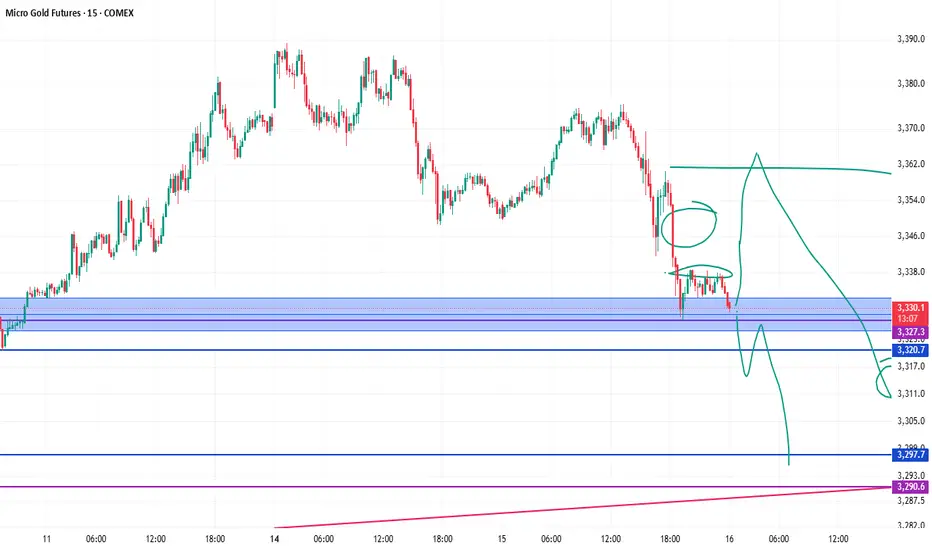
Beneath the Shelf Lies OblivionThis setup on MGC is a textbook example of what happens when structure, compression, and liquidity converge at a critical price shelf.
We’re currently sitting on top of a demand break zone near 3330, right at the intersection of a long-term ascending trend line and a descending supply-side compression line. This convergence zone is what I’m calling the Decision Point and the reaction from here will likely dictate the next directional leg.
Bearish Scenario – Breakdown Play
If price breaks and closes below 3330, I’m looking for a clean short setup triggered by:
- Loss of structure at the imbalance shelf
- No reaction from buyers at the previously defended zone
- Bearish pressure from HTF supply overhead (3385 zone)
- Momentum break from recent liquidity sweep at 3360
Trigger Entry: Below 3327 (post-break retest)
Stop: Above 3338 (invalidates reclaim)
TP1: 3305 (minor demand pocket)
TP2: 3285 (full move into HTF demand)
TP3 (optional): 3275 (tail end of imbalance)
Price would be transitioning from demand acceptance to supply dominance. The HTF supply above has been respected, and sellers remain in control if 3330 gives out.
Bullish Scenario – Reclaim Play
If price holds the 3330 demand shelf and reclaims structure with strength, I’m interested in a long position toward resting liquidity above.
Trigger Entry: Above 3342 (engulfing + reclaim of broken structure)
Stop: Below 3325 (demand failure = no-go)
TP1: 3360 (liquidity sweep)
TP2: 3385 (HTF supply retest)
If buyers defend this compression shelf, this could become a failed breakdown setup which often results in sharp squeezes. There’s also layered liquidity above 3360 from late sellers that could get raided quickly.
Let me put it in context:
HTF Zones Labeled: These areas are not just visual, they’ve driven major moves previously. I'm using them to anchor bias.
Compression Point: This is where your edge lies. Price is coiled between trendlines and major levels meaning the breakout will be decisive.
Volume Ignition Expected: Whether long or short triggers, expect strong follow-through due to the nature of the buildup.
No bias here just structure, zones, and execution plans. I’ll trade whichever side triggers first with confirmation, not prediction. This is the type of setup where patience pays more than opinion. Would love to hear how others are seeing this are you leaning with the shelf or looking to fade the break?

Gold Took the Bait Then Got Body BaggedThis afternoon I stepped outside my usual mechanical system and ran a classic: the Opening Range Breakout (ORB) on MGC just to see if gold still respects the old-school plays.
Marked the range of the first 15-minute candle, waited for the break and confirmation close, then entered on the short side.
Asset: Micro Gold Futures (MGC1!)
Timeframe: 15-Minute
Strategy: Opening Range Breakout
Session: NY
Bias: Short
Trigger: Bearish 15-min close below the ORB low
Notes
ATR Expansion: Signalled volatility coming off the open (range >20 ticks)
Liquidity Trap: Gold swept ORB highs before dumping a classic trap-and-flush
Volume Confirmation: Delta turned aggressively negative at the break
Risk-Reward: Tight stop above range, clean 1:3 move into session lows
ORB: Dumb-Simple, Still Deadly
ORB is one of the simplest tools in a trader's playbook and that’s what makes it dangerous (in both directions). When it works, it works. You define the opening range, wait for price to break out and confirm, and ride the move.
But here’s the nuance:
Gold LOVES to fake one side before exploding the other. It’ll sweep liquidity, bait breakout traders, then detonate in the opposite direction. Today was a textbook clean sweep of ORB highs, then a brutal reversal and breakdown.
I usually lean on mechanical, model-based strategies, structured entries, rule-based exits, logic-driven setups. But I’m not blind to price. Having a few flexible strategies like ORB in the toolkit gives you options on days where market intent is obvious. So… does ORB actually work? Here's what the research says:
- Al Brooks (Price Action Trading)
ORB-type plays win 55–60% of the time when confirmed with price action and managed properly.
- Linda Raschke (Street Smarts)
ORB entries rated highly during volatility expansions especially in futures.
- Quantified Strategies (S&P 500 ORB backtest)/b]
57% win rate with basic 1:1 R:R and no filters.
Internal Bookmap/Tradovate tracking on MGC .
Fake outs occur in 30–40% of ORB plays, especially during thin liquidity or low-news days. But let’s be real that 55–60% win rate is open to interpretation. It depends on the confluences. Are you using delta confirmation?
Are you filtering by session or volatility? Are you waiting for a close outside the range or just guessing? ORB works if you work it. The strategy isn’t magic. The execution is.
The twist with today wasn't a "trend continuation" move. It was a rejection. Gold baited breakout longs, then pulled the rug. This is where mechanical structure meets tape intuition.
Retail chased. Price snapped. Quant stayed calm and shorted the flush.
What Do You Think?
Do you still trust ORB? Or is it a trap most days? Do your stats back it up or have you evolved beyond it? Let’s open it up. Drop your ORB rules, tweaks, or horror stories below. I’ll reply to every serious one.

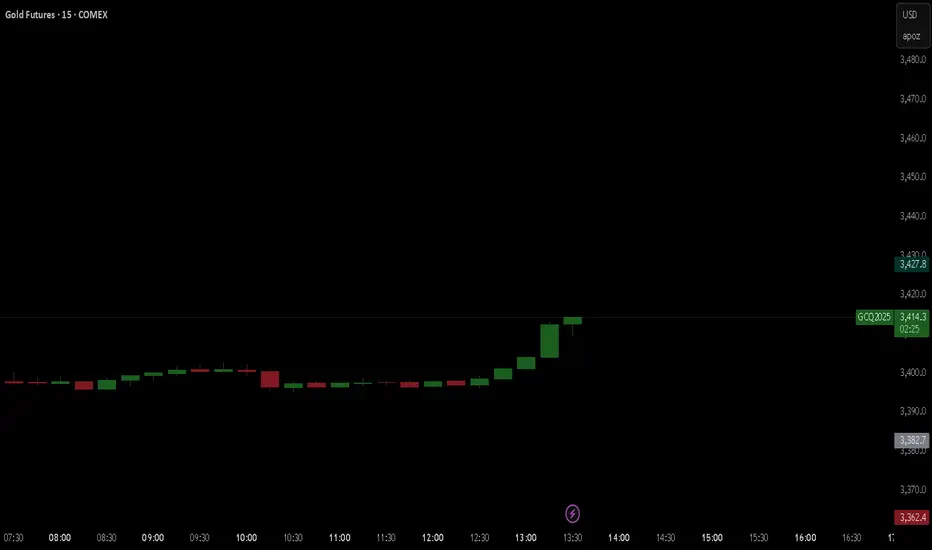
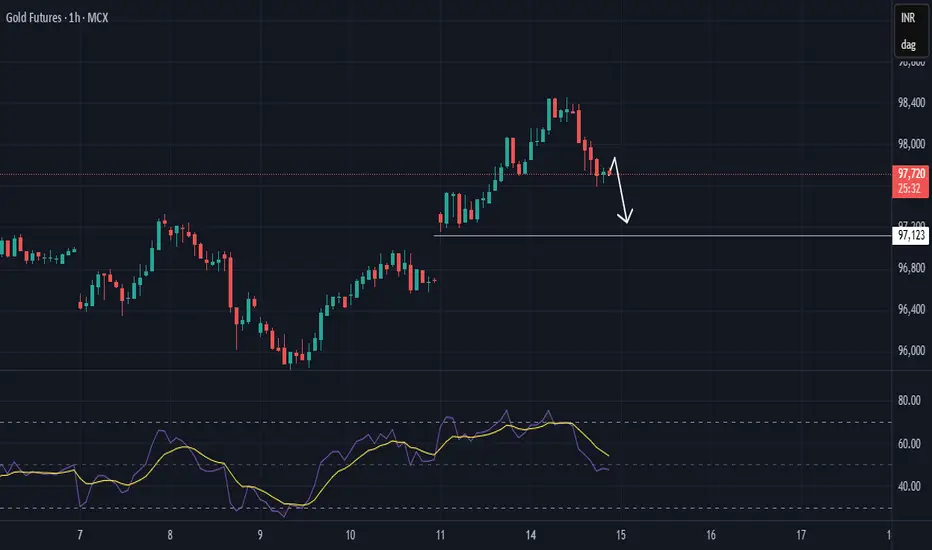
Proposed Next move in gold hourly basisProposed Next move in gold hourly basis, this study is published for educational purpose and not at all a trading suggestion.
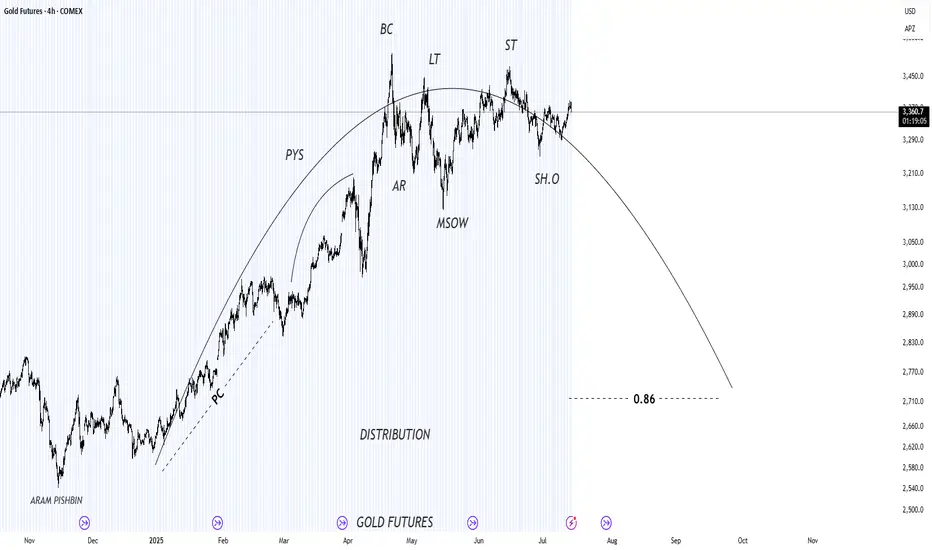
xauusdtCOINBASE:GOLQ2025
Gold analysis on the 4-hour time frame in the Wyckoff style, which is in a changing trend, thanks to the esteemed professor, Mr. Ramtia Siddiqui
$GC / Gold - Weekend Update - 7/14Hello fellow gamblers,
We got both scenarios still active on gold, and I am bringing an update on both of them. It is a longer video, but hopefully the information can help you out on your trades.
- I want price to stay above 3363 for a bullish continuation.
- A strong rejection or loss of 3342.8 could initiate a bearish move that will validate our bearish scenario.
- Level to watch: 3418, 3363, 3283
