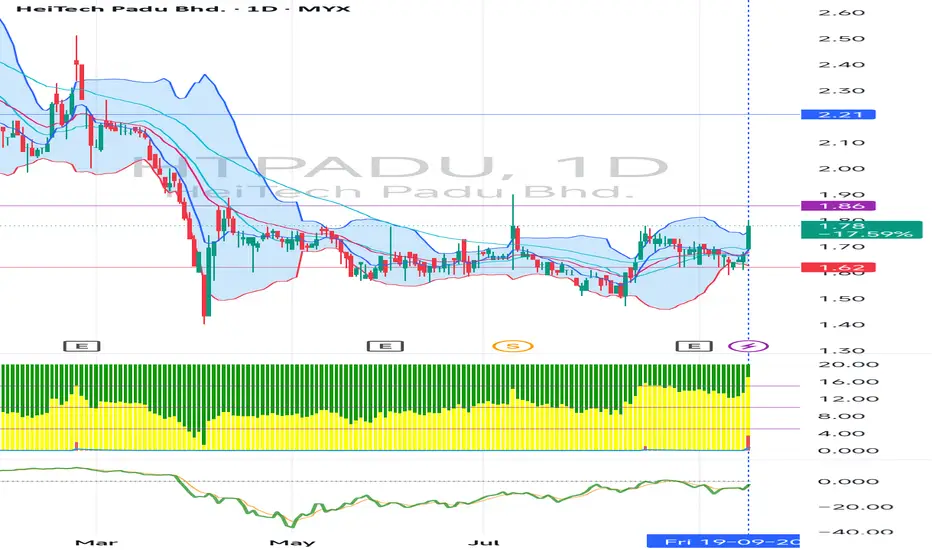
Is HTPADU will change trend to uptrend?From the chart we can se HTPADU is consolidated for a few months now.Is it going to change trend we can wit an see. TP:2.21,BO:1.86,SL:1.59
HeiTech Padu Bhd.
No trades
Market insights
HTPADU- need to retrace more to make another move
- good triangle to break
- my opinion will go higher next week

ohtpadu 842022how to detemine or read this MS.
some one can explain.
the price still can go lower
for better RRR , can wait till the price go lower
remember ...in trading MM is very importante.
Pls dont ALL in
TAYOR
Salam JUmaat

HTPADU: Targetting 1.50 soon!Based on technical analysis, I'm expecting HTPADU will test near resistant level @ 1.500 soon! This is a high probability profit stock and screening was done using a trading view screener.
TAYOR!

HTpadu - snr and snd set upGood charting to follow
Low time frame created new HH potential as trend reversal
Make your own judgement

Pattern BreakoutWaiting for VCP Pattern Breakout. Weekly already form Saucer since 2006. Hopefully break the VCP for long trade. Target price to BO - Rm1.80.

HTPADU - Ascending TriangleMy Trading Plan :
Resistance : 1.80
Entry Price : 1.81
Cut Loss : 1.79
Please leave a like and comment if this helpful to you :)


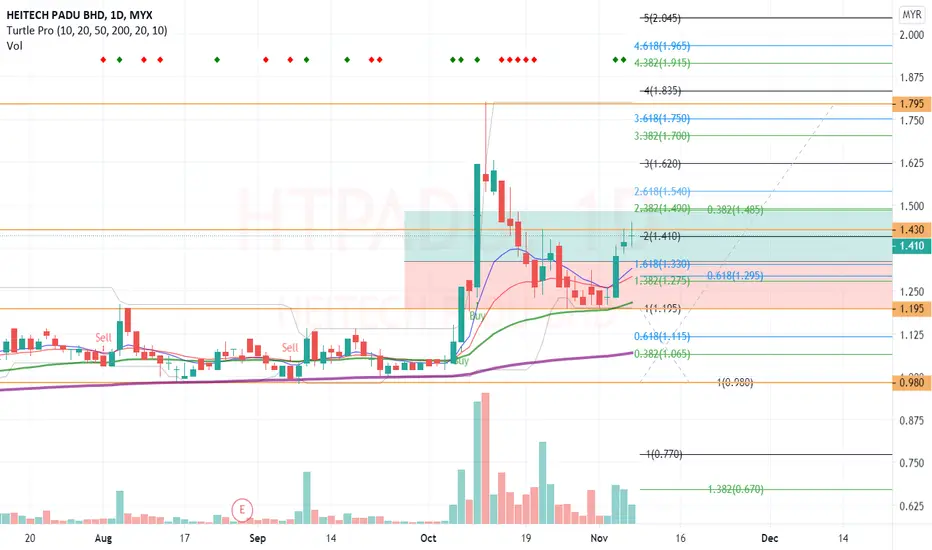
Breakout ConfirmationHTPADU is edging higher, breaking key resistance at 1.43 which was preceded by a Golden Cross and a reversal V-bottom pattern. Momentum is building up, signify the price is likely to rise further to our Fibonacci target level 2.618 at 3.09. It may meet resistance level at 2.04 on the way up. In the opposite scenario, the movement below 50-period MA will push the price lower.
Disclaimer: The content on this analysis is subject to change at any time without notice, and is provided for the sole purpose of assisting traders to make independent investment decisions.


potential to shortfrom 15 min chart seller are still in range and there is no sign of buyer enter the market

will it drop to 1.33 or up the way to 1.50 UPTREND
low volume
might hv a reduce to 1.330
waiting there to buy near support FIBO
R 1.5
SL 1.2
buy 1.33
TP 1.48
Ratio 1:1
HTPADU - Padu kah ia?Harga close hari ini di atas EMA9 dan EMA21. 1st Golden cross berlaku semalam. Hari ini 2nd Golden cross pula berlaku tanda sudah berlakunya pullback.
Harga yang akan dituju base on FIBO adalah pada 1.505.
#Idea
#SekadarKajian
#BukanBuycall

Pennant Pattern1. Bullish pennant or bearish pennant ?
2. Will it continue go up or went down ?
3. Put in your WATCHLIST and MONITOR


2/6/2020. Bursa Malaysia. HTPADU berpotensi untuk kenaikan paduBerpotensi untuk short swing dan mid swing
Dari segi FA
- PE > ROE
- Market volatile kerana hanya mempunyai 101.23juta jumlah share
- Sektor teknologi (Digital services)
Dari segi TA (menggunakan indikator sendiri)
- Candle masih dalam keadaan hijau untuk daily chart
- Entry 1.060
- CL 1.030
- TP1 1.18 , TP2 1.22
- RRR = 1:2.75 , 1:3.75
(Dibawah ialah candle bagi daily chart)
Jika mahu menggunakan indikator saya, boleh private chat saya

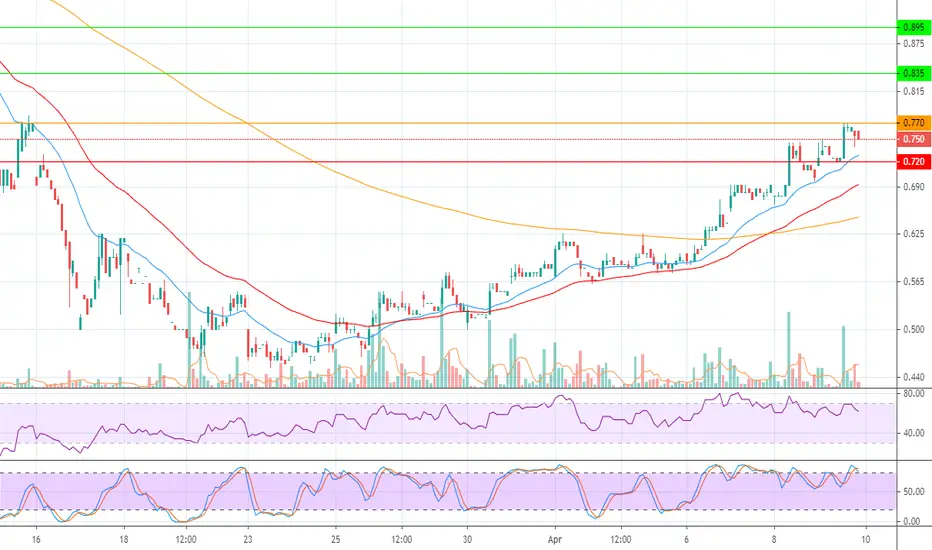
HTPADU: Trading BuyNicely rebounded at 0.77 area. Lets target for 0.81. I set tight cutloss at 0.735 to protect my profit from previous trade. Btw, Congrats to those who followed my previous analysis on HTPADU.

HTPADU: Potential BuyJust breakout trendline. Buy above 0.725. Cutloss if fall below 0.685 with take profit target at 0.77, 0.835.

HTPADU: Potential BuyBuy upon breakout 0.77. Cutloss if fall below 0.72 with take profit target at 0.835.
16 Feb 2020 Saham kajian minggu ini: HTPADU oleh Sharina Yusop16 Feb 2020
Saham kajian minggu ini:
HTPADU oleh Sharina Yusop
Aliran menaik
Patuh syariah
Mempunyai FA yang baik
Teknik belian : Seperti mana diberi di dalam carta
Selamat berdagang

<TradeVSA> Heitech Padu gap up with high volumeStrength in the chart:
1. Pullback after breakout
2. High volume in hourly chart
Send us your preference stock to review based on TradeVSA chart by comment at below.
Disclaimer
This information only serves as reference information and does not constitute a buy or sell call. Conduct your own research and assessment before deciding to buy or sell any stock


