IFCAMSC - Analysis for potential price movement N wave with E, V, N & NT projection.
The price is above the Kumo, indicating a bullish trend.
The Tenkan-sen is above the Kijun-sen, signaling bullish momentum.
Chikou Span is above the price candles and the Kumo, supporting the bullish bias.
The price has closed above a critical resistance zone (gap closure region), confirming bullish progress.
The price is at 0.685, moving into the gap closure area, which could serve as a magnet for price action.
Breakout above 0.720 (NT level) is critical for further bullish momentum.
Immediate resistance levels: 0.720 (NT), 0.745 (V), 0.775 (N), and 0.840 (E).
Immediate support levels: 0.660 (gap support) and 0.640 (upper Kumo edge).
Enter a long position if the price breaks above 0.720 (NT level) with strong volume.
Alternatively, wait for a pullback near 0.660–0.670 (gap support zone) for a better risk-reward setup.
Place a stop-loss below 0.640 (upper Kumo edge) to manage downside risk.
Volume Confirmation: Ensure the breakout above 0.720 (NT) is supported by significant volume.
Risk Management: Adjust position size according to the stop-loss distance and ensure the reward-to-risk ratio is favorable.
52-Week High: Monitor price action if it approaches the 52-week high, as this could act as psychological resistance.
Note:
1. Analysis for education purposes only.
2. Trade at your own risk.
IFCAMSC trade ideas


IFCAMSC was triggered based on the MRV1 on 20 Dec 2023The IFCAMSC buy signal was triggered based on the MRV1 setup at RM0.285. The target is a 20% increase to RM0.345, with a stop loss of RM0.255. This is expected to take 2–3 months due to the signal being based on the daily timeframe.
The price seems to have been hopping around the price of RM0.280, establishing an accumulation base price for the counter. A price spike to reach its near resistances of RM3.05 and RM0.335 is likely in the near term. Support is seen in the RM0.250, with RM0.220 as the next support.
**This is for discussion purposes only and is not a buy/sell call**

Possible reversal for IFCAMSC Tech rally today is quite strong and most of the tech related counter rebound today.
IFCAMSC also follow the market and we could see some support at RM0.32 RM0.325
Look for short-term play.


Trading Idea IFCAMSC (10/02/2021)Trading Idea IFCAMSC (10/02/2021)
- Buy near support (EMA50)
- Target and stoploss as drawn
Disclaimer: This trading idea is strictly intended for informational purposes only so please do your own analysis before making any investment decision.

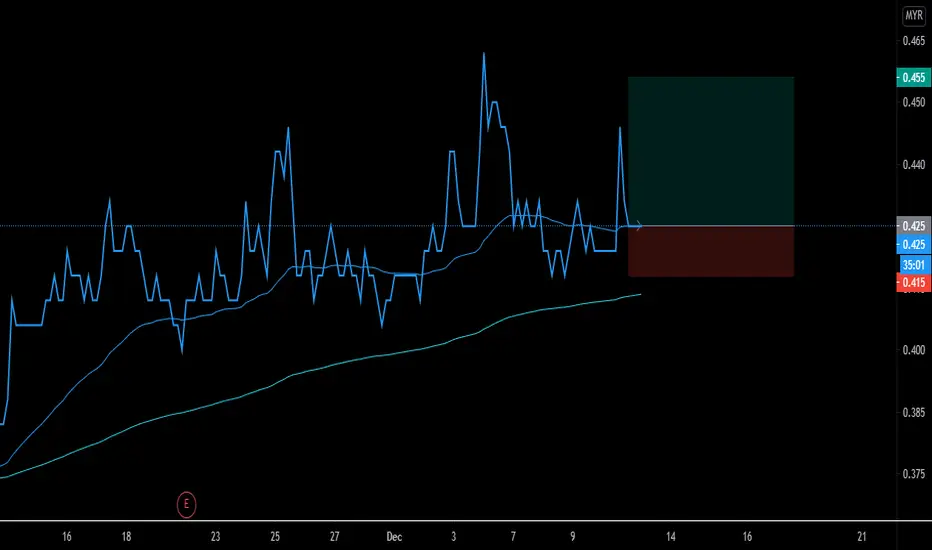
IFCAMSC AnalysisDisclaimer: This is not a buy call but for learning purpose
Technical analysis
Potential rebound as price at EMA 20
Volume - Not so good. No accumulation volume
Trading idea
Entry price: 0.420
Cut loss: 0.400
TP1: 0.465

IFCAMSC support at EMA50I put this stock on my watchlist and place my entry here. With a support level of EMA 50 is a good reason to buy this counter.
IFCAMSC [10 December 2020] Buy On Dip in Support ZoneMYX:IFCAMSC
SWING: 2 DAYS TO 2 WEEKS
Breakout Downtrend Line
52 Weeks High Line
Fibbonaci Retracement
Candlestick Support & Resistant Zone
Trendline Support & Resistant

IFCAMSC - STOCK TO AVOID - RETEST 0.17 IS POSSIBLEIFCAMSC, suggests to avoid this stock.
There is high possibility the price will retest 0.17 level suppors before ending the big W-X-Y-X-Z corrective waves. The bouncing off from 0.17 level in the past does not show any impulse reversal waves.
Stay aside.


IFCA: Enemies at .50 border.After successfully breaching enemy defense at .33-.34 border, IFCA continues to march forward only to be halted by quite a strong enemy force at .49-50 outpost.
IFCA had fallback to resupply at the previous defeated defense of .33-.34 and is now ready to launch a full frontal to penetrate that heavy defense at .50.
If it manages to breach that defense, the road is cleared for IFCA to continue its march toward the next line of defense at .575.
However, if the enemy force is still strong, IFCA might need to resupply once again.
DISCLAIMER: This is not an investment advice nor a buy call. This is just some analysis of based on some technical factors coupled with just a little or totally nonexistent fundamentals. This analysis is based on lagging (past) data (ie historical prices) thus any forward looking statement is just based on perceived highly probabilistic assumption(s) to assist personal trading decision.

EASY123 Prediction @MYX IFCAMSCPrediction: Bottom Rebound from Correction (Rally when it breaks 0.40)
Target Price: R1=0.43-0.44, R2=0.49-0.51, R3=0.58-63
Support/Cut Loss: S1=0.37, S2=0.35
*Trend direction: Bottom Rebound - Higher-High & Higher-Low positive movement
*Price moves strongly above our Lifeline (Redline)
*Yellow-diamond observed 11-Sep & 07-Oct, signal the bottom.
*White-diamond has appeared on 09-Oct, an indication of the strong buying momentum.
*Disclaimer: This is not a Buy or Sell suggestion but solely sharing the information...Trade at your own risk.
*Preference Strategy: Swing trading (Follow the BUY/SELL Signal respectively).
*Reminder TP & CL is an individual preference & decision. No fixed rule or guideline for it.
*If you are interested in our trading template. Feel free to drop us a message, we are happy to share with you.
Signal's Interpretation:
BUY Signal:-
*Green-Background = Uptrend
*BT-Yellow-Diamond = Bottom signal.
*Green-Upward-Triangle = Potentially a Bottom signal.
*White-Diamond = Strong upward momentum accelerator.
*White-Candle = Turning point or a trend reversal.
*Yellow-Candle + Alert-Bell = Potential Price take-off area.
SELL Signal:-
*Red-Background = Downtrend.
*Red-Dot = Potentially a Top signal.
*Blue-Candle = Potential price selling off area.

Bullish Newly-ShariahThe share is recently trading in a rangebound between 0.16 and 0.56, However we noticed a double bottom reversal pattern on Mar 2020 and the price has significantly break a valid downtrend line hence increase our optimism. If the price could break above the rangebound, our target is at 0.77. We will see how the price react on this level before holding the position to 1.12. A close below this rangebound would change our view to bearish .
FA looks good. Semoga bermanfaat.
Disclaimer: The content on this analysis is subject to change at any time without notice, and is provided for the sole purpose of assisting traders to make independent investment decisions.

Buy on Breakout with themeIFCAMSC
Buy on Long Term Trendline Breakout
Entry Price 0.45
TP1 0.47
TP2 0.50
Theme: GST Relaunch RUMOUR + Politic

let test run on it uptrend
3 day volume sell
banker chip up
support at 0.4
can enter to 0.43
sl 0.39
tp 0.45 , 0.47

<TradeVSA> IFCA - Reversal Completed...Ready for Resistance !1. Accumulation Stage
- NS as support
- LIne Change high volume indicating buyer in accumulation
2. Shakeout to remove weak-hand holders
- A wash with Spring before test resistance in accumulation
3. CoC Setup follow by NS signal
- Reversal completd with CoC
Hit the "LIKE" button to support us :)
Disclaimer
This information only serves as reference information and does not constitute a buy or sell call. Conduct your own research and assessment before deciding to buy or sell any stock


iFC WAIT THE fIFT , FAST TURTLE 0.345- 0.37 IS THE BEST BUY time cos is at the Fib influence range
WAIT THE fIFT , FAST TURTLE

IFCAMSC - Rounding Up to Higher Sky#IFCAMSC
Rst: 0.475
Spp: 0.445
Green candle broke through above Fibo Extension 23.6%, with substantially strong volume emerged, the northward bending of BB will drive the stock further.

IFCAMSC - Well Consolidated Above 40 sen#IFCAMSC
Rst: 0.445
Spp: 0.40
Friday bearish formation being denied by today's green candle, this indicates the stock has forged good support at 40sen breakout level. Ripe for rebound.
