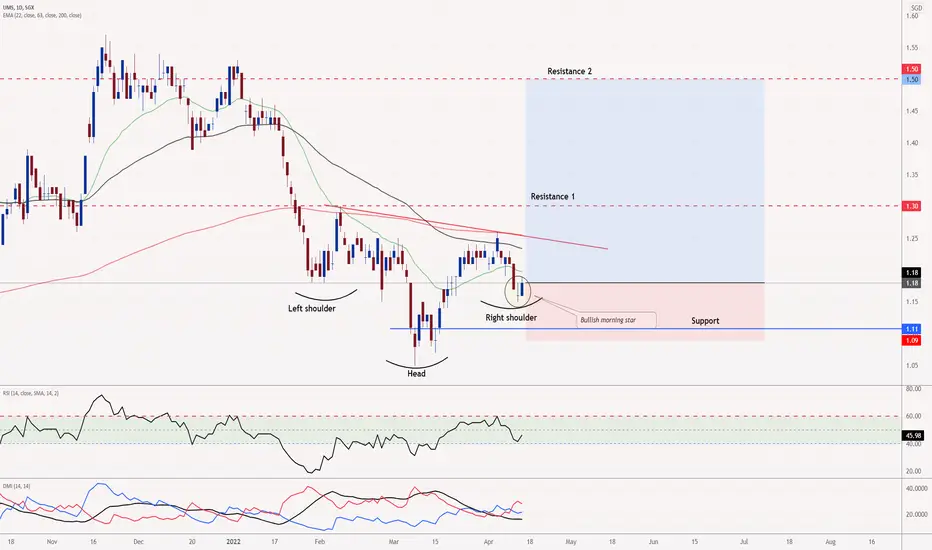
UNS Holdings - Inverted head and shoulder hints of an upsideUMS Holdings' bearish downside may have found it's bottom after an inverted head and shoulder pattern was spotted. Furthermore, on the right shoulder, the bullish morning star formation is said to be a strong bullish rebound.
Next report date
—
Report period
—
EPS estimate
—
Revenue estimate
—
0.19 MYR
133.11 M MYR
793.68 M MYR
579.96 M
About UMS
Sector
Industry
CEO
Andy Luong
Website
Headquarters
Singapore
Founded
1984
ISIN
SG1J94892465
FIGI
BBG01WDXWKC8
UMS Integration Ltd. is an investment holding company, which engages in manufacturing high precision front-end semiconductor components, performing electromechanical assembly, and final testing services. It operates through the following segments: Precision Component, Integrated System, and Others. The Precision Component segment offers precision machining, sheet metal fabrication, surface treatment, and sub-module assembly. The Integrated System segment deals with surface treatment and full module assembly. The Others segment includes the distribution of metal supplies, and water and chemical engineering solutions. The company was founded by Andy Luong in 1984 and is headquartered in Singapore.
Related stocks
UMS trend analysisUptrend, correction, 1.08 support level
Possible continuations:
1. Will go up TP1=1.18 TP2=1.30
2. Will break support and go down to 1.01

UMS (SGX: 558) LONGOverall:
1.Semicon themed stocks are in play
Fundamental:
1.Expected improved company growth and earnings despite COVID-19
2. Management generous in their dividend payout in the past
3. High net margin (30%)
Technical:
1. Broke and sitting at resistance of $1.
2. Uptrend for both 50MA and 20MA

<TradeVSA> Continuation on Mark-Up stage. UMS (558.SG)Strength signal in the chart:
1. Green pentagon high volume
2. Re-accumulation
Hit the "LIKE" button to support us :)
Disclaimer
This information only serves as reference information and does not constitute a buy or sell call. Conduct your own research and assessment before deciding to buy or sel


Bullish PennantPrice consolidating in a pennant after the bullish move. Wait for breakout of the Pennant.
Disclaimer: Not an advice to buy or sell.

UMS (Looks Legit To Me)Updated View On UMS (13 Mar 2019)
We had a strong breakout and it looks like a legit one,
We could see 0.82 easily soon and 0.88/0.94 will be next tgt levels.
DYODD, all the best and read the disclaimer too.
Feel Free to "Follow", press "LIKE" "Comment".
Thank You!
Legal Risk Disclosur

Stock Trade Ideas (SGX) - 24 Feb 20191. Yanlord - 18LC
2. YZJ - 18LC
3. UMS - Pentagon
Send us your preference stock to review based on TradeVSA chart by comment at below.
Disclaimer
This information only serves as reference information and does not constitute a buy or sell call. Conduct your own research and assessment before deci

Convergence + Bounce off resistance (Long)Base on the indication i can see convergence beginning to form which indicate a reversal. With the bounce off from resistance line we can clearly see it will be a bullish trend soon.
I will wait for better confirmation to start my trading plan :)
Please like / comment / follow on my trading plan

See all ideas
Summarizing what the indicators are suggesting.
Neutral
SellBuy
Strong sellStrong buy
Strong sellSellNeutralBuyStrong buy
Neutral
SellBuy
Strong sellStrong buy
Strong sellSellNeutralBuyStrong buy
Neutral
SellBuy
Strong sellStrong buy
Strong sellSellNeutralBuyStrong buy
An aggregate view of professional's ratings.
Neutral
SellBuy
Strong sellStrong buy
Strong sellSellNeutralBuyStrong buy
Neutral
SellBuy
Strong sellStrong buy
Strong sellSellNeutralBuyStrong buy
Neutral
SellBuy
Strong sellStrong buy
Strong sellSellNeutralBuyStrong buy
Frequently Asked Questions
The current price of UMSINT is 4.60 MYR — it has increased by 0.88% in the past 24 hours. Watch UMS INTEGRATION LIMITED stock price performance more closely on the chart.
Depending on the exchange, the stock ticker may vary. For instance, on MYX exchange UMS INTEGRATION LIMITED stocks are traded under the ticker UMSINT.
UMSINT stock has fallen by −8.55% compared to the previous week, the month change is a −10.68% fall, over the last year UMS INTEGRATION LIMITED has showed a −10.68% decrease.
We've gathered analysts' opinions on UMS INTEGRATION LIMITED future price: according to them, UMSINT price has a max estimate of 6.16 MYR and a min estimate of 5.23 MYR. Watch UMSINT chart and read a more detailed UMS INTEGRATION LIMITED stock forecast: see what analysts think of UMS INTEGRATION LIMITED and suggest that you do with its stocks.
UMSINT reached its all-time high on Aug 5, 2025 with the price of 5.51 MYR, and its all-time low was 4.54 MYR and was reached on Aug 20, 2025. View more price dynamics on UMSINT chart.
See other stocks reaching their highest and lowest prices.
See other stocks reaching their highest and lowest prices.
UMSINT stock is 2.61% volatile and has beta coefficient of 1.02. Track UMS INTEGRATION LIMITED stock price on the chart and check out the list of the most volatile stocks — is UMS INTEGRATION LIMITED there?
Today UMS INTEGRATION LIMITED has the market capitalization of 3.40 B, it has decreased by −4.40% over the last week.
Yes, you can track UMS INTEGRATION LIMITED financials in yearly and quarterly reports right on TradingView.
UMS INTEGRATION LIMITED is going to release the next earnings report on Nov 7, 2025. Keep track of upcoming events with our Earnings Calendar.
UMSINT net income for the last quarter is 34.05 M MYR, while the quarter before that showed 32.50 M MYR of net income which accounts for 4.74% change. Track more UMS INTEGRATION LIMITED financial stats to get the full picture.
UMS INTEGRATION LIMITED dividend yield was 5.05% in 2024, and payout ratio reached 90.59%. The year before the numbers were 4.18% and 62.50% correspondingly. See high-dividend stocks and find more opportunities for your portfolio.
EBITDA measures a company's operating performance, its growth signifies an improvement in the efficiency of a company. UMS INTEGRATION LIMITED EBITDA is 233.77 M MYR, and current EBITDA margin is 25.20%. See more stats in UMS INTEGRATION LIMITED financial statements.
Like other stocks, UMSINT shares are traded on stock exchanges, e.g. Nasdaq, Nyse, Euronext, and the easiest way to buy them is through an online stock broker. To do this, you need to open an account and follow a broker's procedures, then start trading. You can trade UMS INTEGRATION LIMITED stock right from TradingView charts — choose your broker and connect to your account.