XNOUSDT (Nano) Looks Ready To MoonHi guys, let's take a step back and walk through the price action of XNOUSDT (Nano) to see what it has in store for us.
We'll start the technical analysis of Nano (XNO) vs USDT from the monthly timeframe down to the 4-hourly to gain a broader perspective on its price action, allowing us to anticipate trends both in the long and short term.
Monthly Timeframe:
As seen in the chart above, we've had series of rejection and indecision candles since June 2024 down to November where we currently are. As we know, rejection and indecision candles alone don’t hold much weight, but they become significant when they occur in an area of interest, as we're seeing here. This is the third time this trendline has been tested, and it seems to be holding strong. The persistence of these rejection and indecision candles over the past five months might suggest that selling pressure is beginning to ease and buyers are starting to take interest.
Zooming in a bit further and marking the monthly lows and highs, it's obvious that we've been making series of HH (higher highs) and HL (higher lows).
Since the impulsive wave from October 2024 to March 2024 that led to break of previous monthly lower highs, it is expected to have correction since price does not move in a straight line but rather moves in impulse-corrective waves. Not only is correction healthy, it presents traders the opportunity to get in the prevailing trend at a discounted price.
With that said, what is the take away from the monthly timeframe? It looks like a good time to get in, and this is only my opinion which is based on the price action.
Now let's go down to the weekly timeframe to see what's happening.
Weekly Timeframe
On the weekly timeframe, we see a straightforward price action, a falling channel from which the price has recently broken out and a weekly HL (higher low) has just formed with a candle showing momentum. This could lead to a break of the current weekly LH (lower high) at 1.056 price level, which hasn't been tested since August 2024. For this break of structure to happen on the weekly timeframe, we’ll need to see a strong impulsive move breaking the weekly LH at the price of 1.056.
If we do not see price move into the weekly LH at 1.056 impulsively, then it means price is not ready to move just yet and only forming a bigger corrective wave.
Daily Timeframe
Now on the daily, the price breaking out of the falling channel is even clearer. Look at that nice looking impulsive move that led to break of structure coupled with where this price action is taking place makes it more interesting. Having broken the daily LH at 0.883 impulsively, and out of the channel, I would be looking for my entry signal in the corrective wave or what some will call a retest that would come after.
4 Hourly Timeframe
Same insight from the daily, will be looking for a more obvious corrective wave on the 4 hourly to start take a buy position.
That's all for Nano (XNO). Let me know what you think about this technical analysis in the comment section.
Please make sure to you do your research.
My trading rule is simple, don't take position based on what you anticipate price will do, take position only when price does what you anticipate and presents you a point of entry.
Market insights

Where Is Nano (XNO) Headed?Where really is Nano headed? Well, I don't know but hoping to see what price is telling us so we know what to do if some certain move we anticipate happens.
Let's start by unravelling this mystery from the Monthly timeframe to get a holistic view of the price action.
Monthly Timeframe
Since May 2021 when price got to $17.7+ we've been in a continued down trend that seems to have no end and I can only imagine what it feels like buying at that price level and still Hodling till now.
One important thing we should always remember about the market is that price tends to spend more time in its corrective phase than it does in its impulsive phase. Just as a reminder, price moves in an impulse-corrective-impulse pattern, and Nano (XNO) is no different.
On the Monthly, we are starting to see a Break of Structure (BoS) where a previous LH (Lower High) was broken by the impulsive wave which is currently correcting as expected. Remember, after impulse, follows correction and then another impulse from the corrective phase to confirm the trend.
Corrective phase is where we should look to enter our long term positions from. We however are not going to make buy decision only what we see on the Monthly, we'll see what the Weekly, Daily and 4 Hourly timeframes say before we start thinking of how might take a position if our expectations are met.
Since we're more interested in the recent price actions, let's zoom in the Monthly to really see the structure.
Hmm, look at those sexy rejection candles. Well those alone don't mean anything as the candles are printed in the middle of nowhere. Let's scale down to Weekly in the next section.
Weekly Timeframe
Look at that, a bearish pennant which looks like it's breaking out already. Look at the price action on the weekly, since March 11th 2024, we've had series of impulse-correction. We are in a corrective phase in a pennant formation which usually signify continuation of prevailing trend. Pennants usually form after an impulsive wave which is true in our case.
With this price action, I'm only going to be interested in buying on pull back when price breaks the Weekly LH (lower High) at price of 1.056.
Likewise, if price breaks the Weekly Lower Lower (LL) at 0.668 then price would be indicating continuation of the current down trend on the Weekly timeframe. That said, let's see if the daily would give us any hint on what to expect in the short term.
Daily Timeframe
On the daily, we're currently at the impulsive phase after breaking from the corrective phase. If we don't get buy interest at the Daily Lower Low (LL) at 0.777 then we might be looking to test the Weekly LL at 0.668.
My interest to buy XNO would be if price breaks and stays above the Daily HH at 0.922 or if price breaks any structure and stays above in a future price action formation. For now, I'm bearish a XNO.
4 Hourly Timeframe
Price already broke 4 Hourly timeframe HL and now headed to the Daily LL. If the Daily LL does not hold, then we might be heading to the Weekly LL.
With this, I am fully bearish on Nano except we start seeing some Break of Structure to the up side in the coming days and week

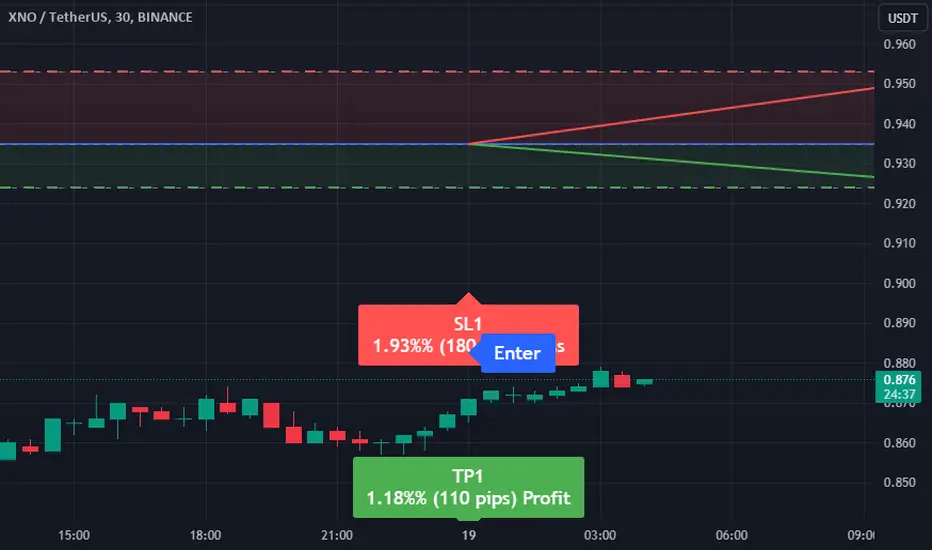
Trade Signal: XNOUSDT Movement AnalysisAttention traders! A new opportunity has emerged in the XNOUSDT pair, where current market conditions suggest a favorable direction for Sell . Here’s the detailed plan based on our strategy, EASY Quantum Ai:
- Enter Price: 0.935
- Take Profit: 0.924
- Stop Loss: 0.953
The recommendation to go short on XNOUSDT is derived from several key indicators. Our algorithm highlights a recent bearish trend formed by consistent lower highs and lower lows, suggesting downward momentum.
Moreover, oscillators within the strategy indicate that the pair is entering an overbought region, wherein historical data shows a strong probability of reversals. Market volume analysis also suggests a lack of buying pressure, further supporting a potential decline in price levels.
It's crucial to adhere to the risk management parameters set by the Enter, Take Profit, and Stop Loss prices to maximize potential gains while safeguarding against unforeseen market volatility. This signal reflects the calculated output from EASY Quantum Ai and is tailored to current market conditions.
This is an opportunity to capitalize on XNOUSDT’s anticipated movement, so stay vigilant and execute accordingly. As always, ensure due diligence and align this with your personal trading strategy.
NANO FALLING WEDGE PATTERNOnce the breakout of the falling-wedge is confirmed, an upward move of at least 50% to 100% could be expected.
Nano (XNO) is a decentralized peer-to-peer cryptocurrency system for payments that enables cost-effective and fast transactions on the ledger. Thanks to the use of a block-lattice data structure and a special system for decentralized voting, Nano enables users to receive and send transactions in NANO within seconds.


XNO touching 20W MAXNO (Nano) is currently in a strong support zone. The 20-week moving average (MA) stands at $1.25 and is expected to rise to $1.27 - $1.28 by Monday. Nano is still significantly undervalued, and it has been almost exactly 3 years since the last peak. If the 20-week MA holds and Bitcoin remains relatively stable, a strong upward trend could follow shortly.

XNO - With a possible parabolic movement!XNO is getting hotter, seen from the higer highs and higher lows which trend is breaking the 1.75$ level.
Is a good barrier to break but with a bit of volumes the price can go towards the first potential possible targets around 3$ a piece.
Good trading!

✴️ XNO Bullish Flag (194% - 380% Profits Potential)Good day my fellow Cryptocurrency trader, one more chart for you today.
➖XNOUSDT can be seen here consolidating within a bull flag, which is a continuation pattern.
➖The initial move is a bullish breakout in late 2023, so the continuation points to an up-move.
➖A potential bullish continuation is supported by a strong RSI with XNOUSDT moving weekly back above EMA100 (blue line on the chart).
This might have been a mixed chart if it wasn't for the move above EMA100 this week. Confirmation is needed though.
Potential targets mapped on the chart.
Namaste.

XNO LOOKS BULLISHFrom where we entered "strat" on the chart, we have had a double correction on the chart that has been over for some time.
Now there is a good place to rebuy. If the price reaches the green range, we will enter the buy/long position
By keeping the green box, it can continue to pump in the coming days.
The targets are clear on the picture.
Closing a daily candle below the invalidation level will violate the analysis
For risk management, please don't forget stop loss and capital management
Comment if you have any questions
Thank You

XNOUSDT.PXNOUSDT.P is in bearish trend.
Potentially printing LH and LL.
No sign of reversal here.
Buyers are storngly active.
We didn,t wait for the breakout we sell at CMP.

Benford's Law Applied to Nano (XNO)I have already introduced the Law of Anomalous Numbers, also known as Benford's Law. While using a Logarithmic price scale helps give perspective to the change in price over time, I have added additional lines equally spaced at each magnitude to further clarify price action.
I first split each magnitude in half by taking the square root of 10, which equals 3.16. Applied to financial markets Benford's Law suggests price should spend half the time between 1*10^x and 3.16*10^x and the other half of the time between 3.16*10^x and 1*10^(x+1), etc. Despite this representation, we are only concerned with the leading digit, so price does not have to spend an equal amount of time at each magnitude. The longer the period of time and orders of magnitude in price we measure, the greater the likelihood the leading digit will gravitate toward the power law distribution seen below. We should note that subsequent digits appear to follow this distribution as well but gravitate toward a uniform distribution the further away we measure from the leading digit. This is independent of the base number system used and can most easily be understood using a percent change perspective.
The probability of leading digits:
P(1) = 30.1%
P(2) = 17.6%
P(3) = 12.5%
P(4) = 9.7%
P(5) = 7.9%
P(6) = 6.7%
P(7) = 5.8%
P(8) = 5.1%
P(9) = 4.6%
Legend and how each number can be derived but arranged in numeric order:
sqrt(1.78) = 1.33 light blue
sqrt(3.16) = 1.78 purple
1.33*1.78 = 2.37 pink
sqrt(10) = 3.16 red
1.33*3.16 = 4.21 orange
1.78*3.16 = 5.62 dark green
2.37*3.16 = 7.50 light green
10 dark blue
Next order of midpoints in gray
I find it interesting how midpoints, midpoints of midpoints, etc., seem to consistently interact with price as support and resistance rather than just being an arbitrary number along a supposed random walk. If we continue to take midpoints of midpoints infinitely, we will naturally fill in every number. We then gather that the most significant number is 1 (across magnitudes), followed by its midpoint (3.16), followed by the midpoints of the midpoint (1.78 and 5.62), followed by the midpoints of midpoints (1.33, 2.37, 4.21, and 7.5), etc. Market pressures force price in one direction or another but seem to shift or alleviate around these and other midpoints until that pressure subsides or other pressures arise. These price levels are not the cause yet are interconnected with the effect as seen on this chart and others.

Bullish for XNO AT any Time soon will explodei believe that this coin will hit soon more than 5 dollars
but if you scalp quickly
you can buy between 1:04 to 1:08
and sell between 1:28 to 1:48

XNO (Nano) may be setting up for an explosive moveXNO has a history of explosive movements. Fibonacci extensions point to possible targets after the $1 price is left behind. To put it in perspective, at current values, XNO should be worth $90 to catch up with the memecoin Doge and $37 for Shiba. To enter the top 100 of the crypto market capitalization it would need to be worth $4. I believe it is a great risk-return if you believe in the technology, distribution and use of it, especially now that people are noticing flaws in Bitcoin and Lightning Network.

XNO below 1$ for 230 daysXNO can be traded at less than a dollar for 230 consecutive days now. Great for accumulating more. 😉

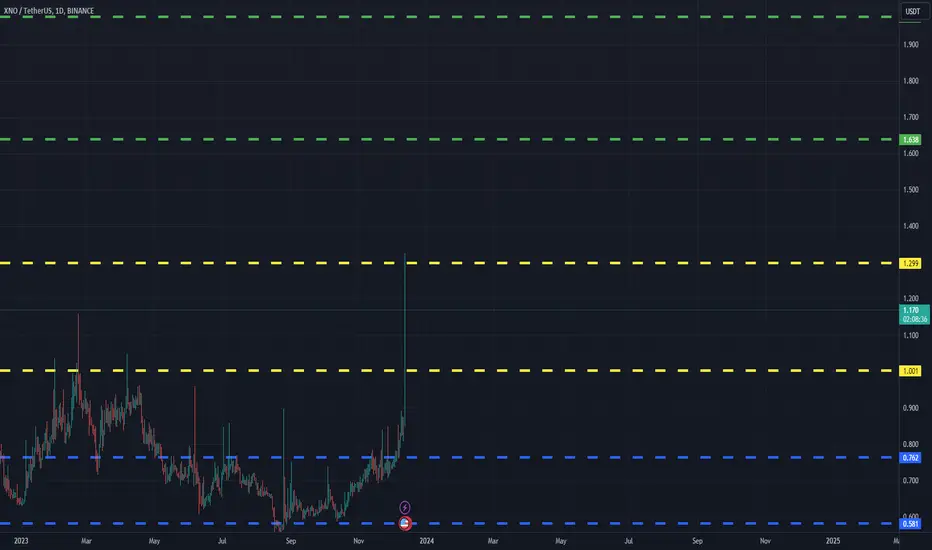
XNOUSDT(Nano) Daily tf Range Updated till 12-12-23XNOUSDT(Nano) Daily timeframe range. lots of wicked out in this PA. cut through 1.001 and need to stay above to get out of 1.299 which already touched. thats only possible if daily close dont end up in another wicked out.
XNO divided by USD money supplyI found it amusing how well the horizontal channel can be drawn in XNO/USM2. Additionally, it seems that the long-term downtrend is finally about to break. It's a pity that such a great project still receives so little attention.
This is not trading advice.

SCALPNano might see 3ish % drop even tho theres quite a lot emas on the way but they'r just imaginary anyways right
lets see what hamas brings 4 us
allahu akbar
htf looks bullah but i bet its a fake n we go down

finally xno breaking multi year downtrend in downtrend since 2021 but now showing signs of life formed falling wedge in 3 days tf and also breaking multi year trendline expecting successful breakout
and incase of successful breakout expecting solid recovery towards 2$ in next weeks keep eyes on for successful breakout

XNO 4h Bullish if and only if XNO looks very promising and I believe it will reach a profit of 2% at least from the current price.
If it stays above the light blue colors then we expect a good move upward insh Allah!
SL 4h below the red line.
All the Best!

XNO showing a very impressive investment opportunityHi Everyone;
today we have one of the best risk to reward Investment opportunity
it is more than 3000 times the risk and the chart is look very promising.
I expect breaking the previous bear market key point will clear the way to the final target

Leverage longgoing long with 10x leverage, this is part of a bigger structure. see my account for more info. You can tell by the MACD this will try soon to break form this short term downtrend. im convinced it wil. normally i dont leverage trade.


XNOUSDNot an investment recommendation.
This chart was made for personal study and personal use only.
If you liked the idea, please like it.
If not, write why.
In my humble opinion, the price will go up.
