AMZN Options Alert: High-Potential Swing PlayInstrument: AMZN
Signal Type: Swing Trade
Direction: BUY CALLS (though note Katy AI predicts short-term bearish bias)
Confidence: Medium (65%)
Strike Focus: $220
Entry Price: $2.36 – $2.40
Target 1: $4.72 (≈100% gain)
Target 2: $7.08 (≈200% gain)
Stop Loss: $1.18 (≈50% loss)
Expiry: 17 days (2025-12-26)
Position Size: 2.5% of portfolio
Market Context: Broader market bullish, VIX rising → volatility opportunity
Technical Notes: Weak trend strength, trading below VWAP, resistance at $238.97
Options Flow: Oversold put/call ratio, unusual $290 call activity
Risk Notes:
Moderate risk due to market divergence and medium confidence
Monitor $220 support; break confirms bearish thesis
Position sizing should be conservative
Market insights

AMAZON 's new Bear Cycle targets $125. And it can make you rich.Amazon Inc. (AMZN) has been trading within a massive 24-year Channel Up ever since its October 2001 bottom of the Dotcom crash. This pattern, as you can see, has been following a very distinct structure with its 1M MA100 (green trend-line) being the major Support level (and providing the most efficient buy opportunities) since November 2006.
What stands out here is the period from late 2020 until today and how it resembles the one from late 2003 to late 2007. Both traded under multi-year Higher Highs trend-lines and in October 2007 that formed a Top, causing a 2nd correction within that time-frame that bottomed once it hit the 1M MA100 within the Support Zone of the previous consolidation phase.
Today's fractal has already made the 1st correction in 2022, which not surprisingly also bottomed on the 1M MA100 and kick-started the rally towards the Higher Highs trend-line again. We are now at the point where there are high probabilities that the 2nd correction will take place.
If the market continues to follow the past pattern, we expect Amazon to bottom below the 1M MA100 this time and at the bottom of the Support Zone within the $130.00 - $125.00 range. This will make an ideal Higher Low right at the bottom of the 24-year Channel Up.
So what can make you rich on this? Making a long-term buy of course and keeping it until 2030 - 2032 as the new Bullish Leg that will start, will effectively be the new Bull Cycle. And as this chart shows, these Cycles have had similar rises, with the 'weakest' one being +1037%.
---
** Please LIKE 👍, FOLLOW ✅, SHARE 🙌 and COMMENT ✍ if you enjoy this idea! Also share your ideas and charts in the comments section below! This is best way to keep it relevant, support us, keep the content here free and allow the idea to reach as many people as possible. **
---
💸💸💸💸💸💸
👇 👇 👇 👇 👇 👇

AMZN at a Critical Zone for Dec. 15. Could Decide the Next Move?AMZN doesn’t look strong going into Dec. 15. It’s not collapsing, but it also doesn’t show the kind of buying pressure you’d expect if a real bounce was coming.
After the breakdown from the prior range, price tried to stabilize, but every push higher has been slow and overlapping. That usually tells me sellers are still in control and buyers are only reacting, not leading.
Right now, AMZN is hovering around the 226–227 area. It’s holding for the moment, but nothing here looks like a confirmed bottom. This feels more like a pause after selling than accumulation.
As long as price stays below the prior breakdown zone, the trend hasn’t changed.
Levels I’m watching
The most important area is 227–228.
That zone has repeatedly capped price and lines up with prior structure. If AMZN can’t reclaim and hold above it, upside moves are likely just relief bounces.
Above that, 230–232 is the bigger test. This was strong support before the breakdown and should now act as resistance. If price reaches that zone without strong volume, I’d expect sellers to step in again.
On the downside, 225 is the first level that matters. If that breaks, the chart opens up quickly toward 222–220, which is the next liquidity pocket from the previous move.
How options positioning fits (confirmation only)
Options positioning explains why price feels heavy.
There’s solid PUT support below, which is slowing downside momentum. At the same time, CALL resistance is stacked overhead, especially above 230. That makes sustained upside harder unless volume expands.
This lines up with what price is already telling us — downside moves have more follow-through than upside attempts.
How I’m approaching Dec. 15
If AMZN opens and can’t hold above 227, I’ll stay cautious on longs. A clean break below 225 is where downside momentum likely picks up again.
If price manages to reclaim 228–230 and hold, then I’d reassess. Until that happens, I’m treating upside moves as corrective, not a trend shift.
For me:
* Below 225 → downside continuation risk
* Between 225–228 → chop and traps
* Above 230 with acceptance → trend improvement attempt
Until proven otherwise, this still looks like bearish consolidation, not a confirmed bottom.
This analysis is for educational purposes only and does not constitute financial advice.

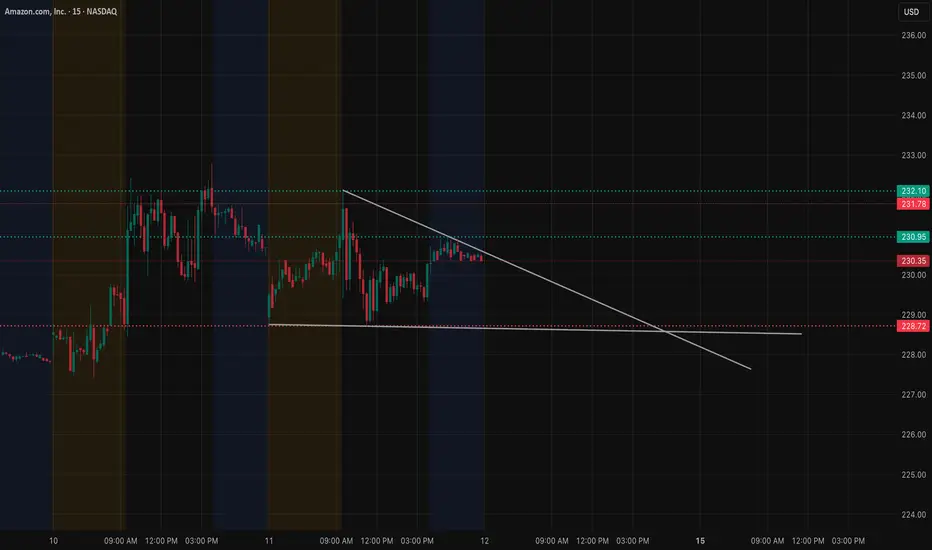
AMZN Dec 12 Compressing Under a Key Trendline. Will it break?AMZN has been trading in a contracting structure on the 15-minute timeframe, respecting a downward trendline that has repeatedly rejected price. Each attempt to push through the 230.50–231 zone has been met with selling, keeping AMZN stuck under this tightening resistance. The price action has formed a clean triangle compression: lower highs from the trendline and a flat demand shelf around 228.50–229.
The reaction around 228.50 is especially important. This level has acted as a base multiple times across the last two sessions, and buyers consistently stepped in to defend it. If AMZN loses this level, the structure breaks and volatility opens up quickly.
Inside this compression, the candles continue to shrink—classic behavior before a breakout or breakdown. AMZN doesn’t have much room left. The market will likely choose direction early.
Now looking at the options landscape from GEX chart below, the GEX levels line up with the structural pressure points almost perfectly.
The strongest positive gamma resistance sits between 232–234. This aligns with the upper green zone shown on the chart. When price approaches these high positive-gamma regions, dealer hedging tends to limit extension, which explains why AMZN stalls every time it tries to climb into 231–232. It’s where momentum repeatedly fades.
If AMZN does break above the trendline and establishes support above 231, the hedging pressure that capped price begins to unwind. That creates room for AMZN to make a controlled move toward 232.5 first, and if volatility expands, 234 becomes achievable.
Below price, negative gamma begins to appear just under 228. The first key pocket centers around 227.5–226. This area aligns exactly with the flat support zone from the 15-minute chart. If AMZN loses 228.50 and slips into this negative gamma pocket, dealer hedging accelerates volatility instead of containing it. That opens the door for a deeper move toward 225, which also appears as a defined support zone on both price structure and GEX levels.
When price structure and GEX positioning both point to the same inflection zones, the setup becomes much clearer.
For Dec 12, AMZN’s path depends on how it resolves this triangle:
• Clearing the trendline and holding above 231 shifts momentum toward 232.5 and potentially 234
• Rejection at the trendline keeps AMZN inside the compression, likely leading to more chop
• Losing 228.50 turns structure bearish and aligns with negative gamma flow toward 227.5–226
• Losing 226 exposes the deeper target near 225
AMZN has been coiling for two sessions. The next breakout or breakdown should be directional.
This analysis is for educational purposes only and not financial advice.

$Amzn Are You Finished or Are you Done? S/O to Birdmard just because I love that wild ass statement; Lol.
So I've been on NASDAQ:AMZN for a week now and I Learned a Lesson from it last week wicking 1.272 action. So I'm back to perhaps call it from the bottom of where its at currently. But check this is out, I generally only have my fibs to show on the level I chart on, (I dont want to see it on another time frame.) Well, this morning; I guess I hadn't turned my motor all the way on and I read my 1 HR fibs on the 15 mins and got into some 225 Amazon calls only to realize that this is my 1 Hr TF fibs not the 15 mins (Which is what I trade every day). So, this NASDAQ:AMZN Chart Image is Charted on the 1 HR TIME FRAME, but the Image I posted is on the 15 min TF. #Calls
Happy Trading, Alerts Set!

$AMZN a year of nothingNASDAQ:AMZN has been doing nothing for the last year.
and when I say nothing, it's a real nothing. And I don't really know what to think about the incoming week (even if I'm bullish for the long term)
Amazon, from A to A
This is chart is really #FIGO!!! 😂

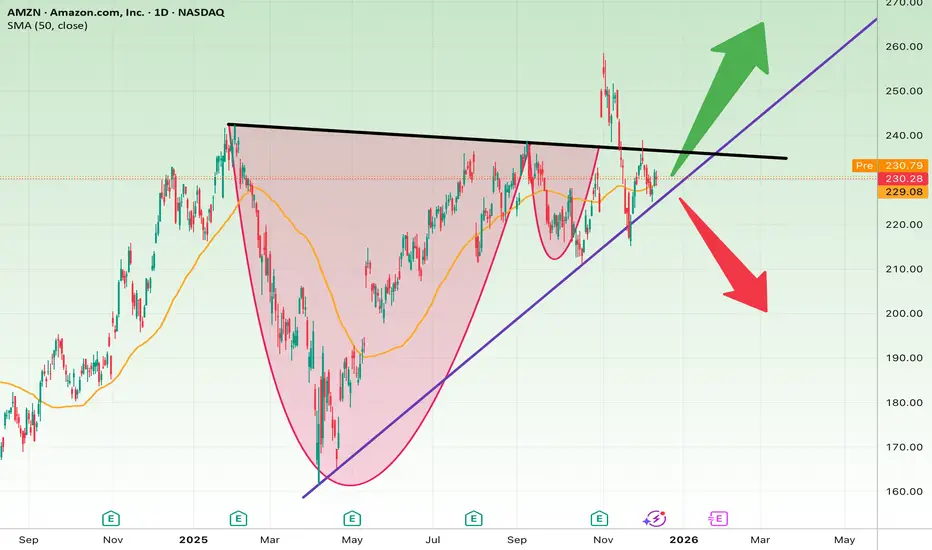
Amazon at a Major Decision Point (Breakout or Breakdown?)The chart shows a very important setup:
• A completed Cup & Handle pattern
• A strong ascending trendline still intact
• A long-term descending resistance line
Price is compressing between the trendline and resistance → major decision point.
Bullish Scenario
If AMZN closes above $235:
• Target 1: $245
• Target 2: $255
• Target 3: $268
• Stop-loss: Below $226
Bearish Scenario
A breakdown below $224 triggers:
• Target 1: $215
• Target 2: $205
• Target 3: $195
• Stop-loss: Above $230
Short Fundamental View
• AWS remains Amazon’s growth engine
• Retail recovery in the U.S. supports revenue
• Most analysts maintain Buy ratings
• Risks: rate pressure, AI competition, logistics costs
AMZN — Dec 10 Outlook | Tight Coil Under Resistance & GEX Shows the Real Battle
1H Structure
AMZN has been grinding inside a clear descending structure, capped by the falling trendline around $229–$230. Every bounce is getting weaker, and price is still sitting underneath the main breakdown zone from earlier in the week. The lower wicks around $225 continue to show buyers defending, but they haven’t been strong enough to change the trend.
This creates a very tight squeeze toward the apex — pressure building, direction coming soon.
15M Price Action
The 15M shows the real story:
A small CHoCH attempt earlier, but no follow-through. Price stayed pinned under the micro trendline and keeps grinding sideways between $227.7 and $226.7. That’s a classic liquidity trap range before expansion.
Support at $225.10 is still the major line in the sand. Losing that opens the air pocket toward $222.
GEX Perspective — Why the Options Market Agrees
GEX is heavily skewed this week, and it lines up almost perfectly with the chart.
Strong Call Walls:
Major call resistance stacks up at:
* $230
* $232.5
* $235+
These levels match the upper trendline on your 1H chart. Dealers hedge short calls by selling, which caps upside — exactly what we’re seeing intraday.
Put Support Cluster:
Big put positioning sits around:
* $225 (your chart support)
* $222.5
* $220
These GEX put levels create a “magnetic floor,” which explains why AMZN wicks down but can’t flush through yet.
Highest NET GEX resistance is at $232+, the same zone where your higher-timeframe breakdown began. That alignment strengthens the bearish rejection narrative.
The options market is telling the same story the chart is showing:
AMZN is trapped under heavy dealer resistance, with limited upside until the trendline breaks.
My Bias Going Into Dec 10
If price stays under the 1H trendline, downside retest remains the higher-probability scenario. I’m watching:
* A rejection at $228–$229 → potential continuation down
* A clean reclaim above $230 → changes the whole script and opens $232.5 quickly
Right now, the structure and GEX lean slightly bearish unless bulls step up.
Key Levels I’m Tracking
Upside:
$229.50 → $230 → $232.50
Downside:
$227 → $226 → $225.10 → $222.50
Final Thoughts
AMZN looks like it’s preparing for its next expansion move, and both price action and GEX agree on where the real barriers are. As long as it stays below the trendline and call-walls, expecting clean upside is tough.
A breakout above $230 would be the first sign the bulls are ready to flip the script.
Disclaimer
This analysis is for educational purposes only and reflects my personal trading perspective. It is not financial advice. Always do your own research and manage risk carefully.

AMZN Bullish Flag & Breakout Setup?Amazon (AMZN) is trending higher on the daily chart after a strong rally off the mid-October low, confirmed by a bullish Break of Structure and price holding above the rising 60-day and 120-day moving averages. Price is now consolidating in a classic bull flag beneath resistance, with key demand anchored near the $215.00 base of the prior reversal and a major support zone building around $218–224.
The primary path is continuation. A decisive daily close above $236 would confirm a breakout from the flag and clear the $235.50 resistance ceiling, opening room toward the $240 area and then the $248–250 zone as trend-followers step back in. A more conservative trend approach looks for a dip toward the 60-day moving average near $228 and a subsequent reclaim of $229, signaling buyers defending dynamic support and aiming for a retest of the recent highs.
If price instead closes below $226, that would warn of pattern failure and invite a deeper correction toward the $218 major support and potentially lower. Below that, the bullish thesis weakens materially and any long bias should be reassessed until structure improves. This is a study, not financial advice. Manage risk and invalidations.
Thought of the Day 💡
Strong trends rarely move in straight lines—most of the edge is found in how you trade the pauses.
------------------------
Thanks for your support!
If you found this idea helpful or learned something new, drop a like 👍 and leave a comment, I’d love to hear your thoughts!

AMZN : What’s Taking Shape?Amazon’s recent recovery has developed into an interesting emerging structure. After the sharp drop and strong rebound, price is now building a potential continuation pattern. Momentum suggests the market may still be preparing for another upward leg once this consolidation phase completes. With the flow tightening, the next decisive move could unfold sooner than expected, making this setup worth monitoring closely.
**Disclosure:** We are part of Trade Nation's Influencer program and receive a monthly fee for using their TradingView charts in our analysis.

AMZN (Amazon) LONG SET UPLONG TRADE
Entry 1 $228.00
Stop loss $224.00
Take profit 1- $232.00
(Close 33%)
Take profit 2- $236.00
(Close 66%)
Take profit 3-$240.00

AMZN Market Preview – December 5AMZN is entering tomorrow’s session inside a clear down-channel, and the structure today confirmed two important things: sellers are still in control, but buyers are quietly building a base inside your green demand zone. This sets up a meaningful decision day.
Structure Outlook (1H Trend View)
AMZN has been trending lower after losing the 233–235 support area. Once that zone turned into supply, every retest has been rejected. Price is now respecting a descending channel with clean touches on both the upper and lower trendlines.
Your chart shows a very important detail: the first strong bullish response came right at the lower channel + demand zone (around 227–228). That tells us buyers are still present — but they haven’t regained control yet.
The overhead structure remains heavy:
* 232–235 is now a major sell zone
* 238–240 is macro supply and aligns with GEX resistance
Until AMZN breaks out of this channel, the path of least resistance is still down.
15M SMC View – What Today’s Price Action Means
You marked BOS and CHoCH perfectly. The CHoCH shows buyers attempting a shift, but the follow-through was weak. Price is consolidating under your trendline with no real momentum.
Bearish signs:
* AMZN keeps rejecting the 232–233 area
* Channel resistance is holding cleanly
* Weak volume on pushes up
* Sellers defended the SMC red zone on each test
Bullish signs:
* Buyers defended the 227 demand box
* BOS into demand → CHoCH shows absorption
* Liquidity sits above 232 which could be swept
Overall → buyers are fighting, but sellers still have stronger positioning.
GEX Read for Tomorrow
Your GEX chart gives a clear map:
* Call walls: 235 → 240
* Highest positive GEX: 238.5
* Heavy PUT support: 227 → 225 → 222
* Dealer bias: Calls only 15% (bearish skew)
* If AMZN gets above 233.5, it can magnet toward 235 → 238.
* If it rejects 233 again, dealers will push toward the lower side of the channel:
228 → 225 → 222.
Tomorrow will likely follow whichever side of the channel breaks first.
What I Expect on December 5
AMZN is more likely to continue its bearish drift unless buyers can reclaim 233–235. The trendline pressure + weak bounces today lean in favor of another breakdown unless strong tech momentum supports it.
Upside scenario:
If AMZN breaks out of the channel and holds above 233.5, momentum could squeeze it into 235 and potentially 238 where GEX resistance sits.
Downside scenario (higher probability):
If AMZN fails at the trendline again or loses 227 support, the next pockets are 225 → 222 — both of which align with PUT support and liquidity.
My Bias
bearish-to-neutral unless AMZN breaks 233.50 with conviction. Structure, SMC, and GEX bias all point toward a controlled drift lower until buyers show real strength.
Quick Trade Thoughts (Not Financial Advice)
Bullish plan:
Break and retest of 233.5
Target 235 → 238
Invalidation: back inside channel
Bearish plan:
Reject 232–233
Target 228 → 225 → 222
Best RR is always near the top of the channel
Avoid trading the middle of the range — that’s where AMZN gets choppy and eats premiums.
Disclaimer:
This outlook is for educational discussion only. It reflects a technical perspective on market structure and options positioning. Always trade your own plan and manage your risk.

AMZN🌎 Amazon After Q3: Strength, Strategy, and Attractiveness
A Crash Against a Background of Strength: Amazon shares experienced a short-lived correction along with the broader market, but this move was driven more by general sentiment than by changes in the company's fundamentals.
Quarterly Results as a Turning Point: The third-quarter report was a powerful catalyst, forcing the market to reassess Amazon's trajectory. The company not only beat expectations on both key metrics, but also did so convincingly: earnings per share were 25% above analyst estimates. Following the results, shares soared more than 13%, reflecting investor optimism about growing profitability.
Growth Engines: Retail Gains Momentum, AWS Accelerates
• AWS Returns to Dynamic Growth: The core cloud division has seen growth accelerate to 20% year-over-year, impressive for a business with annual revenue of ~$130 billion. This signals renewed momentum and strengthens Amazon's position in the race for AI leadership.
• Retail Demonstrates Operational Efficiency: Contrary to previous narratives, retail segments (North America and International) are beginning to make a significant contribution to overall return on investment (ROIC). Their operating margins are growing, creating long-awaited operating leverage. This is the result of years of investment in automation and logistics, which are now reducing unit costs and expanding gross margins.
Strategic Advantages in the Age of Autonomy: Amazon Structurally Benefits from Macro Trends
1. Automation as a Flywheel: The implementation of autonomous systems compresses costs, allowing the company to simultaneously increase margins and reduce prices for the end consumer. This creates a self-sustaining cycle: volume growth, increased operating leverage, EPS growth, and additional investments in efficiency.
2. Vertical Integration: Control over the supply chain from logistics centers to AWS cloud infrastructure creates a unique, difficult-to-replicate barrier to entry for competitors and ensures long-term cash flow stability.
Value Issue: Not Cheap, but Reasonable
Despite the jump in its stock price, Amazon doesn't appear overvalued compared to its peers.
• With a forward P/E of around 38x, the company trades at a significant discount to its five-year average.
• Compared to other Magnificent 7 companies, Amazon represents a reasonable value, especially compared to more expensive NVDA or TSLA.
• High capital expenditures ($116 billion over 12 months) directed at AI infrastructure are temporarily putting pressure on free cash flow. This is an investment in future growth, but investors should consider this factor.
Summarizing the quarter's data and strategic vectors, the positive scenario for Amazon outweighs the risks (regulatory pressure, cyclical spending, cloud competition).
Amazon combines maturity and operational efficiency with acceleration potential thanks to AWS and automation.
We consider Amazon one of the best companies among the M7 and that it will soon show one of the best results in the Magnificent 7.
In our view, the corrective movement of the 4th wave is ending, and the stock will soon be setting new all-time highs.

Quant siganls V3 AMZN Weekly Calls: Katy AI Sees Bullish MoveAMZN Weekly Options Trade Overview
Direction: BUY CALLS
Strike: $220
Entry Price: $11.00–$11.38
Target 1: $16.70–$16.80 (≈50% gain)
Target 2: $19.55 (≈75% gain)
Stop Loss: $8.15–$8.40 (≈25% loss)
Expiry: 2025-12-12 (Friday)
Position Size: 2–2.5% of portfolio
Confidence: 58–65%
Trend: Bullish / Katy AI predicts steady ascent to $232–$235 by Friday
Key Notes:
Entry during Friday morning dip aligns with predicted afternoon upward move.
Friday expiration increases gamma risk — monitor intraday and consider taking profits at Target 1.
Low volume (~0.6x avg) may exaggerate price moves — use limit orders.
PCR 1.53 (bearish flow) contradicts bullish call setup; watch institutional selling pressure.
Delta ~0.865 provides strong directional alignment with predicted upward momentum.
Call Setup (Contrarian Weekly Play)
Strike: $230
Entry Price: $3.80–$3.90
Target 1: $5.70 (≈50% gain)
Target 2: $7.60 (≈100% gain)
Stop Loss: $2.85 (≈25% loss)
Position Size: 2% of portfolio
Trend: Bullish (despite neutral weekly momentum)
Rationale: Katy AI time-series predicts consistent upward trajectory, reinforced by bullish AI sector news and low put/call ratio.
Key Notes:
Active monitoring needed due to Friday expiry and gamma risk.
Conservative delta (0.4–0.6) balances premium cost with directional exposure.
💡 Summary:
These are short-term bullish trades on AMZN calls ahead of Friday expiration. Katy AI shows strong predicted upside for both $220 and $230 strikes, but risk management is crucial due to Friday gamma exposure, low volume, and conflicting institutional flow.

Amazon (AMZN) Falters, Bears Eye 200 EMAI’m wondering whether Amazon has seen a major top on 3 November, given it saw a large gap into the high before momentum turned lower. This has the hallmarks of a ‘blow-off top’, which can occur at major turning points when bulls push a stock higher with such force – often via a gap – as a kind of ‘last hurrah’, only for momentum to then falter.
A 16.8% decline to its 200-day EMA then ensued and, while it has tried to rebound, it has also struggled to rise alongside the broader market.
Trading volumes were declining while prices rose, and Tuesday’s shooting-star candle formed near the September high and below the January high. Prices also gapped lower on Wednesday before finding support around the 50-day EMA.
Bears could look to fade moves towards the shooting-star high, with a retest of the 200-day EMA in focus.
Matt Simpson, Market Analyst at City Index.

AMZN Swing Alert: High-Conviction Moves Ahead!AMZN Swing Signal Overview (2025-12-04)
Trade 1: Contrarian Put Swing
Direction: BUY PUTS (counter-trend)
Confidence: 68%
Strike: $220.00
Entry Price: $2.15 – $2.30
Targets:
Target 1: $3.45 (≈60% gain)
Target 2: $4.60 (≈100% gain)
Stop Loss: $1.15 (≈50% loss)
Expiry: 2025-12-19 (15 days)
Position Size: 2.5% of portfolio
Analysis: Contrarian setup against a strong bullish market. Overbought technical signals, bearish put/call ratio (1.40), support at $215, resistance at $238.97. Moderate risk due to counter-trend nature.
Trade 2: Bullish Call Swing
Direction: BUY CALLS
Confidence: 68%
Strike: $235.00
Entry Price: $8.15 – $8.45
Targets:
Target 1: $12.50 (≈53% gain)
Target 2: $16.00 (≈96% gain)
Stop Loss: $5.50 (≈33% loss)
Expiry: 2025-12-19 (15 days)
Position Size: 3% of portfolio
Analysis: Bullish trade supported by strong fundamental catalysts (Graviton5 chip launch, analyst upgrades) and technical breakout potential. Swing range $226.80–$233.50, resistance at $238.97. Moderate risk with defined entry/exit.
Key Notes:
Market Context: Overall bullish (SPY & QQQ positive), watch for sector-wide AI correction (10-20%).
Volume & Flow: Contrarian put trade confirmed by elevated put/call ratio; call trade slightly bullish with unusual call activity.
Risk Mitigation: Tight stops and controlled position sizing. 15-day expiry reduces time decay risk but monitor momentum closely.

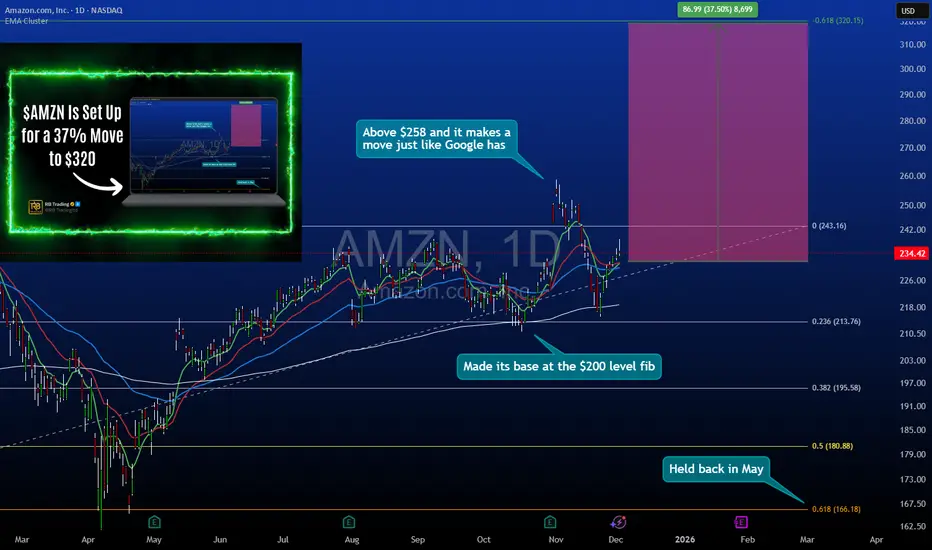
Amazon - Big Tech Pullback Strategy Into $232 SupportAmazon Multi-Month Position Build: $232-234 Entry Zone Targeting $320
Amazon has pulled back into a critical support zone at $232-234, presenting the same geometric retracement setup that recently validated on GOOGL. This analysis breaks down why this level offers favorable risk/reward asymmetry for a multi-month position targeting $320.
🎯 Setup Overview:
Entry Zone: $232-234 (current pullback area)
Primary Target: $320 (37% upside potential)
Timeframe: Multi-month position (Q1-Q2 2025)
Pattern: Structured retracement in established uptrend
📊 Technical Structure:
Support Confluence at $232-234:
0.618 Fibonacci retracement from recent swing low to high
Previous consolidation zone that acted as resistance, now support
Volume profile shows significant accumulation at this level historically
Aligns with rising trendline from 2023 lows
Price Action Context:
Amazon rallied from $140 lows to $260+ highs before this pullback. The current retracement brings price back into a zone where buyers have historically stepped in with conviction.
Why $320 Target:
Represents the next major resistance zone from prior price structure
Aligns with measured move extensions from current base
37% upside provides asymmetric reward relative to defined risk
🔍 The GOOGL Parallel (Why This Pattern Works):
What Just Happened with GOOGL:
Google recently pulled back into a similar geometric retracement zone (0.618 level) and reversed sharply, validating the strategy of buying quality big tech names during structured pullbacks rather than chasing momentum.
Why The Pattern Repeats:
Institutional Behavior: Large funds rebalance and take profits at resistance, creating predictable pullback zones
Liquidity Zones: Support levels represent areas where prior buyers have conviction and add to positions
Mean Reversion: Extended moves in trending assets typically retrace to specific mathematical levels before continuation
Key Lesson from GOOGL:
The most uncomfortable entry (during the pullback) provided the best risk/reward. Waiting for "confirmation" meant entering 15-20% higher with expanded risk.
📈 Why This Setup Makes Sense:
Risk Is Defined:
Stop loss placement below $225 (structure breakdown) limits downside to ~$7-9 per share from mid-range entry at $233. If price breaks $225, the bullish thesis is invalidated.
Reward Is Probable:
The $320 target isn't arbitrary it's based on:
Previous resistance turned future resistance
Fibonacci extension levels from the pullback
Historical price behavior at major psychological levels
From $233 entry:
Risk: ~$8 to stop at $225
Reward: $87 to target at $320
Ratio: ~10.8:1
Even a conservative partial target at $280 (first resistance) still offers 6:1 reward/risk.
🛡️ Risk Management Framework:
Entry Strategy (Scaling In):
First position: $234 (initial test of support zone)
Second position: $232 (if support retests cleanly)
Final position: $228-230 (if maximum pain occurs but structure holds)
This averaging approach improves entry price while maintaining discipline.
Stop Loss Placement:
Below $225 - a decisive break of this level invalidates the support thesis and requires exit regardless of unrealized loss.
Target Management:
First reduction (1/3): $270 (previous resistance, books profit)
Second reduction (1/3): $295 (psychological level, locks gains)
Final exit (1/3): $320 (primary target, complete position close)
Progressive profit-taking removes emotion from exits.
🧠 Trader Psychology: Why Most Will Miss This:
The Discomfort Factor:
At $234, Amazon "feels" weak because it's down from $260. At $270, it will "feel" strong because it's rising. But the best risk/reward exists now, not later.
Recency Bias:
Recent selling pressure makes traders assume more downside. Historical structure suggests this is where buyers return.
Waiting for Confirmation:
Many will wait for price to break above $250 to "confirm" strength. By then, risk to $225 expands dramatically and reward compresses.
The GOOGL Proof:
Those who waited for Google to "prove itself" entered 18% higher with worse risk parameters. The same pattern is setting up here.
📊 Tools Supporting This Analysis:
Fibonacci Retracement:
0.618 level at $232 marks the zone where pullbacks in strong trends typically find buyers.
Volume Profile:
High volume node around $230-235 indicates this area has been contested heavily—now it must hold as support.
Trendline Analysis:
Rising support from 2023 lows intersects with current price, adding confluence to the $232 zone.
Market Structure:
Higher lows and higher highs remain intact. This pullback is a correction within an uptrend, not a reversal.
🎯 Why Big Tech Pullbacks Work:
Quality + Liquidity:
FAANG stocks have deep liquidity and institutional ownership. When they pull back to structure, buyers appear because the underlying businesses remain strong.
Rotation, Not Rejection:
Selloffs in mega-cap tech are often profit-taking and sector rotation, not fundamental deterioration. This creates buy-the-dip opportunities.
Historical Precedent:
Amazon has repeatedly rewarded buyers who entered during 15-20% pullbacks to support in multi-year uptrends.
📅 Timeframe Expectations:
Not a Day Trade:
This is a multi-month position (potentially 3-6 months to target). Intraday volatility should be ignored.
Quarterly Catalysts:
Amazon's next earnings report and holiday season results could act as catalysts for the move toward $320.
Patience Required:
The $232 level may retest multiple times before resolving higher. Position sizing should accommodate short-term volatility.
⚠️ What Could Go Wrong:
Macro Headwinds:
Broader market selloff could pressure all equities regardless of individual structure. The $225 stop exists for this reason.
Sector Rotation:
If money flows out of tech entirely, support may not hold. This invalidates the thesis and requires disciplined exit.
Earnings Risk:
If holding through earnings, position sizing should account for potential volatility. Consider reducing exposure before the event.
Breaking Support:
If price closes below $225, the setup is broken. No hoping, no averaging down further—just exit and reassess.
🏆 The Professional Approach:
They Buy Structure, Not Stories:
The $232 level isn't interesting because of news or narratives. It's interesting because risk is small and reward is large based on geometry.
They Scale Positions:
Rather than going all-in at $234, they build the position across $234, $232, and potentially $228. This reduces timing pressure.
They Accept Being Wrong:
If $225 breaks, they exit with a small, controlled loss. Pride doesn't enter the equation.
They Journal the Setup:
Entry rationale, risk parameters, and targets documented before the trade. Emotions don't dictate exits.
📌 Key Takeaways:
✅ GOOGL validated the pattern: The same pullback-to-support strategy that worked on Google is setting up on Amazon at $232-234.
✅ 10:1 risk/reward exists now: Entry at $233 with $225 stop and $320 target offers exceptional asymmetry this compresses as price rises.
✅ Multi-month timeframe: This isn't a quick flip. Targets may take 3-6 months. Position sizing and patience are critical.
✅ Structure over emotion: When $234 feels scary, that's the signal. When $280 feels safe, that's the warning.
✅ Scale in, scale out: Build the position across the zone, exit progressively at targets. This removes timing pressure and locks gains.
⚠️ Important Disclaimers:
This analysis is for educational purposes and reflects a technical view based on price structure, historical patterns, and risk/reward calculations. It is not financial advice or a recommendation to buy or sell AMZN or any security.
The $232-234 support zone could fail. The $225 stop loss exists because no support level is guaranteed. Proper risk management requires accepting potential loss if structure breaks.
Targets are based on historical resistance levels and do not guarantee future performance. Market conditions, company-specific events, and macroeconomic factors can prevent targets from being reached.
The GOOGL comparison is for educational pattern recognition, not a guarantee that Amazon will follow the same path. Each setup has unique risks.
Always conduct independent analysis, size positions according to your risk tolerance, and consider consulting a financial professional. All investing involves risk of loss.
✨ Join the Discussion:
Are you watching Amazon at these levels? Have you used similar pullback strategies on big tech names? Share your thoughts or questions in the comments below.
📜 Buy structure. Define risk. Trade with discipline.
Live trading on Amazon stock.Live trading on Amazon stock.
Price is at the bottom of its channel and sitting in a strong demand zone.
Follow proper risk and money management.
This is just my personal view, so please trade based on your own strategy and trading system.
Follow me on TradingView for more analyses and live stock trades.
NASDAQ:AMZN

Amazon weekly chart
The $238.85 level for Amazon stock has been broken, with a weekly candle closing above this level.
Don’t worry—the stock is bullish in the near term. For now, it’s a buy and hold.
Good luck 4all 🃏

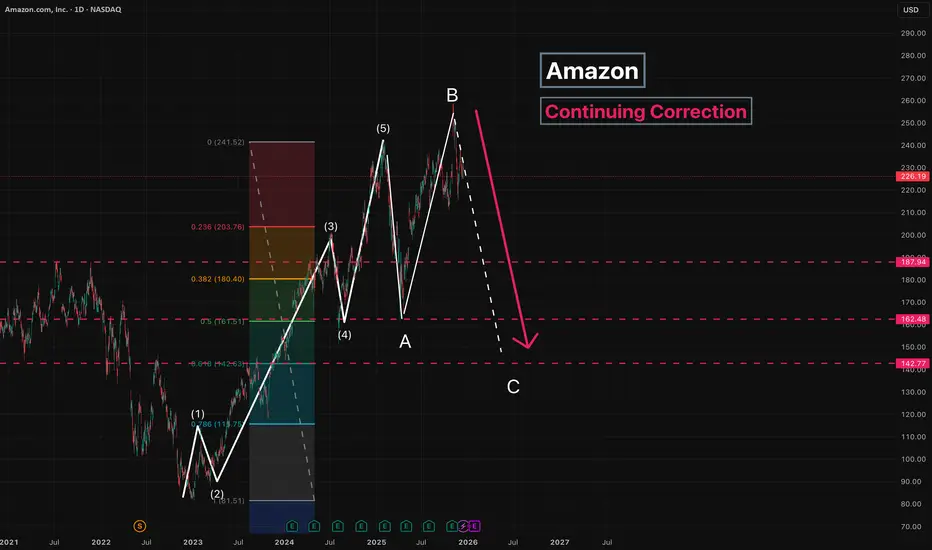
Amazon - Continuing CorrectionThe correction is ongoing, and wave C has started to form.
Since wave B is longer than wave A , wave C is expected to move below the low of wave A .
Main target: 142
Intermediate target: 187
---
Please subscribe and leave a comment.
You’ll get new information faster than anyone else.
---
Trade With Real Estate Globally1. What Is Global Real Estate Trading?
Global real estate trading means buying, selling, leasing, or investing in property across international borders. This includes:
Direct property purchases (homes, villas, commercial buildings, land).
Indirect investments such as Real Estate Investment Trusts (REITs).
Development partnerships with foreign builders.
Short-term rentals (Airbnb-style international properties).
Institutional investments where large funds buy foreign property portfolios.
The goal is to generate returns through:
Capital appreciation
Rental income
Diversification
Currency gains
Access to emerging market opportunities
2. Why Investors Trade Real Estate Globally
a. Higher Returns in Foreign Markets
Real estate returns vary widely from country to country. For example:
Dubai and UAE offer high rental yields (6%–10%).
European capitals give stable appreciation over time.
The U.S. offers powerful mortgage systems with low interest.
Investors chase these global advantages.
b. Diversification Against Domestic Risk
If one country faces inflation, recession, or political issues, the investor’s global property helps balance the risk. For example, an Indian investor with U.S. REITs is less affected by Indian market fluctuations.
c. Stronger Currency Gains
Buying property in a stronger currency like USD, AED, EUR, or GBP can increase overall wealth. When the home currency depreciates, global property appreciates in value.
d. Investment Visas & Residency Benefits
Many countries offer residency or citizenship on property purchase:
Portugal Golden Visa
Greece Residency by Investment
UAE 10-year Golden Visa
Turkey Citizenship by Property
This makes global real estate even more attractive.
e. Digitalization & Transparency
Earlier global real estate trading involved huge paperwork and physical visits. Today:
Virtual property tours
Online documentation
International real estate platforms
Global developers
have made the process fast and transparent.
3. Types of Global Real Estate Investments
a. Residential Properties
These include apartments, villas, condos, holiday homes, etc. Investors prefer:
Dubai
London
Singapore
New York
Australia
because of high demand and liquidity.
b. Commercial Properties
These include office buildings, retail shops, warehouses, and logistics centers. Commercial investment is popular because it offers:
Higher rental yield
Long-term leases (5–10 years)
Corporate tenants
Markets like the UAE, USA, Germany, and Netherlands are top choices.
c. Industrial Real Estate
Warehouses, fulfillment centers, manufacturing parks are booming due to:
E-commerce expansion
Supply chain globalisation
Countries like China, India, Vietnam, and Mexico attract global industrial investors.
d. Hospitality Real Estate
Hotels, resorts, service apartments—these gain from tourism growth. Investors choose places like:
Maldives
Thailand
Bali
Dubai
for hospitality trading.
e. REITs (Real Estate Investment Trusts)
REITs allow investors to buy shares of global property portfolios without owning physical buildings. They offer:
Low investment entry
High liquidity
Professional management
Examples: U.S. REITs, Singapore REITs, Dubai REITs, Indian REITs.
4. Key Drivers of Global Real Estate Trade
a. Economic Growth
Countries with fast-growing GDP naturally attract property investors. More jobs = more housing and commercial demand.
b. Urbanization
Cities expanding create strong real estate opportunities in:
Infrastructure
Residential
Transportation-linked developments
c. Foreign Direct Investment (FDI) Policies
Countries encouraging foreign investment—like UAE, Singapore, Portugal—get massive global capital in their property markets.
d. Tax Benefits
Countries offer:
Lower property tax
Zero capital gains tax
Tax-free rental income
This motivates global investors.
e. Currency Strength
Properties in strong-currency countries are seen as wealth preservers. Investors diversify to protect against local currency inflation.
5. Risks in Global Real Estate Trading
Like any investment, global property trading also has risks:
a. Currency Risk
If the foreign currency weakens, property returns fall when converted back.
b. Legal and Regulatory Challenges
Different countries have:
Different ownership laws
Restrictions on foreigners
Complex registration rules
Investors must understand these rules before buying.
c. Political and Economic Uncertainty
War, elections, sanctions, recession—these can affect property values.
d. Market Liquidity
Some markets don’t have fast buyers. Selling global property may take time.
e. Management Issues
If buying a property abroad, maintenance and tenant management can be challenging. Most investors hire property managers.
f. Taxation Complexity
Owning property abroad may mean paying taxes in both the foreign country and the home country.
6. How Global Real Estate Trading Works
Step 1: Market Research
Investors research:
GDP trends
Political stability
Rental yields
Transaction costs
Legal regulations
Step 2: Property Selection
They choose:
Residential, commercial, or industrial
Developed or emerging market
High-growth or high-yield area
Step 3: Legal & Documentation
Involves:
KYC
Property agreements
Notary procedures
Taxes
Some countries require local lawyers or brokers.
Step 4: Financing
Options:
Self-funded purchase
International mortgages
Developer financing
Step 5: Rental Management
To earn steady income, investors hire:
Property managers
Rental agents
Facility teams
Step 6: Exit Strategy
Investors must plan when to:
Sell the property
Reinvest in another market
Convert currency profits
7. Best Countries for Global Real Estate Trade in 2025
High-Yield Markets
Dubai (UAE)
Indonesia
Vietnam
Turkey
Stable and Safe Markets
USA
Canada
UK
Germany
Australia
Emerging Opportunity Markets
India
Philippines
Mexico
Saudi Arabia
8. Future of Global Real Estate Trading
Global property trading will grow rapidly due to:
Digital platforms
Blockchain-based property titles
Tokenization (fractional property ownership)
International mobility
Increased foreign investments
Investors will increasingly diversify across countries rather than depending on just one local market.
Conclusion
Global real estate trading has become a powerful way to build wealth, diversify risk, and take advantage of global economic growth. It offers opportunities in residential, commercial, industrial, and hospitality segments, supported by rising urbanization, open investment policies, and financial globalization. While it brings risks like legal challenges, currency fluctuations, and management issues, the rewards—high returns, global diversification, and strong-currency appreciation—make it a preferred choice for smart investors.

Recessions and Recoveries in the Global Market1. What Is a Recession?
A recession is a significant decline in economic activity that lasts for months or even years. It is generally marked by:
Falling GDP
Rising unemployment
Decline in consumer spending
Drop in corporate profits
Turbulence in financial markets
Reduced industrial production
In the modern globalized world, recessions rarely stay confined within one country because trade, capital flows, and supply chains are all interconnected.
2. Causes of Global Recessions
Recessions can have many triggers, and sometimes a combination of several. The common causes include:
a) Financial Crises
Banking system failures or credit crunches reduce lending and investment.
Example: The 2008 Global Financial Crisis began with subprime mortgages in the U.S. and spread worldwide through global banking linkages.
b) High Inflation
When inflation rises too quickly, central banks raise interest rates to control it. Higher rates increase borrowing costs and slow down economic activity.
Example: Multiple central banks tightened monetary policy drastically in 2022–2023 due to inflation spikes.
c) Geopolitical Conflicts
War, economic sanctions, territorial tensions, and global political instability disrupt trade and energy markets.
Example: Russia–Ukraine war disrupted global oil, gas, and wheat supply.
d) Supply Chain Disruptions
Shortage of components (like semiconductors), transportation bottlenecks, or pandemics disrupt manufacturing.
Example: COVID-19 lockdowns that halted global production.
e) Asset Bubbles
Overvalued housing markets, stock markets, or crypto markets can crash, reducing wealth and investor confidence.
f) Sharp Changes in Commodity Prices
A sudden spike in oil or a crash in metal prices can hurt economies dependent on these resources.
Most global recessions occur when multiple regions slow down simultaneously, creating a domino effect through trade, finance, and currency markets.
3. How Global Recessions Spread Across Markets
In a highly connected global economy, economic distress can travel across borders through several channels:
a) Trade Linkages
When one major economy slows, it imports less. Export-dependent countries immediately feel the impact.
Example: China's slowdown affects Southeast Asia, Africa, Latin America, and Europe.
b) Financial Markets
Stock markets around the world react almost instantly to negative global news.
Banks reduce cross-border lending.
Foreign investors withdraw money from emerging markets, weakening their currencies.
c) Commodity Prices
Lower demand reduces oil, metals, and agricultural prices, hurting producer economies.
d) Currency Markets
During recessions, investors move towards “safe-haven” currencies like USD, JPY, or CHF.
This can weaken emerging market currencies and make imports costlier.
e) Investor Sentiment
Fear spreads faster than data.
When global confidence falls, everyone—from households to corporations—cuts spending.
This chain reaction makes global recessions deeper and more synchronized.
4. Impact of Recessions Across Sectors
Recessions do not hit all sectors equally. Some are highly sensitive, while others remain relatively stable.
Highly Affected:
Automobiles
Real estate
Consumer discretionary
Metals and mining
Banking and finance
IT services (due to lower corporate spending)
Less Affected or Often Resilient:
Consumer staples
Pharmaceuticals
Healthcare
Utilities
Gold and safe-haven commodities
This difference in sectoral impact is why investors rebalance portfolios during recessions.
5. The Recovery Phase — How Economies Bounce Back
A recovery is the period after a recession when economic activity begins improving. It can be slow, fast, or uneven depending on:
Government policies
Central bank interest rate cuts
Consumer confidence
Global geopolitical stability
Technological shifts
Commodity price movements
Key signs of recovery include:
Rising GDP numbers
Falling unemployment
Stabilizing stock markets
Improvement in industrial production
Increase in global trade
Business expansion and hiring
Recoveries are often driven by renewed optimism and government stimulus.
6. Types of Economic Recoveries
Economists classify recoveries based on the shape of the economic rebound:
a) V-Shaped Recovery
Fast decline followed by a strong and quick rebound.
Example: India’s post-COVID recovery in 2021.
b) U-Shaped Recovery
Economy stays at the bottom for some time before recovery begins.
c) W-Shaped Recovery
Double dip: recovery begins, fails, and restarts.
Often caused by uncertainty or premature policy tightening.
d) L-Shaped Recovery
The worst type — a steep fall followed by stagnation for a long time.
Example: Japan’s “Lost Decade.”
e) K-Shaped Recovery
Some sectors recover strongly, while others lag.
Seen in many countries after COVID-19.
Understanding these patterns helps investors anticipate market behavior.
7. Role of Governments and Central Banks
During recessions, policymakers play a critical role in stabilizing the economy.
a) Fiscal Policies
Governments may:
Reduce taxes
Increase spending on infrastructure
Provide subsidies
Offer unemployment benefits
Stimulate demand through relief packages
b) Monetary Policies
Central banks:
Cut interest rates
Inject liquidity
Purchase government bonds
Relax bank lending norms
These actions aim to reduce borrowing costs, encourage investment, and boost consumption.
8. Impact on Global Financial Markets
Recessions often lead to:
a) Stock Market Declines
Investors sell risky assets due to uncertainty.
Bear markets can last months or years.
b) Bond Market Rally
Government bonds become attractive because they are safer.
c) Currency Volatility
Safe-haven currencies appreciate, while emerging market currencies weaken.
d) Flight to Gold
Gold rises as investors look for security.
e) Drop in Corporate Earnings
Lower profits reduce equity valuations.
During recovery, the opposite happens — risk assets rise, commodity prices stabilize, and currencies normalize.
9. Lessons from Past Global Recessions
a) The world is more interconnected than ever.
A recession in one large economy spreads quickly.
b) Excessive debt creates fragility.
Corporate, household, and government debt levels determine how deep a recession becomes.
c) Innovation accelerates recoveries.
Technology, digitization, and new business models often drive post-recession growth.
d) Policy timing is crucial.
Early stimulus shortens recessions; delayed response deepens them.
10. Conclusion
Recessions and recoveries are natural parts of the global economic cycle. Although they bring uncertainty, disruptions, and market volatility, they also create opportunities for restructuring, innovation, and long-term growth.
In today’s interconnected world, understanding how recessions spread, how recoveries unfold, and how markets respond is essential for traders, investors, and businesses. Those who stay informed, diversify wisely, and adapt to economic shifts often emerge stronger when the next recovery begins.
