Webull (BULL): Fibonacci Swing Setup Targeting $11.702-hour timeframe to identify potential price targets and reversal zones. Here's the structure:
- **Current Price**: $8.74
- **Volume**: 37.45K (moderate interest)
- **Fibonacci Levels**: 23.6%, 38.2%, 50%, 61.8%, 78.6% retracements used to mark support/resistance zones.
- **Extension Target**: 1.272 Fibonacci extension near **$11.50**, suggesting a bullish breakout potential.
- **Annotated Moves**: Price projections show potential gains of **11.09%**, **21.86%**, and **33.82%** depending on breakout strength.
#### 📈 Trade Setup (Bullish Bias)
| Component | Value / Rule |
|------------------|----------------------------------------|
| **Entry Zone** | $8.70–$8.74 (current consolidation) |
| **Stop-Loss** | Below $8.50 (under recent support) |
| **Target 1** | $9.75 (11.09% move) |
| **Target 2** | $10.65 (21.86% move) |
| **Target 3** | $11.70 (33.82% move, 1.272 extension) |
#### 🧭 Strategy Notes
- Ideal for **swing trading** with 2–5 day horizon.
- Watch for **volume confirmation** on breakout above $8.80.
- Risk-reward improves if entry is closer to $8.70 with tight stop.
Market insights

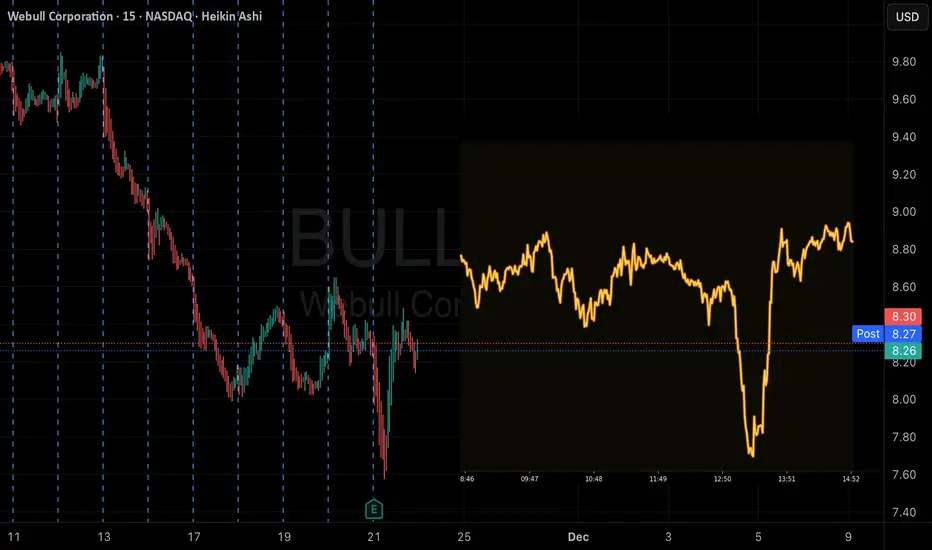
it is a time for BULL - 80% potential profit - 18.30 USDThe chart shows a clear attempt to reverse a prolonged downward trend, which previously pushed the price toward a strong support zone. In this area, a visible phase of accumulation has formed, suggesting that buyers are gradually taking control. The price has begun to build a sequence of higher lows and has broken above the nearby moving averages, which technically confirms the first signs of a potential trend reversal. At the same time, the RSI indicator has rebounded sharply from oversold levels and moved quickly into higher ranges, reflecting strengthening bullish momentum.
The current structure of the chart suggests that the market is attempting to establish a new upward trend. The rebuilding momentum supports the possibility of further price appreciation. Historical price action also confirms this potential: after breaking out of the current consolidation zone, the next significant resistance level aligns with a projected upward move of approximately 83% from current price levels. This target fits both the technical chart formation and the market logic following an extended period of sell-off.
In summary, the chart currently presents several technical factors favoring a bullish continuation: improving momentum, a breakout above moving averages, strong RSI recovery, and an accumulation pattern developing at a key support zone. If buyers maintain control and the price stays above the newly reclaimed support level, the scenario pointing toward an 83% upward move remains a technically reasonable possibility.
Potential TP: 18.30 USD
⚠️ Disclaimer
This analysis is not financial advice, not an investment recommendation, and should not be used as the sole basis for trading decisions. It is an educational interpretation of chart patterns and market structure. Always conduct your own research and consider consulting a licensed financial advisor before making investment decisions.

$BULL — Key Levels & Next Move OutlookI usually avoid calling exact moves — if I could do that, I’d already be a billionaire 😅
But here’s how I see NASDAQ:BULL shaping up if it can hold the key $10.19 support (which also perfectly mapped my projected $10.19 upside move from the 52-week low):
🟩 Hold $10.19 → $11.09 → $11.34 → $12.04
🔵 Break above $12.56
→ opens the door for a stronger momentum shift.
⚠️ Lose $10.19
→ short-term trend weakens, possible rotation back to lower supports.
Overall structure stays bullish as long as $10.19 is intact.
For more detailed breakdowns and chart updates, feel free to check my X @cockitrader
#BULL #TechnicalAnalysis #TradingView #PriceAction #BreakoutSetup #StocksToWatch

S/R flip zone for $BULLNASDAQ:BULL is seconds from touchdown on $10.19.
Let’s bring it home. ✈️📈
#BULL #Breakout #PriceAction #Trading #cockpitrader #aviator

$BULL - WeBull Off All Time LowsWe could be heading for $10 and over for WeBull.
Webull appears undervalued given its strong recent performance and market potential. In Q3 2025, the company reported a 55% year-over-year revenue increase to $156.9 million, with trading-related revenue up 64% and adjusted net income turning positive which are clear signs of operational momentum.
Despite these gains, the stock still trades around $9.62, near its 52-week low of $8.72. Intrinsic value estimates place fair value near $15-$18 per share, almost 50% above the current price, suggesting substantial upside.
Webull’s continued international expansion, growing user base, and the rollout of new fintech features position it for accelerated growth and profitability in upcoming quarters.
Disclaimer:
I do not provide personal investment advice and I am not a qualified licensed investment advisor. I am an amateur investor.
All information found here, including any ideas, opinions, views, predictions, forecasts, commentaries, suggestions, or stock picks, expressed or implied herein, are for informational, entertainment or educational purposes only and should not be construed as personal investment advice. While the information provided is believed to be accurate, it may include errors or inaccuracies. I will not and cannot be held liable for any actions you take as a result of anything you read here.
Conduct your own due diligence, or consult a licensed financial advisor or broker before making any and all investment decisions. Any investments, trades, speculations, or decisions made on the basis of any information found on here, expressed or implied herein, are committed at your own risk, financial or otherwise.
Feel free to give us a follow and shoot us a like for more analysis updates

BULL Smart Money Breakout?BULL on the 60-minute chart is coiling inside a Symmetrical Triangle after a bullish impulse and a clear Break of Structure to the upside. Using Smart Money Concepts (SMC), the structure remains bullish as long as price holds above the key swing lows, with the 120-period MA still acting as trend support beneath the current consolidation. Price is oscillating between resistance around 9.40 and support near 8.95, while the 20 and 60 MAs flatten around the pivot zone at 9.205–9.285, reflecting equilibrium before the next move.
From an SMC perspective, the primary path is a bullish continuation. A 1H close above 9.40 would confirm displacement, breaking both the triangle’s upper boundary and horizontal resistance, with 9.80 as the next logical liquidity area. The 9.11–9.21 bearish Fair Value Gap is a key point of interest; a controlled fill of that imbalance, while price respects 9.20 and the 8.95–8.80 demand zone, can offer refined long entries. Alternatively, a clean 1H close below 9.20 and loss of the 8.95–8.80 support shifts the focus to a deeper correction toward 8.80, with any move back above 9.40 invalidating the bearish scenario. This is a study, not financial advice. Manage risk and invalidations.
Thought of the Day 💡:
Smart Money Concepts work best when paired with clear levels and strict invalidations.
-------------------------
Thanks for your support!
If you found this idea helpful or learned something new, drop a like 👍 and leave a comment, I’d love to hear your thoughts!

$BULL looks ready nowNASDAQ:BULL looks ready now. Higher low, small double bottom, after a stretched and trading range type of downtrend is very strong in general.

BullishGreat numbers last quarter
Revenue: $156.9M (+55% YoY)
Net Income: $21.7M (vs loss last year)
EPS: $0.07 (beat by $0.04)
Customer Assets: +84% YoY (record high)
I think they'll continue to become more profitable with sustained growth. I bought shares under $9 and yesterday bought the 12/26 10C at .35 options for next year would be safer still pretty cheap considering how beaten down this has been. Gap below is open to 8.75 would add more shares if overall market is healthy. CRYPTOCAP:BTC CRYPTOCAP:ETH NASDAQ:HOOD all pumping bull is coiled and good value here. Looking to get 13 from these lows.


$BULL could be a buy next week.Webull is playing a similar game to $HOOD.
Retail participation is picking up again, and if volatility returns in 2026, that’s a real revenue tailwind.

Webull Corporation (BULL) Spike 6% Gearing for 800% Surge The price of Webull Corporation (NASDAQ: NASDAQ:BULL ) saw a noteworthy uptick of 6% today as it is gearing for 800% move should it break through the $16 resistant point.
With the RSI at 68, the stock is poised to achieve that fit amidst growing interest among investors and traders alike.
In another news, - Webull Corporation (NASDAQ: BULL) announced financial and operating results for the third quarter ended September 30, 2025.
Total revenues grew 55% year-over-year to $156.9 million, driven by user engagement and high-trading volumes
Customer assets increased 84% year-over-year, primarily due to broad-based market recovery and continued strong net deposits
Strong profitability performance while investing in geographic expansion, AI and new and enhanced product offerings
Financial Performance
In 2024, Webull's revenue was $388.97 million, an increase of 0.12% compared to the previous year's $388.50 million. Losses were -$517.78 million, 55.0% more than in 2023.
Analyst Summary
According to 2 analysts, the average rating for BULL stock is "Strong Buy." The 12-month stock price target is $16.5, which is an increase of 78.77% from the latest price.
About BULL
Webull Corporation operates as a digital investment platform. Its platform enables retail investors to trade securities through its licensed broker dealer in the United States, Canada, the United Kingdom, Australia, Hong Kong, Indonesia, Singapore, Malaysia, Thailand, Japan, South Africa, the Netherlands, and internationally. The company was founded in 2016 and is headquartered in Saint Petersburg, Florida.

$BULL looks ready to go finallyWebull has been facing this trending since early october, and is finally showing signs of wanting to break upwards. the green engulfing candle following earnings was HUGE

BULL SHORT Alert! QuantSignals V3 Predicts Slight DownsideBULL | QuantSignals Katy 1M Prediction (2025-11-21)
Current Price: $8.39
Predicted Close: $8.35 (-0.51%)
30-min Target: $8.24 (-1.79%)
Trend: Neutral
Confidence: 55%
Volatility: 93.2%
Trade Signal
Direction: SHORT (PUT)
Entry: $8.39
Target: $8.36
Stop Loss: $8.52
Expected Move: -0.51%
Summary: 1 trade signal generated from 1 successful analysis.
QuantSignals V3 High-Probability SetupBULL QuantSignals V3 Earnings — Simple & Clear Breakdown (2025-11-20)
Direction: BUY PUTS
Confidence: 60% (Low–Moderate)
Expiry: 2025-11-21
Strike: $8.50
Entry: ~$0.56
Target 1: $0.85
Stop Loss: $0.35
📉 Why PUTS Instead of CALLS?
Although the Earnings Model initially flagged BUY CALLS, Katy AI’s full intraday prediction overrides it:
Katy AI shows a bearish trend with a target of $8.14 (-2.63%)
78 data points → 71% show downward pressure
Predicts intraday lows around $8.03 (-3.86%) on expiry day
This makes PUTS the higher-edge setup.
📊 Key Analysis (Simplified)
Technical
Current Price: $8.36
RSI: 21.4 (oversold but still weak)
MACD, ROC, and EMAs → bearish
Resistance: $8.48
Support: $8.00
News / Fundamentals
EPS estimate: $0.03
Revenue: +140% YoY
Crypto trading relaunch could help later — but not enough to offset short-term weakness
Flow
PCR: 0.60 (normally bullish)
BUT heavy put flow spotted at $35 strike → indicates institutional hedging
IV extremely high at 271% → expect volatility
⚡ Trade Setup (Simple Version)
PUTS — $8.50 Strike — Exp 11/21
Entry: $0.54–$0.58
PT1: $0.85
PT2: $1.10
Stop: $0.35
Position Size: 2% (Low conviction)
⚠️ Risk Notes
Confidence only 60%
Oversold levels can bounce
Volume is only 0.3× average
Earnings = high volatility → manage size tightly
📌 Compliance
Educational analysis for QS Premium members only.
Not financial advice.
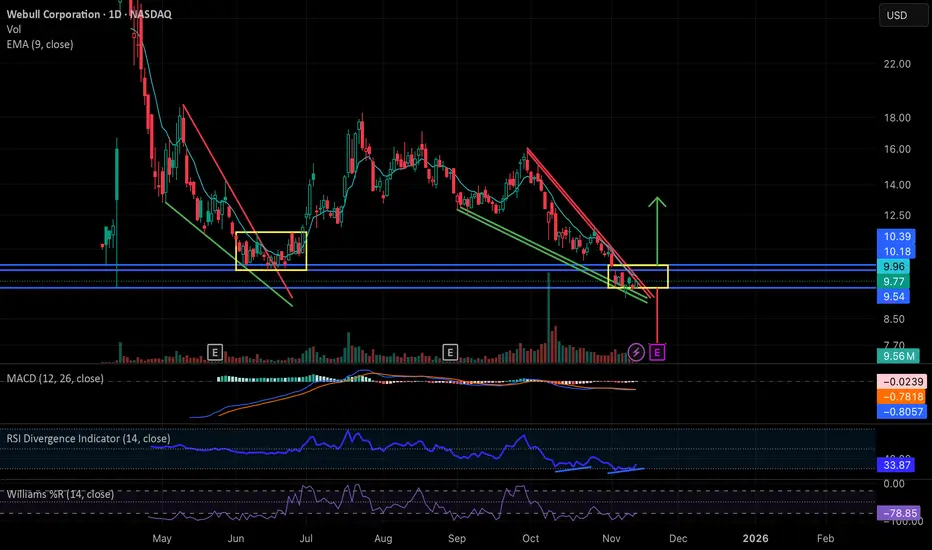
Webull: Falling Wedge Breakout ImminentNASDAQ:BULL has been in a steady decline essentially since the start of the government shutdown, forming a clean falling wedge structure very similar to the setup we saw in May and June. Back then, the wedge resolved with a brief breakout but ultimately moved into a sideways consolidation inside the yellow range before finally lifting in late June/early July.
Price is now sitting at the apex of a new wedge right as the government has officially reopened, almost to the day. With the president signing the bill, this may act as a macro green light for liquidity into year end, and BULL is positioned to potentially benefit from that.
Technically, the stock is deeply beaten down (roughly 40 percent from pre-shutdown levels), the MACD is starting to curl up, and there’s a clear daily RSI divergence. Together, these conditions make a relief move or breakout increasingly plausible.
If we don’t get a meaningful directional move between now and earnings on 11/20, then the most likely scenario is a replay of the May/June pattern: a period of sideways chop inside its current established support and resistance band zone around 9.54-10.18/10.39 while the market waits for the earnings catalyst. That report would then determine the next substantial move up or down.
In short: BULL is at a technical decision point, with momentum indicators improving, macro pressure easing, and earnings close enough that either a near-term wedge break or a consolidation-before-catalyst are both reasonable outcomes from here.
$BULLExecutive Summary: The current technical picture for NASDAQ:BULL is one of consolidation at a critical juncture. The price action lacks a strong, clear directional trend in the immediate term, but two distinct scenarios are emerging based on its behavior around key levels. The overall outlook remains cautious, with a defined support level acting as the line in the sand for the bullish thesis.
1. Current Market Posture and Key Support
At present, the chart for NASDAQ:BULL does not present a strong directional bias or a clear, complex pattern. The price is consolidating, and the primary focus should be on a critical support level.
Critical Support: $8.00 - This level is paramount. A decisive break and close below $8.00 would signal a significant weakening of buyer defense and could open the door for a deeper correction. Vigilance is required at this level; it must hold to maintain any potential for a bullish recovery.
2. The Bullish Scenario: A Springboard from $9.30
For a more optimistic outlook to develop, NASDAQ:BULL needs to demonstrate strength from its current trading zone.
Trigger for Upside Movement: $9.30 - We are watching for a convincing move upward from the vicinity of $9.30. A strong bounce from this area, accompanied by increasing volume, would be the first technical indication that buyers are regaining control and that a new leg up may be commencing.
Initial Projected Target: $12.00 - Should a sustainable rally initiate from the $9.30 level, the first logical profit-taking target would be $12.00. This represents a meaningful price appreciation and is a feasible objective if bullish momentum can build.
3. The Neutral and Bearish Scenarios
Neutral/Consolidation: The price could continue to trade sideways between the $8.00 support and a nearby resistance level, lacking the momentum for a decisive move in either direction.
Bearish Breakdown: As emphasized, a failure to hold the $8.00 support is the most significant risk. Such a breakdown would invalidate the potential bullish setup and likely lead to further selling pressure.
Conclusion and Strategy:
In summary, while the chart for NASDAQ:BULL is not currently displaying a powerful trend, it is positioned at a critical decision point. The strategy should be one of patient observation.
Be Cautious: The overall tone is cautious due to the lack of a clear pattern and the proximity to major support.
Watch for Confirmation: Await a confirmed bounce from $9.30 with strength before considering bullish positions.
Manage Risk: Any long positions must use a break below $8.00 as a clear invalidation point to manage downside risk.
The path to $12.00 is feasible, but it is entirely contingent on buyers defending the $9.30 area and, most importantly, the absolute support at $8.00.

BULL outlook and necessary reversal confirmationsBULL is a tempting name for many being that it's traditionally compared to Robinhood in its' function. However, as a must younger company, they have ways to go in order to prove they are worthy of the attention Robinhood has received this year.
In this video, I outline the path necessary for BULL to prove a shift in control from sellers to buyers in the HTF picture. We can say that we are in a HTF bullish liquidity building structure (white) however in order to prove that, we need to see LTF confirmations.
Don't jump the gun too heavily on this one without the necessary confirmations!
Happy Trading :)

BULL - Just watching for a similar moveInverse H/S are often powerful and fast when the play out.
I will be watching this area for the next 4 weeks for any similarities or technical that aligns with the pattern formation
I'm already in a 2x position, will be using options 1 to 2 yrs out to make up the losses.
Good luck, this is one of my core spec stocks for 2030
RIVN, SOFI, HNST, BBAI and a few others

BULL - I was wrong and still looking for clarityIt appears the liquidation of this stock after decent earnings and shares being released on the market.
I can't justify this move down so low.
This was a SPAC, and typically hold the $10 area. I will be watching for any form of consolidation or accumulation. Could there be industry shorts on this with short interest of 12.00 million shares, representing 6.69% of the float (the number of shares available for trading by the public). This marks a -11.89% decrease in short interest from the previous month. The short interest ratio (days to cover) is 0.6, indicating that it would take 0.6 days of the average trading volume of 24.25 million shares to cover all short positions.
I am averaging into LEAPS 2027 and 2028, I believe there will be some volatility over the next 4 weeks. I hold a large bag of shares and looking to cut in half upon profitability.
Holding for the long term, SPEC stock along with RIVN

2H Bullish Divergence Clear bullish divergence with the RSI and WeBull.
Downside may continue, only to make another divergence point on the 2 hour timeframe…
Chart doesn’t say this can’t keep falling.. I believe this is quite the buying opportunity at these levels..
I imagine if the bullish divergence holds at a bare minimum we pop back up to retest around $10.30. Which is a clear support from back in June…
That’s the bare minimum from my view, another view could say that we shoot back up to around $12-13 for what could also be named as a retest of clear former supports.
If we make it to $10.30, then I imagine it also tests the 20 day at around $11 as of right now, of course the averages change slightly day by day.
If the market as a whole is in a downturn in general maybe BULL sits down here or a little lower for a bit and stalls the move to the upside I have mentioned.
I don't necessarily have a timeframe for any of this price action, I am really just paying attention to this bullish divergence on the RSI.
The MACD shares this divergence on the 2h timeframe and remains negative, so i’ll be paying attention to both…
I don’t necessarily care for downside targets because I am not shorting this, and the lower it goes the more I average down the cost of my shares.
Can’t figure out how to post pictures on this thing, but look for yourself.

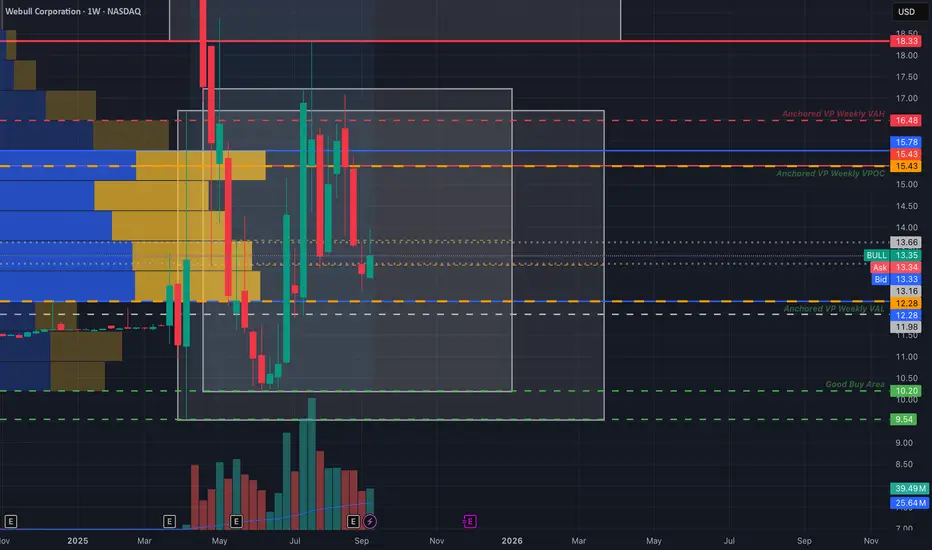
Webull Chart - Robinhood Competitor?Calling all matadors, we got a bull to corral.
I've charted some levels of interest for a speculative hold. Many view webull as a potential competitor for robinhood, although fundamentally, bull is in no-where near in the financial position that hood is in terms of free cash flow and expenses (or innovation as far as I've seen).
This could make a great swing trade on pure technicals. If the brokerage industry sees a period of exuberance(like we've seen in the quantum space), bull could catch a bid. This could also occur if we see a rotation out of hood.
I would love to pick up some shares or calls if the name completes a look below and fail of the anchored volume profile's value area low(around $12.28). or a LBAF of the box bottom @ $10.20.
So far webull has been consolidating. I believe a hold above the VPOC (volume point of control @ $15.43), a breakout of the lower boxes and reclaim of the larger upper box around $18.33-$18.87, could see a push to the mid 20s and 30s at least.
If we are following box rules for that potential trade, then I would not be surprised if bull goes to the box midpoint @ $48.97.
If this thing holds above the VPOC around $15.43 or does a LBAF of either $12.28 or $10.20 it's ripe for picking imo.
Now this is pure speculation, and my analysis could be a shack of shit, who knows, BUT if these set ups present themselves, I would like to roll the dice.
~ The Villain
I have too many shares of BULLSelling a covered call after 3 bull days in a row. I get 1%+ of premium. IF I Get called away at 15.5 I would be profitable.
Earnings are Nov 14th according to Think or Swim. So.. I'll see what BULL is doing around then.

$BULL - WeBull Corp - $12.54 RT - $15.38 PTNASDAQ:BULL has been consolidating since hitting a 3-month High at $18.35 and looks to be breaking out of that mid-level trend (Yellow) to retest the $12.54 previous support, where we expect some resistance. Looking for a continuation in that Price Level to make its way back to the $15.38's after a Double-bottomed off the $10.56.
RECENT NEWS:
Investors can now trade corporate bonds seamlessly on Webull's desktop and mobile platforms
NEW YORK, Oct. 16, 2025 /PRNewswire/ -- Webull (NASDAQ: BULL), an online investment platform, today announced the launch of corporate bond trading for U.S. customers. Investors are now able to buy and sell individual corporate bonds directly on Webull's desktop and mobile platforms.
