Long $CAN on breakout out of channel / wedge and steep pullbackWent Long on $CAN after breaking out of channel or wedge, on the end of quarter, after a very steep pullback, and in the context of Tech and Semis being strong.
- Entry: At 20.64 underlying, 2 vertical debits @ 22.5 / 45 strikes, for 3.19
- Target: 30 to 32 underlying, will look to hold half in case of a runner.
- Stop: Daily close and acceptance below 14
Trade ideas

ALL blockchain stocks are 1 WEEK behind in priceBitcoin is running to alltime highs. I have taken deep positions in RIOT, MARA, CAN, and XNET.
Price action is lagging a week behind, but will soon snap to attention once the heard wakes up. Don't be late!

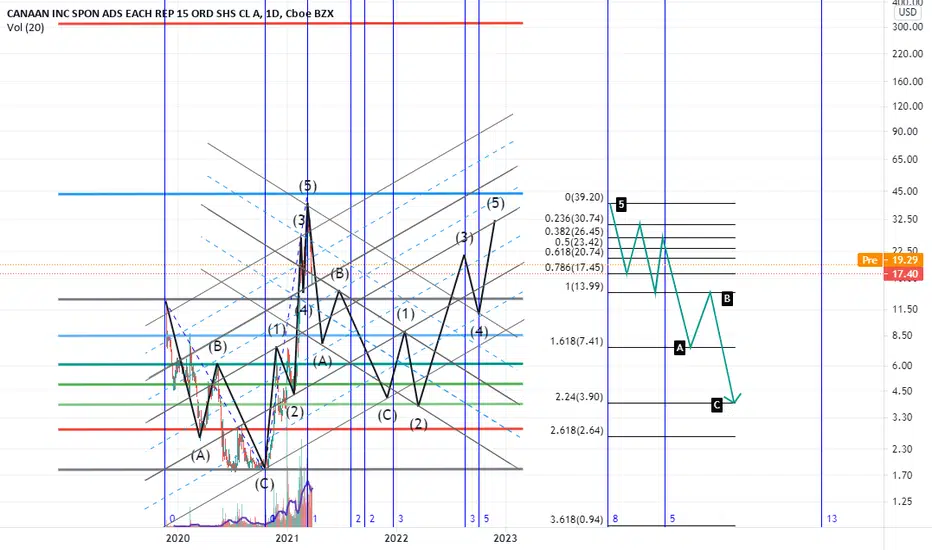
New longer term price path for CANNIt seems like a new 'longer term' price path for CANN has been setup with the recent pullback. This could be due to the recent decline in cryptos and the change in rules around crypto mining in China, but that's simply a guess.
The fib. retracement suggests the price may test a new possible resistance area around $30; at that point I would expect another pull back to widen the stance on the overall valuation.
Remember, all this is pure speculation and is not financial advise.

ABC targets with shark pattern and cypher reversal scenarioin the path of the slide must retest key level of the Fibonacci
CAN Bounding off Trend Line / Fib?Could CAN be bouncing off of trend line and 0 fib line? Interesting that the trend line and the fib intersect right where CAN found support this week. Thoughts?

Canaan Could be a good entry opportunity if it closes the gap and bounces of it's weekly EMA support at 13$
So we have:
1. A potential retest of weekly 21 EMA
2. Closing it's Gap at 13$
3.A potential cup, and handle forming
The market is nuts right now+this is a volatile stock, if it goes below this range, i'm not touching it nor at the moment. ( Unless there will be a big bounce, and a closing candle on a daily chart above 50 EMA-18$ )

CAN potential breakout dates, uptrending channel$CAN looks like its in a wide uptrending channel, and using the fib timezone tool on a key trendline support and gap I was able to locate some key potential gap days (as seen by the vertical blue lines).

CAN follows Bitcoin and jumps on Fed newsThe Federal Reserve now sees inflation running to 2.4% this year, above its previous estimate of 1.8%. The central bank now expects real gross domestic product to grow 6.5% in 2021, compared with its 4.2% forecast from its December meeting. The Fed estimates the unemployment rate will fall to 4.5% in 2021, below the previous estimate of 5%. Do your own due diligence, your risk is 100% your responsibility. You win some or you learn some. This is for educational and entertainment purposes only. Consider being charitable with some of your profit to help humankind. Good luck and happy trading friends...
*3x lucky 7s of trading*
7pt Trading compass:
Price action, entry/exit
Volume average/direction
Trend, patterns, momentum
Newsworthy current events
Revenue
Earnings
Balance sheet
7 Common mistakes:
+5% portfolio trades, risk management
Beware of analysts motives
Emotions & Opinions
FOMO : bad timing
Lack of planning & discipline
Forgetting restraint
Obdurate repetitive errors, no adaptation
7 Important tools:
Trading View app!, Brokerage UI
Accurate indicators & settings
Wide screen monitor/s
Trading log (pencil & graph paper)
Big organized desk
Reading books, playing chess
Sorted watch-list
Checkout my indicators:
Fibonacci VIP - volume
Fibonacci MA7 - price
pi RSI - trend momentum
TTC - trend channel
AlertiT - notification
www.tradingview.com

Long | CANNASDAQ:CAN
Possible Scenario: LONG
Evidence: Price Action
TP1 ~ 37.5, TP2 ~40, TP3 ~45
This is my idea and could be wrong 100%,


CAn Long - as soon BTC starts going up!RSI around 40 is an good indicator before it goes up, It need som more timen to prepare for pullback.

CAN: Bullish Pennant (67%)Bullish Pennant (67%)
Pros:
Volume during post formation
Descending volume during triangle formation
Golden cross in blue
PPS above 50MA and 200MA
RS above 0 and ascending
ATR Ascending
R/R ratio above 4
250RSI above 50
200MA ascending, barely
Target:
PT = 56.78$
Help how ever you can to keep this alive.
Thank you to those who have donated Coins!
Always do your own due dilligence. This is not financial advice
Stay Humble, have fun, make money!
Education:
www.dailyfx.com

Perfect time to short..!Potential price drop: 30-40%
Reward/Risk:3
Timeframe: less than 1 months
I always try to present the charts in a simple comprehensive format to prevent any confusion.
This is just my technical view, neither a fundamental comment,nor a recommendation to trade..!
Please review my track record and calculate the odds for yourself..!
You’re likes and comments encourage me to continue this.
Stay tuned great live stream and quality content videos coming soon..!

CAN on the rise?Great bitcoin run which will profit all the bitcoin farms / bitcoin related business

Tight correlation to BTCCAN, EBON, MARA, RIOT, All sharing the same price action as BTC.
I plan on longing CAN due to BTC not finished with its bull run.
Expect corrections along the way!

This stock is on fi-yaaaaaI am long on this stock, if BTC rises this will as well but today was a big run if you are looking in you should wait or dip your foot in at this level.
This stock will get up to about 40 tomorrow then correct down to 32 by Monday then you should buy it when it corrects because there will be no stopping it.
This stock was 18 last week and 6 dollars in January, it is on fire and it's not stopping.
Not a financial advisor, manage your own risk.

CAN Double bottom/Cup and HandleLooking nice with the chart pattern here with CAN. seeing what looks like a double bottom or cup and handle through 4h & Daily time frame. Plus added confirmation of Bitcoin breakout. CAN compared to MARA & RIOT, looks like there still room for price increase. leaning towards the long side on this one still.

CAN shortnice short for CAN
Tried to test resistance around 25$ and got rejected..
Im planning to buy it back around 19.20$
Not financial advice!

CAN Bitcoin stock possible breakoutCAN above EMA 8, SMA 20, SMA 50, sma 150, and sma 200 in perfect alignment. Supported by PSAR dot about to switch below the candles. Leaning towards the bullish side on this one, similarly with RIOT and MARA. CAN should be priced above $20 of around $40 - $50 for me. Bitcoin and high market cap cryptos are breaking out bullish flag pattern as well.

Why cryptocurrency $CAN stock surged in February?$CAN stock surged in February as the extended rally in cryptocurrencies continued to boost $CAN stock.
CAN stock is particularly well-positioned to benefit as a maker of Bitcoin mining machines, presently scarce and in high demand.
Last week, Canaan announced “improved revenue visibility” for 2021 after receiving orders for 100,000 mining machines in North America, many of which were prepaid.
Canaan Creative is just the latest beneficiary of the recent rush into cryptocurrencies.
Founded in 2013, Canaan released the first ASIC-powered Bitcoin mining machine and is currently the world’s second-largest designer and manufacturer of BTC mining machines.
finance.yahoo.com


