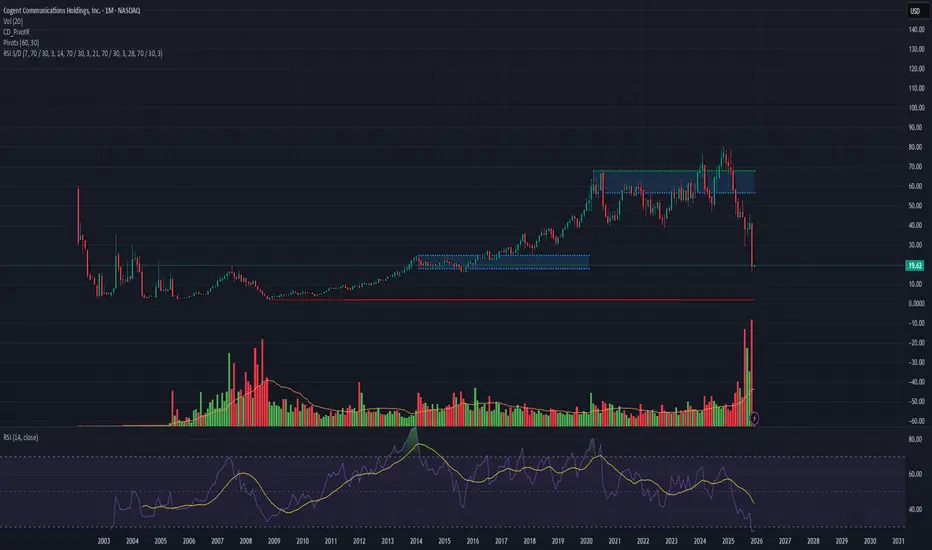
CCOI Fast Bounce Setup | 19.62 → 20.60(+5%)
CCOI just printed the highest monthly volume in its entire history since IPO 🔥
This type of volume spike often signals a short-term reversal or momentum bounce.
RSI Behavior 🔍
Across the daily, weekly, and monthly intervals, RSI has shown a repeated pattern of bouncing 10%–100% after oversold conditions.
Based on this history, a 5% bounce from here is completely reasonable and aligned with previous cycles 🎯📉➡️📈
Fundamentals 📊
Revenue forecasts are improving and gradually compensating for weaker past years.
This supports the upside even during a downtrend.
Risk Note ⚠️
Catching profit in a downtrend is always aggressive.
But the volume structure + RSI behaviour build a strong short-term case.
As always, we only select stocks with predicted revenue growth, that are oversold, and that show a repeated behavioural pattern in similar conditions.
Our strategy is not based on one fixed formula for all stocks.
Each symbol has its own unique pattern that repeats historically, and we focus only on that repeated behaviour. This is why every setup is different — it must match the stock’s own history. 🔍📈
Market insights
CCOI: interim correction?A price action below 76.00 supports a bearish trend direction.
Increase short exposure for a break below 75.00
The target price is set at 71.00.
The stop-loss price is set at 80.00.
The confluence of the 200-day and 200-week simple moving averages seems to be a price objective over the next couple of weeks.
Remains a risky trade as the price action is merely seen as a counter-trend correction as a trend change.

CCOI PRICE ANALYSISFor now im seeing a bearish continuation
Observing strength of trend i see a pssible bullish continuation at 50.34
SENNA SEASON


CCOI , Ready for a bullish reversal soon. I believe CCOI is a great low Rsi reversal play. Also, in my opinion, the recent earnings reports are actually not that bad. They came in with a positive EPS of 0.18, which is 21.55% lower than estimated but they still had positive earnings. Taking into account the low Rsi ,extremely bullish put/call ratio and overreaction on the earnings report, I think I see a great potential for a nice price reversal here .
Shorter term Fibonacci price targets assuming a bullish trend :
Target 1 : Around $72
Target 2 : Around $76
# Watch the RSI levels too though ....
Call/Put ratio as per options is 0.31 ( bullish )
Call volume is high and put volume is low .

Cogent Communications $CCOI$CCOI is on uptrend and targeting $100.
12 months Consensus Price Target: $82
if you find my charts useful, please leave me "like" or "comment".
Please don't trade according to the ideas, rely on your own knowledge.
Thx


Watching to go long on the break of consolidationIn Brian Shannon's book he mentions the following sign for indication end of an accumulation phase:
o Higher lows
o Increased trading volume
o More frequent test of a key level of resistance
o Flattening to rising action of longer-term moving averages
In the above chart $CCOI seems to display higher low, frequent test of level of resistance, and flattening of longer-term moving average.


MACD cross on strong volume. OBV broken up & ADX weakeningCCOI is appropriate as a long trade with a target of $36.49 which is the 0.382 fib retracement level and also at the prevailing downtrend. It may face short term resistance @ 35.54 but anticipate a clearance of this level based on strong volumes and break upwards of the OBV. The MACD cross cements all of the above.
