Question.. (educational)Hello all, I'm relatively new to TA and I was wondering if the area I outlined with the red lines was showing any sign of 'iceberg' play? I thought of it because of two things, the length of time spent at the new price range and the slight jumps, indicated by small triangles, seen earlier on during the possible play? My current understanding of the iceberg methodology is to have the time-frame rather large and to 'create' these small spikes to further stoke the plateau. If I am wrong please don't hesitate to say so and also please include why and what kind of indicators I should look to for confirmation/rejection of the idea. Also I understand that TA includes going back to the financial records from the quarters involved, especially when looking at such a larger range of time. Are there financing indicators I should look for in those reports such as those found in the 10-Q?
Let me be clear, I do not actually suspect this is in play, nor am I anywhere near upset/conspiring. I am only asking this to learn more about such a maneuver and what kind of things trigger more serious consideration of it than those that my novice eyes can spot. Any contributions appreciated. Thanks!!
FSLR trade ideas

Green For The Rest Of The Year.As you can see the price is at a strong support, plus you see a clear Bullish divergence on the RSI and CMF indicators.


Possible FSLR Short Term UptrendNASDAQ:FSLR has tanked lately do to China cutting incentives for solar energy in the rest of 2018. The market has reacted to the news and now the stock is very oversold. My outlook is for the stock to climb back up because of the strong volume shown in the last trading day.
Share your opinion, comments and questions. Good Luck!
I will keep updating this post.

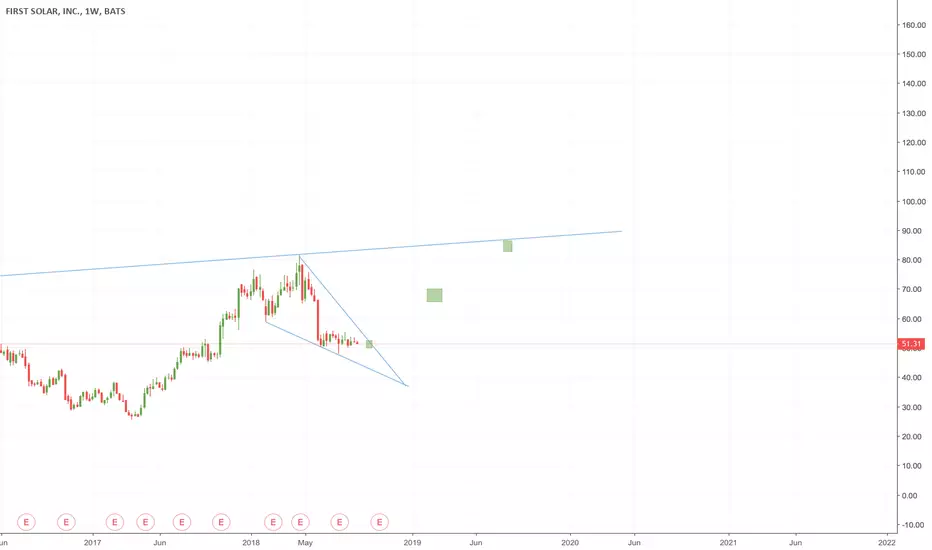
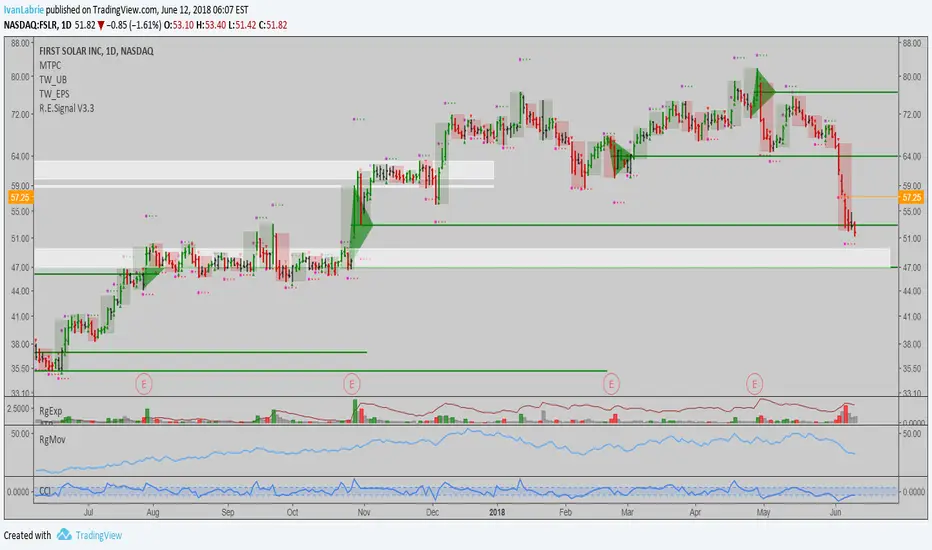
$FSLR - Went to my magic 8 ball for this one A while back sometime after the intense plummet in price I remember this ticker (somewhat) expecting a dead cat bounce - never really even got that lol. Like plenty of other people I'm sure, I lost some $$ with this one. What was even more frustrating was the fact that CEO probably was more bearish on his own stock than other bears were (multiple, multiple insider transactions selling mad often). I kept it on watch more-or-less just because I wanted to see how the chart would play out since, so long after consolidation there HAD to be some technical catalyst for a breakdown / breakout - important to note though, despite how far the price plummeted, I wouldn't consider it in a down-trend unless 180WMA was below both 193 low EMA & low 315 EMA. Wasn't too long ago I found a few comparisons to go off of where price plummets (typically, big gap down is involved) but sits in consolidation right on major support / downtrend considerable ranges until the "curve" of lows is capable of making new highs (since price hasn't done anything but consolidate after a major move). The 55 low MA (the "Curve") & its placement / degree @ an angle is more of a leading indicator than a lagging one for me. Acts differently in every which setup I see, but I'll leave the examples I found to clarify where I'm coming from. The red lines in all 3 charts act as a countdown until the "Curve" slopes up (either candle before the gap down, or candle that breaks support of the previous price range). Not that price breaks out RIGHT after, but you'll see in both examples there's a steady increase before the obvious breakout of that consolidation is made clear. BUT, like I said, this is the magic 8 ball. Not my most reliable setup, but not TOO much of a coincidence to potentially see. Fib re-traces are all different since this isn't the chart I see all the time, but long story short - up-swing ends up around 127% if not where the white curve started to slope down-ward in the first place.
Ex. 1 -
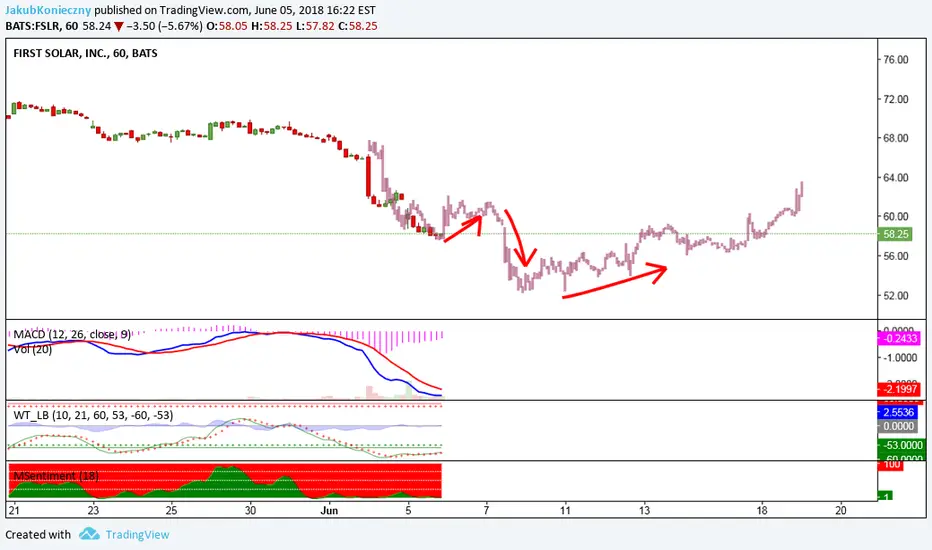
Ex. 2 -


FSLR- BIG ER play FSLR will go up tomorrow on its ER, the stock has been going through the accumulation phase on the monthly weekly and daily time frames. This sets them up for a perfect explosion for this ER. In addition, the RSI is fairly low and the 8 EMA is holding as support. Furthermore, the volume is stable showing that the accumulation is getting charged up and ready to explode.

Hammer TimeNice buying pressure came back today forming the Hammer candle. Should be getting a pop soon.

Would like to see a run up before earningsGot a pump on CNBC on Friday. Hopefully some follow thru early next week.


FSLR: Aggressive long...long term implicationsI like $FSLR here, I've been buying gradually for the last few days, but looking to also take a shorter term position here. It might be a good spot to buy long term OTM calls, but you can also go long with a tight stop if today we see a new daily high. If you are not positioned and looking for exposure to solar, then a 1-10% long term position built gradually during a few days up to a month would be ideal for you. Long term, the chart implies we could go to $400 without much problems.
A reminder of why solar is so bullish here: www.greentechmedia.com
Best of luck,
Ivan Labrie.
$FSLR Lil bounce Heelllllllaa ugly chart but luckily for anyone long there might be a chance to see a gap fill & test some real support. I'll try & keep expectations low for this one just because I'm sure some bears might see this as a dead kitty but we'll know for sure once price reacts to the 61.8% / 127% re-trace.

FSLR First Solar Oversold and Extended Below MAs 4-8% OpptyFirst Solar is currently well oversold and has hit a previous market structure area. The price has extended below the short term and long term MAs. Targets of 4 - 8 % based on previous price structure.

Looking for FSLR to hit 58Significantly oversold on the stochastics. Looking for retracement to $58. Any thoughts?

$FSLR Kitty Heelllllllaa ugly chart but luckily for anyone long there might be a chance to see a gap fill & test some real support. I'll try & keep expectations low for this one just because I'm sure some bears might see this as a dead kitty but we'll know for sure once price reacts to the 61.8% / 127% re-trace around $63.


Bullish Cypher PatternFSLR is about to trigger Bullish Cypher Pattern, entry is close to D point with target of around $70

Just above the convergence of a support zone / rising trend lineThe PLAN:
1) Entry just above the point of convergence of a support zone and rising trend line (around 68USD)
2) Exit before the resistance level at 74USD
3) Risk/Reward: 2.6
4) Stop loss: below the support zone / trend line

First Solar (FSLR) has formed a pin bar.First Solar (FSLR) has formed a pin bar yesterday.
Title is coming from a 5 consecutive loosing days and pin bar could be a good signal of reversing.
Stock strenght is above 72!
Watch the stock and lets see if slowstochastic is going to reverse or check on lower timeframes if there is a entry signal (may be 72.64).
Disclaimer:
This is just my tought: don't invest based on this idea.
