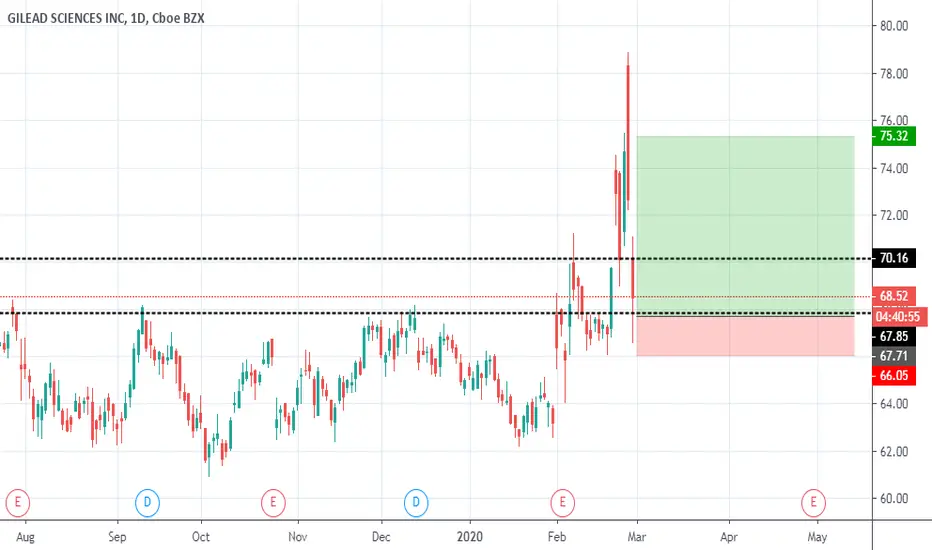
GILEAD In the LeadCharting historical Support and Resistance levels. Gilead was on track to have an improved 2020 financials wise even before Corona Market. They are the front runner for vaccine in terms of drugs already in trials to treat similar COVID diseases. They also have two drugs being tested and waiting to be approved in China for cancer drugs which will continue to bolster stock if looking to hold long term. Many smaller biotech stocks with few to no results were losing value even in the bull market of last few months, now once Corona fears subside or companies have patented successful drugs, those companies will go back to losing their value and I think player like GILD are here to eat that up for those still looking to invest in biotech, but not penny stocks. Considering how manic this run up has been, the tests at the historical levels have been met and beaten, just not for as long as we'd like to see. Seems likely to have a small correction 03/09 as it's now at the level it was previously brought down sharply, but if mooning through 82.50 without dropping below 78.50 then it's clear to have another discovery between 85-90.
Summary:
Good long term investment. Good swing trade. Scalping could cause a shortened lifespan, though huge room for profit (and loss =D)
Market insights

Officially ate the prior large red candleGiven the sexy story behind, gap up on Monday is very likely. If not, can add more.


Elliott Wave View: Gilead Sciences Bullish Cycle Heating UpGilead Sciences ($GILD) is starting to show signs that it may be in the beginning stages of new bullish cycle from an elliot wave perspective. The Long term chart shows a completed bullish sequence in 5 waves for Blue (I) which topped on June 22/2015 at 123.37. From there a corrective sequence took place for Blue (II) which bottomed on Dec 26/2018 at 60.32. From there a new bullish cycle may be starting with an equal legs area of 183.78 to 260.01 for Blue ( III ).
On a 4h view, after setting a wave ((1)) top on Feb 1/2019 at 70.50 a lengthy wave ((2)) took place in the form of a double zig zag correction. Wave ((2)) bottomed on Oct 3/19 at 60.89 and from there some nesting has started. Blue wave (1) is set on Oct 24/19 at 66.75 and Blue (2) with an expanded flat correction is set on Jan 21/20 at 62.23. From there another 5 waves up has been set, for a nesting red 1-2 taking place. Price action suggests a wave 3 break out is imminent.
The Corona Virus (COVID-19) has brought a lot of attention to Gilead recently but the Elliott Wave analysis suggests that Gilead Sciences had a bullish setup before the virus surfaced. The momentum from the virus may be but one small element that helps push Gild to new all time highs, and eventually the 183.78 to 260.01 area for Blue ( III ).

Gilead: Dynastic family wealth if you happen to surviveOne trade for dynastic family wealth if you happen to survive the coronavirus epidemic. I'm already in from $73, but entry isn't too important given the degenerate long target.
Long with stop at the previous consolidation of $65, target $230.

Gilead Science Trade setup $gild
Alert set for break above $81.00
Target price $85.00 to Fibonacci expansion channel.
PLEASE GIVE US A LIKE IF YOU APPRECIATE OUR CONTENT, THANK YOU.


Gilead undervalued stockPlease click like if you enjoy my analysis and don't hesitate to write your comment.

Gilead WeeklyDown to 60 / 47 up to 170 In the future.
Deepest pullback to 25 zone. Don't see it happening. This will be the first bounce off the red ribbon. Usually it is always quite strong once we touch it.
Good buy zones :
$42 - 50
Good sell zone:
$150 - 170

LONGcomparing the trend derivatives I see a 67% chance of rising until tmr an hour before close when it will reverse again. I also have a 33% chance of the stock falling until an hour before close tomorrow. factoring in news on corona virus this may have an even higher chance of rising

The cure for COVID -19 Virus is here !Maybe, like me , you had missed this stock's recent 20 over percent jump in share price?
Fret not, another opportunity is here! You may be buying at a slightly higher price but looking at the chart and the current situation, this stock still has some way to go up.
First thing first, if tonight, it does heads up, it might close the gap between 71-72 dollars. So , that is like a 3 dollar profits already. If that happens, then we can expect it to go even higher towards 80 and beyond.

GILD longvery high upside with slight possibility of a corona virus medication. although without the virus or not it looks good in the long term to me


$GILD - August Calls MuthankyLog chart. high volume breakout, but it just so happens we did a retest of the breakout now (even if it is an ugly candle). Sentiment surrounding this company has some pretty serious pop-potential. August $80 calls seems like a decent bet.


I pened this trade yesterday and going well on Breakeven nowI opened this lot yesterday and going well on Breakeven now. closed half and wait for retracement

Gilead Science target level $gildHavin broke out from a long term downtrend as previously posted, they stock is now just at the beginning of a very bullish move to the upside.
Afterhours today the announce that 2 phase 3 studies had begun for a antiviral coronavirus drug .

Pharma is better than goldI think in the current market, pharma stocks like GILD will rise by the end of the year.

