Alphabet - This stock is reversing now!🔪Alphabet ( NASDAQ:GOOG ) is reversing very soon:
🔎Analysis summary:
Alphabet created a textbook all time high break and retest back in mid 2025. The recent rally has therefore been totally expected. But now, Alphabet is totally overextended, retesting a major resistance trendline and about to also create bearish confirmation.
📝Levels to watch:
$300
SwingTraderPhil
SwingTrading.Simplified. | Investing.Simplified. | #LONGTERMVISION
Market insights

Copper is primed and READYSo this decade precious metals have finally shown volatility. Gold and Silver have been a highlight especially with the past Administration boasting EV, GREEN-NEW DEAL, and now with AI; Precious metals are showing that people as of right now prefer a physical safe haven asset rather than “code” like cryptocurrency. Even now with the Trump administration, space exploration and the ongoing need and increasing demand for more precious metals is obviously making these assets worth looking at BUT one metal that stands out the most but no one is talking about, is COPPER (CU)!
COPPER is by far primed and ready to show what its really made of. Often overlooked, with pennies being disclosed as being “worthless,” it takes more to produce 1 penny than what its actual value is, with only 2-4% of modern day pennies being made of Copper (CU) and 96%+ being zinc and other over supplied metals. Why?
By 2026 the US Government will stop printing pennies, and any 1 cents transactions will now be rounded to the nearest Nickel.
Gold and Silver showed similar chart patterns, and experienced almost the same innovations that lead to its increase demand thus leading to price being bullish as well. One thing that leads me to believe COPPER IS VERY UNDERVALUED is the FACT that silver mining and gold mining can be done by basically any individual with an increased appetite to fund a business venture of 1mil+, and in this day and age thats more common than you think. But copper mining takes at least 10times more money, and it takes at least 15 years to get a Copper Mine up and ready before you start to dig your first ore. With that being said, and the fact that most copper mines if not all of them up to unow, are starting to show depletion…. its TIME.
Technical analysis is simple here, Monthly outlook, breakout easily show, target is anything above $30 but im specifically aiming at $34.34. Goodluck

Alphabet - The exceptional short setup!🔒Alphabet ( NASDAQ:GOOG ) is reversing right now:
🔎Analysis summary:
Alphabet is clearly indicating a major bearish move. With the current retest of major resistance, Alphabet is slowly reversing. Since Alphabet is also massively overextended, really everything is pointing towards a move lower. Just give it a couple of days to reverse.
📝Levels to watch:
$300
SwingTraderPhil
SwingTrading.Simplified. | Investing.Simplified. | #LONGTERMVISION

$GOOG looking to breakout Power of 3 touches on the top trendline along with Monday's candle closing above the daily 20 MA to give it that support push breakout we need for new ATHs..

GOOGL: Pullback Entry in a Powerful UptrendGOOGL remains attractive for potential entry, supported by a constructive technical setup. The stock has found support at the 20-period EMA and has formed a bullish candle pattern, highlighting a favorable entry zone. Despite a strong rally of approximately 120% since April 7, 2025, there may still be further upside potential. Fundamentally, the company continues to demonstrate top-tier quality and remains a core portfolio candidate. Revenue and EPS have delivered consistent double-digit growth over the past five quarters, while profitability metrics remain robust, with ROE and ROIC sustained above 35% during the same period. Net margins have also been impressive, holding above 20%. The current P/E ratio of around 31, slightly above the five-quarter average, suggests the market maintains a positive outlook on the company’s earnings prospects. NASDAQ:GOOG

Alphabet Inc. (Google) pressing key resistance as traders eye up
Current Price: $314.96
Direction: LONG
Confidence Level: 67% (Several professional traders highlight upside momentum and specific breakout levels, while social sentiment is bullish but light in volume. Signals aren’t perfect, but the balance of trader commentary favors upside.)
Targets:
- T1 = $320
- T2 = $328
Stop Levels:
- S1 = $310
- S2 = $306
**Wisdom of Professional Traders:**
This analysis pulls together the collective wisdom of professional traders and market experts who are actively tracking Alphabet Inc. (Google). When I review what multiple traders are saying across recent sessions, I see a recurring focus on upside continuation driven by AI momentum and strong technical structure. Crowd-based analysis matters here because repeated reference to the same levels often signals where real money is positioned.
**Key Insights:**
Here’s what’s driving this setup. Several traders are watching the $320 area closely, with repeated mentions that a clean break could open the door toward $328 in short order. This isn’t just hope-driven commentary; traders consistently point to price holding above the 50-day and 200-day averages as evidence that buyers still control the trend.
What’s interesting is that despite some caution around insider selling and short interest, the broader trader consensus still expects dips toward the $310–$312 zone to attract buyers. I’m seeing more discussion about buying weakness than selling strength, which tilts the balance toward upside continuation this week.
**Recent Performance:**
You can see this play out in recent price action. Alphabet has been grinding higher and holding above $310, with shallow pullbacks and quick recoveries. Volume has been lighter than average, but price structure remains constructive, and the stock continues to respect higher lows into year-end trading.
**Expert Analysis:**
Traders are talking about this one. Multiple professional traders mentioned that if $320 is cleared and held, momentum algorithms are likely to kick in, pushing price rapidly toward the $328 area. On the downside, several traders independently highlighted $310 as the first line of defense, with stronger support clustered around $306.
When I line these comments up, the picture becomes clearer: upside targets are more frequently and more confidently discussed than downside scenarios. That’s a meaningful tell.
**News Impact:**
Recent developments add fuel here. The Intersect Power acquisition supports long-term AI infrastructure margins, while Waymo’s fresh funding keeps the autonomous narrative alive. Add in ongoing chatter around Gemini 3 performance, and traders see enough positive catalysts to justify leaning long into resistance rather than fading it.
**Trading Recommendation:**
Putting it all together, I’m staying LONG on Alphabet Inc. (Google) this week. I like entries near current levels or shallow dips toward $312, targeting $320 first and $328 if momentum builds. I’m keeping risk tight with stops at $310 and $306, since a loss of that zone would invalidate the near-term bullish structure. This isn’t a runaway conviction trade, but the trader consensus and technical setup make the risk-reward attractive right now.

GOOGL Sliding in a Controlled Channel–Compression Before Dec 29GOOGL heads into Dec 29 in a controlled bearish drift, not capitulation. On the 15-minute chart, price has respected a descending channel, with a confirmed BOS to the downside followed by weak bounce attempts that failed to reclaim prior structure. This tells us sellers are active, but not aggressive — typical of dealer-driven positioning rather than panic selling.
From an SMC perspective, the key failure occurred near 315–316, where price printed a CHoCH but lacked follow-through. That rejection confirmed supply dominance, and price has since been walking lower toward the 312 liquidity shelf, which is now the main short-term decision area.
Key Levels to Watch (Dec 29)
Support:
* 312.30–312.00 → current demand / intraday base
* 308.50–307.50 → major liquidity + demand zone
* 300.00–295.00 → extreme downside if macro pressure expands
Resistance:
* 314.00–315.10 → first reclaim level (structure shift needed)
* 317.50–320.00 → stacked call walls / gamma resistance
* 322.50–325.00 → unlikely without broad market strength
GEX & Options Positioning (Key Driver Here)
GOOGL’s options profile shows strong positive NETGEX above 315, creating a clear upside cap unless price forces dealers to hedge higher. Notable levels:
* Highest positive NETGEX / call resistance at 315
* Additional call walls at 317.5 and 320
* PUT support concentrated below 307.5, with a larger pocket near 300
IV remains moderate, and CALL participation (~24%) is not aggressive — reinforcing the idea that this is controlled distribution, not a squeeze setup.
Trade Scenarios for Dec 29
Bearish Continuation (Primary Scenario):
If GOOGL fails to reclaim 315 on a 15-min close, expect continuation toward 308–307.5, with a potential grind into 300 if market pressure increases.
→ PUTs favor 315P–310P, manage size due to slow pace.
Bullish Reclaim (Lower Probability):
A clean reclaim and hold above 315.50 could trigger a squeeze into 317.5–320, but that zone is expected to act as sell-side supply, not breakout fuel.
→ CALLs only make sense after structure reclaim, not on anticipation.
Dealer Chop / Pin:
Between 312–315, expect chop and failed breakouts. Scalps only.
Bias Going Into Dec 29
Short-term bias remains neutral-to-bearish, with sellers controlling price below 315. Bulls must reclaim structure decisively to shift momentum; until then, rallies are likely capped by gamma.
This analysis reflects my personal technical opinion and is for educational purposes only. It is not financial advice. Always manage risk and trade responsibly.

GOOGL - Going for another ATH=======
Volume
=======
- expanding
==========
Price Action
==========
- Inside candle bar with decent bullish recovery
=================
Technical Indicators
=================
- Ichimoku
>>> price above cloud, pointing up, rebounded at lagging
>>> Green kumo still strong
>>> Tenken - Above clouds & Lagging
>>> Chiku - above clouds & flat
>>> Kijun - above clouds, Conv and Lagging & pointing up
=========
Oscillators
=========
- MACD at early bullish reversal
- DMI neutral, early bullish movements
- StochRSI, early bullish reversal, K crossed D and entering band
=========
Conclusion
=========
- short to long term breakout swing
- price may reverse or range at current level, to enter spot or wait for pullback at entry 2.
- Entry and exits depends on your time horizon and risk management.
=========
Positions
=========
Entry 1 - $308.15
Entry 2 - $303.45
Stop - $294.50
Exit 1 - $311.50
Exit 2 - $315.50
Exit 3 - $321
Exit 4 - $324.50
Exit 5 - $335

Just In: Alphabet Inc. (NASDAQ: GOOG) Surging in Early PremarketShares of Alphabet Inc. (NASDAQ: NASDAQ:GOOG ) is experiencing a notable uptick of 0.63% in early market trading on Monday albeit market condition. The asset last close trading session was up 1.67% on Friday.
In recent news, A Spanish consumer rights association on Friday said it had launched preliminary legal action against Google for allegedly collecting sensitive personal data and violating their right to privacy.
The Association of Communication Users (AUC) says the US tech giant collected data about users' personal opinions, religion, sexuality and health through applications and the Android operating system, supporting their claim with a study by a Dublin-based university professor.
"Technology and the desire to provide a service have taken precedence over putting in place safeguards to protect people's privacy," AUC secretary general Bernardo Hernandez told AFP.
"The issue of privacy is extremely scandalous because not even the bare minimum is protected," he added, saying Google could have provided the same services without unnecessarily collecting "an excessive amount of data."
Analyst Summary
According to 44 analysts, the average rating for GOOG stock is "Strong Buy." The 12-month stock price target is $307.02, which is a decrease of -0.52% from the latest price.
Important Dates
The next estimated earnings date is Tuesday, February 3, 2026, after market close. The stock price has increased by +62.30% in the last 52 weeks.

GOOGL Dec 22 – Breakout ConfirmedGOOGL Dec 22 – Breakout Confirmed, Now Watching Acceptance Above $307
1-Hour Chart Analysis (Primary Structure & Bias):
On the 1-hour timeframe, GOOGL has already done the hard part — it broke out of a multi-day compression and reclaimed the $304–$305 value area with conviction. The impulsive candle that pushed price above prior structure confirms bullish intent, not just a stop run. Since then, price has held above that level, showing acceptance rather than rejection.
The prior downtrend line has been invalidated, and market structure has flipped bullish. Higher highs and higher lows are now in place, with price stabilizing just below the next resistance band near $308–$310. As long as GOOGL holds above $302, the 1-hour bias remains firmly bullish and favors continuation rather than mean reversion.
Key 1H levels:
* Structural support: $301 → $302
* Acceptance zone: $304 → $307
* Expansion zone: Above $308.50
15-Min Chart Analysis (Execution & Timing):
On the 15-min chart, GOOGL is consolidating tightly near highs after the breakout, forming a bullish pause / micro flag just under $307–$308. This is constructive behavior — price is not retracing aggressively, and sellers are failing to push it back below the breakout base.
SMC signals show a clean BOS to the upside, followed by shallow pullbacks that respect prior demand. There is no distribution pattern here — just compression and liquidity building. Momentum has cooled slightly, which actually improves the odds of continuation once buyers step back in.
15-min execution levels:
* Support to defend: $304.50 → $303
* Immediate resistance: $307.80 → $308.50
* Trigger: Acceptance above $308.50 with follow-through
As long as price stays above $303, dips remain buyable within trend structure.
GEX Analysis (Dealer Positioning & Confirmation):
The GEX data aligns well with the technical structure going into Dec 22:
* Highest positive NETGEX / Gamma Wall sits near $310, which lines up with the next logical upside target.
* CALL walls are stacked at $305 and $307.50, suggesting dealer hedging should continue to support price above the breakout zone.
* PUT support is concentrated near $295–$290, well below current price, creating a solid downside buffer.
This is a positive gamma environment. Volatility is compressed, downside moves are being absorbed, and once price clears resistance, dealer hedging can help accelerate upside toward the gamma wall.
My Thoughts:
GOOGL is behaving like a stock that wants higher prices. The breakout was clean, volume expanded, and price is now holding above prior resistance, not slipping back into the range. That’s the key difference between a failed breakout and a real one.
If GOOGL holds above $304–$305 into Dec 22, the path of least resistance remains toward $308 → $310. Acceptance above $308.50 could quickly open the door for a push into the low $310s, especially with gamma stacked overhead.
The only scenario that weakens this view is a failure back below $302, which would signal a false breakout. Until then, the structure favors patience on the long side.
Options Outlook (Week of Dec 22):
* Bullish continuation: 307.5C or 310C if price accepts above $308.50.
* Pullback entry: Calls near $304–$303 if price holds structure and momentum stabilizes.
* Risk hedge: Short-dated 300P only if $302 breaks decisively.
* Volatility note: IV remains relatively low, favoring directional call plays over premium-selling strategies.
Conclusion:
GOOGL has confirmed a structural breakout and is now building value above former resistance. The 1-hour trend defines the bullish bias, the 15-min chart provides clean execution levels, and GEX confirms supportive dealer positioning. Above $304, buyers remain in control. Acceptance above $308.50 sets up the next leg toward $310+.
Disclaimer: This analysis is for educational purposes only and does not constitute financial advice. Always do your own research and manage risk responsibly.

GOOGL – Jan 2 Thoughts (15m first, then what’s controlling priceLooking at the 15-minute chart, GOOGL already told us a lot before the session even ended.
We had a clear CHoCH, followed by a BOS, which broke the prior bullish rhythm. After that, price didn’t collapse — it slowed down. That’s important. Instead of continuation, GOOGL slid into a tight compression around 312–313, holding just above the last structural low.
This is usually the part where traders get impatient. Candles get small, indicators stop helping, and everyone starts guessing direction.
But this kind of pause after structure damage usually isn’t random.
Zooming out one layer — this is where GEX explains the behavior
On the GEX side, GOOGL is sitting almost perfectly at 312.5, which happens to line up with dealer support / gamma balance.
A few things stand out immediately:
* 312–310 is a meaningful put support zone
* Below 310, downside opens fast toward 307.5 → 305
* Above price, the largest positive NETGEX / call resistance sits around 315
* That puts GOOGL in a very clean support–resistance gamma box
Once you see that, the price action makes more sense.
GOOGL isn’t trending because it’s not supposed to right now.
Dealers are positioned to absorb movement, not chase it.
How I’m approaching Jan 2
As long as GOOGL holds 312, downside pressure is likely muted.
As long as price stays below 315, upside is likely sold into, not expanded.
That creates a very specific environment:
* Slow moves
* Failed breakouts
* Better scalps at the edges than in the middle
If 312 fails with acceptance, GEX suggests a quick rotation toward 310 → 307.5.
If price pushes into 314–315, that’s where I’d expect supply, not celebration — unless gamma positioning changes.
Why this matters
The 15-minute chart tells you structure broke.
What it doesn’t explain is why price refuses to go anywhere afterward.
This is usually the missing piece for traders who feel like:
* “The setup was clean, why didn’t it move?”
* “Why does price keep stalling at the same levels?”
* “Why does this feel heavy even on green candles?”
That answer often isn’t momentum — it’s positioning.
Bottom line
GOOGL isn’t a trend play right now.
It’s a range-controlled, positioning-driven stock going into Jan 2.
Levels I care about:
* 312 as the pivot
* 315 as the upside cap
* Acceptance or rejection decides whether this stays controlled or turns directional
No rush here. Let price show whether it wants to leave the box first.
Not financial advice — just how I’m reading GOOGL heading into the first real session of the year.

Short GOOGBing is the next big thing, I can feel it, 2026, no one's gonna use Google anymore.
Target those 2 levels below.

GOOGL – Trendline Break, Pullback & Key Levels to WatchGOOGL maintains a bullish structure on the Daily timeframe — however, lower-timeframe price action has shifted into a more sensitive zone.
On the 4H chart, the ascending trendline has now broken, and price is actively pulling back to retest that structure.
The current area to observe is the $317 – $327 supply zone, where sell orders were previously triggered.
What stands out during this pullback is the decline in trading volume, suggesting buyers are losing momentum while price retraces.
As long as this zone is not engulfed (ENG), the expectation remains toward a corrective push — first into the $300 pocket.
If momentum accelerates during the correction, price may extend toward the second green zone marked on the chart, where a fresh decision awaits.
GOOGL is now positioned in a phase where patience and timing can make a meaningful difference.
For traders who follow structure and order-flow, the coming moves could define the next opportunity window.
📌 Regular updates will follow as the chart develops — staying connected ensures you won’t miss the next key shift.
`P NASDAQ:GOOGL NASDAQ:GOOGL ouryaabdi

ResistanceThe asset is facing resistance at a trendline, and is also consolidating. If asset breaks above the trendline the target is around 323 dollars, if resistance holds then target is probably around 292 dollars or so. Be careful.

Understanding the Forces Shaping Worldwide Economies1. Economic Drivers of Market Movements
At the core of global market fluctuations are economic indicators that provide insights into growth, inflation, and employment. Gross Domestic Product (GDP) growth rates, unemployment figures, and consumer spending patterns all influence investor confidence. For instance, when major economies like the United States, China, or the European Union show slower growth, global markets often react negatively, fearing reduced demand for goods and services worldwide. Conversely, strong economic performance in leading nations can boost market sentiment and fuel investment across sectors.
Monetary policies also play a crucial role. Central banks, such as the Federal Reserve or the European Central Bank, control interest rates and money supply. A rate hike to curb inflation can reduce liquidity in markets, affecting stock and bond prices globally. Similarly, quantitative easing or stimulus measures can inject capital into financial systems, boosting asset prices. Exchange rates and currency stability further affect international trade and investments, especially for emerging markets that depend heavily on foreign capital flows.
2. Geopolitical Events and Market Volatility
Global markets are extremely sensitive to geopolitical tensions, including conflicts, sanctions, and trade wars. For example, tensions between major powers can disrupt supply chains, increase commodity prices, and reduce investor confidence. Trade disputes, such as tariffs imposed between countries, directly affect multinational corporations, altering profit expectations and causing stock market fluctuations. Political instability in key regions, such as the Middle East or parts of Africa, can impact oil prices and global energy markets, influencing inflation and production costs worldwide.
Natural disasters and environmental issues are increasingly significant in affecting markets. Hurricanes, floods, or wildfires disrupt production and logistics, affecting commodity supply chains. Climate change concerns drive investment shifts toward sustainable technologies, reshaping global market priorities and creating winners and losers in different sectors.
3. Technological Disruption and Market Adaptation
Technology has transformed global markets, accelerating the pace at which information is disseminated and trades are executed. Innovations in artificial intelligence, blockchain, and financial technologies (FinTech) have created new investment opportunities while also introducing risks. Rapid changes in technology can disrupt traditional industries; for example, renewable energy innovations impact the fossil fuel sector, while automation reshapes manufacturing labor dynamics. Investors react quickly to these shifts, often leading to volatility in global stock exchanges.
Additionally, digital trading platforms and algorithmic trading amplify the speed and scale of market reactions. News spreads globally in seconds, influencing investor behavior and triggering rapid market movements. While these technological advancements increase market efficiency, they also create susceptibility to sudden corrections and speculative bubbles.
4. Globalization and Interconnectedness
One of the defining features of modern markets is globalization. No country’s market operates in isolation. Financial integration means that an economic shock in one nation can have cascading effects worldwide. The 2008 global financial crisis is a prime example: the collapse of the U.S. housing market and financial institutions triggered recessions in Europe, Asia, and beyond. Similarly, a slowdown in China, the world’s manufacturing hub, can affect commodity prices, supply chains, and corporate earnings globally.
Trade networks, investment flows, and multinational corporations link countries economically, while global indices and mutual funds spread exposure across continents. This interconnectedness allows for diversification but also means that systemic risks can propagate quickly.
5. Market Sentiment and Investor Psychology
Investor psychology significantly impacts global markets. Fear, uncertainty, and speculation can lead to sudden sell-offs or bubbles. Market sentiment often amplifies the effect of fundamental events. For instance, even minor geopolitical news can trigger sharp declines if investors perceive risk, while positive economic announcements can fuel rallies. Behavioral finance highlights that emotions, herd behavior, and perception of risk often override rational decision-making, causing markets to react disproportionately.
Media coverage, social networks, and financial news outlets shape market sentiment globally. The instantaneous spread of information allows sentiment to influence international markets simultaneously, creating synchronized movements across regions.
6. Emerging Markets and Their Vulnerability
Emerging markets are particularly vulnerable to global market fluctuations. These economies often rely on exports, foreign investments, and commodity revenues. Changes in global demand, interest rates in developed nations, or capital outflows can destabilize emerging markets’ currencies, stock exchanges, and debt markets. While emerging markets offer high growth potential, they are highly sensitive to global volatility, highlighting the asymmetric impact of global market shocks.
7. The Role of Commodities and Energy Markets
Commodities—oil, metals, agricultural products—are highly sensitive to global market trends. Price fluctuations in these markets affect inflation, corporate costs, and trade balances. Energy markets, particularly oil and gas, are closely tied to geopolitical developments. A disruption in supply due to political conflicts or natural disasters can lead to global price spikes, affecting industries and consumers worldwide. Similarly, agricultural market disruptions can lead to food inflation and social unrest in dependent regions.
8. Strategies for Navigating Global Market Uncertainty
Investors, corporations, and governments employ several strategies to mitigate the impact of market fluctuations. Diversification across regions, sectors, and asset classes reduces exposure to localized shocks. Hedging through derivatives, such as options and futures, allows market participants to manage risk. Central banks and regulatory authorities also intervene with policies to stabilize financial systems during crises.
For businesses, understanding global supply chains, geopolitical risks, and currency exposure is critical. Long-term planning involves scenario analysis, stress testing, and adapting business models to changing global dynamics. Individual investors increasingly focus on sustainable and resilient investments, considering environmental, social, and governance (ESG) factors, which have shown relative stability during turbulent periods.
Conclusion
Global markets are inherently interconnected and influenced by a broad spectrum of economic, political, technological, and environmental factors. Their behavior reflects both tangible indicators, like GDP growth or commodity prices, and intangible forces, such as investor sentiment and geopolitical uncertainty. Understanding these influences is essential for investors, policymakers, and businesses to navigate risks and capitalize on opportunities.
The impact of global market fluctuations extends far beyond stock prices—it affects employment, production, trade, and the overall well-being of societies. As markets become increasingly complex and technology-driven, participants must remain vigilant, adaptable, and informed. Awareness of the intricate forces shaping global markets enables smarter decisions, resilience in the face of volatility, and a proactive approach to both challenges and opportunities in the world economy.

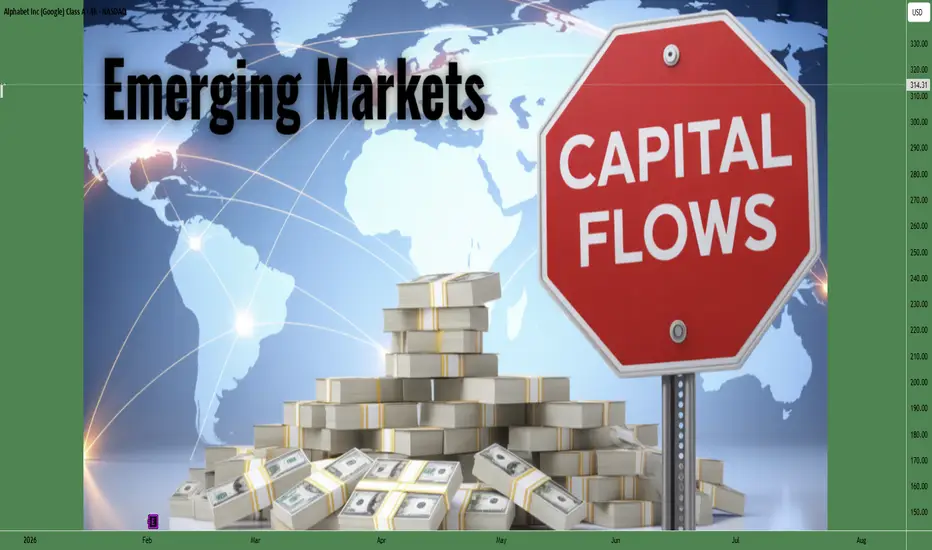
Emerging Markets and Capital FlowsDynamics, Drivers, Risks, and Global Impact
Introduction
Emerging markets (EMs) play a critical role in the global economy, contributing a growing share of world GDP, trade, and financial market activity. Countries such as India, China, Brazil, Indonesia, South Africa, and Mexico are no longer peripheral economies; they are central to global growth and investment strategies. One of the most important forces shaping emerging markets is capital flows—the movement of money across borders for investment, trade, and financial purposes. Capital flows can accelerate growth, deepen financial markets, and improve productivity, but they can also create instability, currency volatility, and financial crises if not managed properly. Understanding the interaction between emerging markets and capital flows is essential for policymakers, investors, and traders.
Understanding Emerging Markets
Emerging markets are economies that are transitioning from low-income, underdeveloped systems toward more industrialized and market-oriented structures. These countries typically exhibit rapid economic growth, expanding middle classes, improving infrastructure, and increasing integration with global trade and finance. However, they also face challenges such as weaker institutions, higher political risk, limited financial depth, and vulnerability to external shocks.
Financial markets in emerging economies—equity markets, bond markets, and currency markets—are often less mature than those in developed economies. This makes them both attractive and risky for global investors. Higher growth potential and yields draw foreign capital, while structural weaknesses increase sensitivity to changes in global financial conditions.
What Are Capital Flows?
Capital flows refer to cross-border movements of financial capital and are broadly categorized into:
Foreign Direct Investment (FDI) – Long-term investments in productive assets such as factories, infrastructure, or businesses.
Portfolio Investment – Investments in stocks, bonds, and other financial securities.
Debt Flows – Loans from foreign banks, multilateral institutions, or sovereign bond issuance.
Other Flows – Including remittances, trade credit, and short-term banking flows.
Each type of capital flow has different implications for economic stability. FDI is generally stable and growth-enhancing, while portfolio and short-term debt flows tend to be more volatile.
Drivers of Capital Flows to Emerging Markets
Global Factors (Push Factors)
Global conditions often determine the direction and scale of capital flows into emerging markets. Key push factors include:
Interest rates in developed economies: Low interest rates in the US, Europe, or Japan push investors toward higher-yielding emerging market assets.
Global liquidity: Expansionary monetary policies increase excess capital seeking returns.
Risk appetite: Periods of global optimism encourage risk-taking and investment in EMs.
Domestic Factors (Pull Factors)
Country-specific fundamentals also influence capital inflows:
Strong GDP growth
Stable inflation
Fiscal discipline
Political stability
Structural reforms
Sound monetary policy
Emerging markets that demonstrate credible institutions and reform momentum attract more stable capital.
Benefits of Capital Flows to Emerging Markets
Capital inflows can be a powerful engine for development when managed well.
Economic Growth and Investment
Foreign capital supplements domestic savings, allowing higher investment in infrastructure, manufacturing, technology, and services. FDI brings not only money but also technology, managerial expertise, and access to global markets.
Financial Market Development
Capital inflows deepen equity and bond markets, improve liquidity, and enhance price discovery. This helps domestic firms raise capital more efficiently and promotes financial inclusion.
Currency Stability and Reserves
Sustained inflows strengthen foreign exchange reserves and support currency stability, improving a country’s ability to withstand external shocks.
Risks and Challenges of Capital Flows
Despite their benefits, capital flows also pose significant risks to emerging markets.
Volatility and Sudden Stops
Portfolio flows can reverse quickly during periods of global stress, leading to capital flight. Sudden stops in inflows or abrupt outflows can cause sharp currency depreciation, stock market crashes, and banking stress.
Exchange Rate Pressure
Large inflows can cause currency appreciation, reducing export competitiveness. Conversely, sudden outflows can trigger steep depreciation, increasing inflation and external debt burdens.
Asset Price Bubbles
Excess liquidity may inflate asset prices in equity, real estate, or bond markets, increasing systemic risk. When bubbles burst, financial stability is threatened.
External Debt Vulnerability
Heavy reliance on foreign borrowing—especially in foreign currency—can expose economies to refinancing and currency risks during global tightening cycles.
Role of Global Monetary Policy
Global monetary policy, especially that of the US Federal Reserve, plays a dominant role in shaping capital flows to emerging markets. Periods of quantitative easing and low interest rates tend to boost inflows, while rate hikes and liquidity tightening often lead to outflows.
This dynamic creates a pro-cyclical pattern where emerging markets receive capital during booms and lose it during downturns, even if domestic fundamentals remain sound. This dependency reduces monetary policy autonomy and complicates macroeconomic management.
Policy Responses by Emerging Markets
To manage capital flow volatility, emerging markets adopt a mix of policy tools:
Monetary and Exchange Rate Policy
Flexible exchange rates act as shock absorbers, while foreign exchange intervention helps smooth excessive volatility.
Macroprudential Measures
Capital buffers, loan-to-value limits, and stress testing help protect financial systems from excessive leverage and speculative flows.
Capital Flow Management
Some countries use temporary capital controls or taxes on short-term flows to reduce speculative inflows and stabilize markets.
Strengthening Fundamentals
Improving governance, fiscal discipline, financial regulation, and institutional credibility attracts long-term, stable capital.
Emerging Markets, Capital Flows, and Investors
For global investors and traders, emerging markets offer diversification and higher returns but require careful risk assessment. Currency risk, geopolitical developments, policy credibility, and global macro trends must be monitored closely.
In recent years, the rise of passive investment, index inclusion, and algorithmic trading has increased the speed and synchronization of capital flows, amplifying market movements in emerging economies.
Conclusion
Emerging markets and capital flows are deeply interconnected in today’s globalized financial system. Capital inflows can accelerate growth, modernize economies, and deepen financial markets, but they also introduce volatility and external vulnerability. The challenge for emerging economies lies in attracting stable, long-term capital while minimizing the risks associated with speculative and short-term flows.
Effective policy frameworks, strong institutions, and prudent macroeconomic management are essential for harnessing the benefits of capital flows. As emerging markets continue to grow in global importance, their ability to manage capital flows will remain a key determinant of economic stability, investor confidence, and long-term development.
Global Trade Imbalance: Causes and ConsequencesGlobal trade imbalance refers to a persistent difference between a country’s exports and imports when trading with the rest of the world. When a nation consistently exports more than it imports, it runs a trade surplus; when it imports more than it exports, it runs a trade deficit. While short-term imbalances are a normal part of international trade, long-lasting and large imbalances can shape global economic stability, influence currency movements, affect employment, and even create geopolitical tensions. In today’s interconnected world, understanding global trade imbalance is crucial for policymakers, investors, businesses, and traders.
Understanding the Concept of Trade Imbalance
At its core, a trade imbalance reflects differences in economic structure, productivity, consumption patterns, and savings behavior among countries. Developing economies often run trade deficits as they import capital goods and technology to support growth, while export-oriented economies may generate surpluses by focusing on manufacturing and external demand. Trade imbalances are recorded in a country’s current account, which also includes services, income flows, and transfers, but goods trade usually dominates the discussion.
Trade imbalances are not inherently negative. For example, the United States has run trade deficits for decades while maintaining strong economic growth and attracting global capital. However, when imbalances become excessive or politically sensitive, they can trigger policy responses such as tariffs, currency interventions, or trade agreements.
Major Causes of Global Trade Imbalance
One of the most important drivers of global trade imbalance is differences in savings and investment rates. Countries with high domestic savings and relatively lower consumption—such as China, Germany, and Japan—tend to export more than they import, creating trade surpluses. In contrast, countries with high consumption and lower savings—such as the United States—often rely on imports, resulting in trade deficits.
Exchange rate policies also play a critical role. A weaker currency makes exports cheaper and imports more expensive, supporting trade surpluses. Some countries have historically managed or intervened in their currencies to maintain export competitiveness. Conversely, strong currencies can make exports less competitive, widening trade deficits.
Another key factor is economic structure and competitiveness. Countries specializing in high-value manufacturing, technology, or capital goods often dominate global exports. Meanwhile, economies dependent on commodity imports or consumer goods may experience persistent deficits. Labor costs, productivity levels, infrastructure quality, and innovation capacity all influence trade performance.
Globalization and supply chains have further contributed to trade imbalances. Multinational companies often locate production where costs are lowest, exporting finished goods to consumer markets. As a result, manufacturing hubs accumulate trade surpluses, while consumption-driven economies absorb deficits.
Role of Capital Flows and Financial Markets
Trade imbalances are closely linked to capital flows. A country running a trade deficit must attract foreign capital to finance it, usually through foreign direct investment (FDI), portfolio investment, or borrowing. For example, the U.S. trade deficit is matched by strong inflows into U.S. Treasury bonds, equities, and real estate. This relationship shows that trade deficits are not just about goods, but also about confidence in an economy’s financial markets.
However, reliance on foreign capital can increase vulnerability. Sudden reversals of capital flows may lead to currency depreciation, higher interest rates, and financial instability, especially in emerging markets.
Economic and Social Consequences
Persistent global trade imbalances can have wide-ranging effects. In surplus countries, heavy dependence on exports can make growth vulnerable to external demand shocks. A slowdown in global trade or protectionist policies can quickly hurt employment and industrial output.
In deficit countries, large trade gaps may contribute to industrial decline and job losses in manufacturing sectors. This has been a major political issue in several advanced economies, fueling debates about globalization, outsourcing, and fair trade. Rising income inequality and regional economic disparities are often linked to long-term trade deficits.
Trade imbalances also influence currency markets. Deficit countries may experience downward pressure on their currencies over time, while surplus countries may face appreciation pressure. These movements affect inflation, interest rates, and central bank policies, directly impacting global financial markets.
Trade Imbalances and Geopolitics
Global trade imbalance is not just an economic issue; it is also deeply political. Large imbalances between major economies have led to trade disputes, sanctions, and tariff wars. Governments may accuse trading partners of unfair practices such as subsidies, dumping, or currency manipulation.
Such tensions can disrupt global supply chains, reduce investor confidence, and slow global growth. International institutions like the World Trade Organization (WTO), International Monetary Fund (IMF), and G20 often emphasize the need to reduce excessive imbalances through structural reforms rather than protectionism.
Impact on Emerging and Developing Economies
For emerging markets, trade imbalances present both opportunities and risks. Export-led growth strategies have helped many countries industrialize and reduce poverty. However, over-reliance on exports—especially commodities—can expose economies to volatile global prices and demand cycles.
Trade deficits in developing countries can be manageable if they finance productive investments, such as infrastructure and technology. Problems arise when deficits fund consumption instead of growth, increasing external debt and financial fragility.
Addressing Global Trade Imbalance
Reducing global trade imbalance requires coordinated policy efforts. Surplus countries can encourage domestic consumption, raise wages, and invest more at home. Deficit countries can boost savings, improve productivity, and enhance export competitiveness through innovation and skill development.
Exchange rate flexibility is also crucial. Allowing currencies to reflect economic fundamentals can help correct imbalances over time. Structural reforms, such as improving ease of doing business, strengthening infrastructure, and upgrading manufacturing capabilities, play a long-term role.
At the global level, cooperation is essential. Protectionist measures may reduce deficits temporarily but often lead to retaliation and higher costs. Sustainable solutions focus on balanced growth, open markets, and fair competition.
Conclusion
Global trade imbalance is a complex and multifaceted phenomenon shaped by economic structures, financial flows, currency policies, and global supply chains. While trade surpluses and deficits are natural outcomes of international trade, persistent and large imbalances can create economic vulnerabilities and political tensions. In an increasingly interconnected world, addressing global trade imbalance requires thoughtful domestic reforms and strong international cooperation. Rather than viewing imbalances as purely negative, policymakers and market participants must understand their underlying causes and manage them in a way that supports stable, inclusive, and sustainable global growth.

GOOGL low resistance liquidity run to ATHI think this GOOGL 24 hour chart has a great set up to take us back to All-time high.
We got the formation of a bullish fair value gap today.
We have relative highs sitting at 321.31.
Most definitely a low resistance run on liquidity at 332.98.
There was a gap on the weekly timeframe that got filled, and we got a bounce out of it two weeks in a row, and this would be the third week of a bounce .
The only thing that could disrupt this move up, is that there is a bearish weekly Fair value gap that needs to get broken through.
We clear that and it could be smooth sailing.

Google Wave Analysis – 22 December 2025
- Google reversed from key support level 290.00
- Likely to rise to resistance level 320.00
Google recently reversed from the key support level 290.00 (former strong resistance from October and November) intersecting with the lower daily Bollinger Band and the 38.25 Fibonacci correction of the upward impulse 1 from October.
The upward reversal from the support level 290.00 started the active impulse wave i of the higher impulse waves 3 and (C).
Given the strong daily uptrend, Google can be expected to rise to the next resistance level 320.00 (target for the completion of the active impulse wave i).

GOOGLE; Will we see continuation?📈 Hey Traders!
Here’s a fresh outlook from my trading desk. If you’ve been following me for a while, you already know my approach:
🧩 I trade Supply & Demand zones using Heikin Ashi chart on the 4H timeframe.
🧠 I keep it mechanical and clean — no messy charts, no guessing games.
❌ No trendlines, no fixed sessions, no patterns, no indicator overload.
❌ No overanalyzing the market; use only two time frames.
❌ No scalping, and no need to be glued to the screen.
✅ I trade exclusively with limit orders, so it’s more of a set-and-forget style.
✅ This means more freedom, less screen time, and a focus on quality setups.
✅ Just a simplified, structured plan and a calm mindset.
💬 Let’s Talk:
💡Do you trade supply & demand too ?
💡What’s your go-to timeframe ?
💡Ever tried Heikin Ashi ?
📩 Got questions about my strategy or setup? Drop them below — ask me anything, I’m here to share.
Let’s grow together and keep it simple. 👊

GOOG - From Erections Come CorrectionsAnytime you get an erection, move like this on a chart, rest assured, a correction is right around the corner.
Buffet's purchase of 1% of his cash holdings does not justify hundreds of billions in market capitalization gains.
GOOG has now exploded 53% since Sept. if you were long. GREAT! Take your profits and run! If you are chasing, you will ultimately get burned.
Remember, no matter where the price goes, you are always 100% from ZERO!
I will be the first to tell you that the most & easiest profits are always made at the tops of markets. When everyone and their grandmother is bullish! Therein is the problem! TOP!
GTFO and STFO!
THANK YOU for getting me to 5,000 followers! 🙏🔥
Let’s keep climbing.
If you enjoy the work:
👉 Boost
👉 Follow
👉 Drop a solid comment
Let’s push it to 6,000 and keep building a community grounded in truth, not hype.

Alphabet (GOOG): Critical Support 295-298Alphabet (GOOG): Critical Support 295-298
Bearish divergence has been signaling a warning for a while.
The price is currently testing the uptrend line; a breakdown here would trigger a correction mode.
Conversely, if the price bounces and clears the 300 mark, the bullish case remains intact for a potential new high.
Updated: Dec 18, 2025

I bought GOOGLEWell, bought Google... I waited for a correction to buy... Personally, I don't think we're in a bubble and I believe we'll continue to rise and reach new historic highs.
I think Google is an incredible company and is doing everything right: increasing users, accounting for 90% of internet searches, and its artificial intelligence is incredible (beating ChatGPT again).
They are investing in data centers and AI, and they focus too much attention on their existing customers.
I am very bullish on this company and continue to be so...
