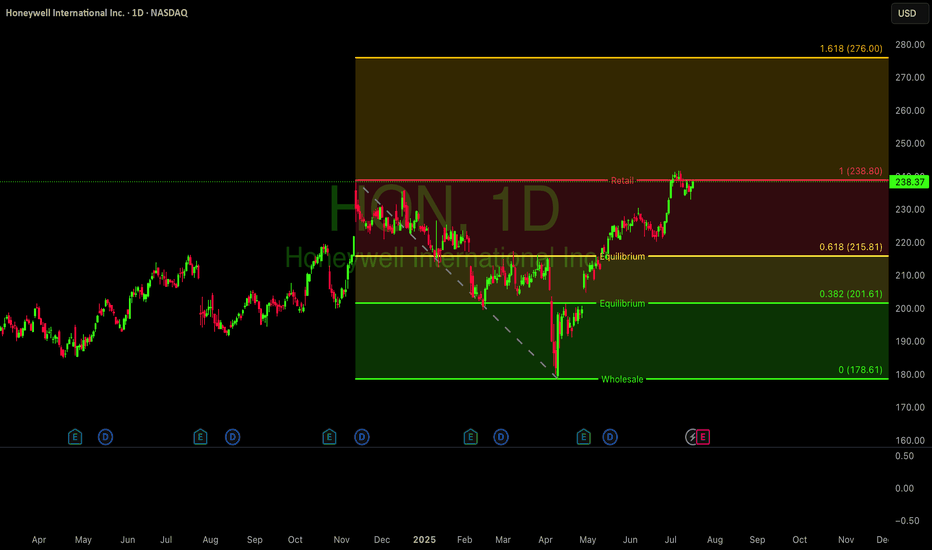
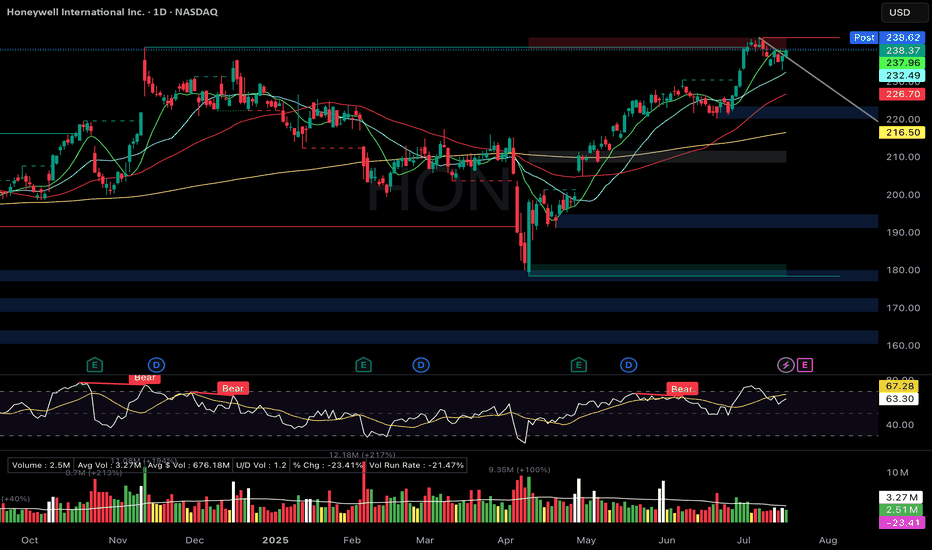
The 3-Step Rocket Booster Strategy + Evening Star Candlestick The number #1 candlestick pattern is the evening star ✴️.
This is the pattern you are looking at on on this screen.
Its a very strong pattern, now notice how the top of this price action looks?
You see when the "dead cross" happened everyone started short selling.
Then pop bomb 💣 to the top.
Af
Next report date
—
Report period
—
EPS estimate
—
Revenue estimate
—
9.55 USD
5.71 B USD
38.50 B USD
634.05 M
About Honeywell International Inc.
Sector
Industry
CEO
Vimal M. Kapur
Website
Headquarters
Charlotte
Founded
1906
ISIN
US4385161066
FIGI
BBG000H556T9
Honeywell International, Inc. is a software industrial company, which offers industry specific solutions to aerospace and automotive products and services. It operates through the following business segments: Aerospace Technologies, Industrial Automation, Building Automation, Energy and Sustainability Solutions, and Corporate and All Other. The company was founded by Albert M. Butz in 1906 and is headquartered in Charlotte, NC.
Related stocks
Honeywell: Upward?The previously defined Target Zone was clearly breached to the upside, so we have now deactivated and grayed out that zone. The stock is currently in a downward move, which we interpret as a corrective pullback within green wave . We expect this move to conclude above the resistance level at $250.2
Honeywell: From Waste to FuelBy Ion Jauregui – Analyst at ActivTrades
Honeywell International Inc. (NASDAQ: HON) has unveiled a technology that could redefine the use of agricultural and forestry waste. The U.S.-based company has developed a process capable of converting these residues into biocrude, a low-emission marine fuel
the WY of Honeywell's Earnings Report Gap up and Run down It is very important that you understand what is happening in a company that impacts its stock price. HON has had Dark Pool Rotation going on since July of this year. Dark Pools are the most informed of all the Market Participant groups (there are 12 not 2).
The chart of HON has plenty of informatio
$HON Honey are you well NASDAQ:HON looking strong. Weekly chart is in a clear Stage 2 uptrend, now consolidating near all-time highs.
The 4-hour chart is holding key support around the $230-$233 level, with the Stochastic oscillator turning up from oversold territory. A decisive break above the $240 resistance could sign
HON Bull flag + hammer off 21EMAHON – Honeywell
Setup Grade: A
• Entry: $238.12 (7/17)
• Status: Active
• Trailing Stop: $6.85 (2x ATR)
• Setup: Aerospace/defense leader. Bull flag + hammer off 21EMA. RSI ~63.
• Target: $256 (measured move). ATH = $242.77
• Plan: Hold through breakout → blue sky setup.
• Earnings: July 24
Honeywell: Quantum Leap or Geopolitical Gambit?Honeywell is strategically positioning itself for significant future growth by aligning its portfolio with critical megatrends, notably aviation's future and quantum computing's burgeoning field. The company demonstrates remarkable resilience and foresight, actively pursuing partnerships and investm
See all ideas
Summarizing what the indicators are suggesting.
Neutral
SellBuy
Strong sellStrong buy
Strong sellSellNeutralBuyStrong buy
Neutral
SellBuy
Strong sellStrong buy
Strong sellSellNeutralBuyStrong buy
Neutral
SellBuy
Strong sellStrong buy
Strong sellSellNeutralBuyStrong buy
An aggregate view of professional's ratings.
Neutral
SellBuy
Strong sellStrong buy
Strong sellSellNeutralBuyStrong buy
Neutral
SellBuy
Strong sellStrong buy
Strong sellSellNeutralBuyStrong buy
Neutral
SellBuy
Strong sellStrong buy
Strong sellSellNeutralBuyStrong buy
Displays a symbol's price movements over previous years to identify recurring trends.
HON5761704
Honeywell International Inc. 5.35% 01-MAR-2064Yield to maturity
5.67%
Maturity date
Mar 1, 2064
HON5761703
Honeywell International Inc. 5.25% 01-MAR-2054Yield to maturity
5.57%
Maturity date
Mar 1, 2054
HON4583289
Honeywell International Inc. 3.812% 21-NOV-2047Yield to maturity
5.44%
Maturity date
Nov 21, 2047
HON4988328
Honeywell International Inc. 2.8% 01-JUN-2050Yield to maturity
5.28%
Maturity date
Jun 1, 2050
HON.HH
Honeywell International Inc. 5.375% 01-MAR-2041Yield to maturity
5.06%
Maturity date
Mar 1, 2041
HON.GB
AlliedSignal, Inc. 9.065% 01-JUN-2033Yield to maturity
5.04%
Maturity date
Jun 1, 2033
HON.GY
Honeywell International Inc. 5.7% 15-MAR-2037Yield to maturity
4.99%
Maturity date
Mar 15, 2037
HON.GW
Honeywell International Inc. 5.7% 15-MAR-2036Yield to maturity
4.93%
Maturity date
Mar 15, 2036
HON5761178
Honeywell International Inc. 5.0% 01-MAR-2035Yield to maturity
4.78%
Maturity date
Mar 1, 2035
HON5587552
Honeywell International Inc. 4.5% 15-JAN-2034Yield to maturity
4.66%
Maturity date
Jan 15, 2034
HON5497118
Honeywell International Inc. 5.0% 15-FEB-2033Yield to maturity
4.55%
Maturity date
Feb 15, 2033
See all HON bonds
Curated watchlists where HON is featured.
Frequently Asked Questions
The current price of HON is 196.08 USD — it has decreased by −0.42% in the past 24 hours. Watch Honeywell International Inc. stock price performance more closely on the chart.
Depending on the exchange, the stock ticker may vary. For instance, on NASDAQ exchange Honeywell International Inc. stocks are traded under the ticker HON.
HON stock has risen by 1.53% compared to the previous week, the month change is a 1.19% rise, over the last year Honeywell International Inc. has showed a −9.12% decrease.
We've gathered analysts' opinions on Honeywell International Inc. future price: according to them, HON price has a max estimate of 271.00 USD and a min estimate of 205.39 USD. Watch HON chart and read a more detailed Honeywell International Inc. stock forecast: see what analysts think of Honeywell International Inc. and suggest that you do with its stocks.
HON stock is 2.25% volatile and has beta coefficient of 0.77. Track Honeywell International Inc. stock price on the chart and check out the list of the most volatile stocks — is Honeywell International Inc. there?
Today Honeywell International Inc. has the market capitalization of 126.37 B, it has increased by 2.99% over the last week.
Yes, you can track Honeywell International Inc. financials in yearly and quarterly reports right on TradingView.
Honeywell International Inc. is going to release the next earnings report on Jan 29, 2026. Keep track of upcoming events with our Earnings Calendar.
HON earnings for the last quarter are 2.66 USD per share, whereas the estimation was 2.44 USD resulting in a 8.82% surprise. The estimated earnings for the next quarter are 2.50 USD per share. See more details about Honeywell International Inc. earnings.
Honeywell International Inc. revenue for the last quarter amounts to 10.41 B USD, despite the estimated figure of 10.15 B USD. In the next quarter, revenue is expected to reach 10.21 B USD.
HON net income for the last quarter is 1.82 B USD, while the quarter before that showed 1.57 B USD of net income which accounts for 16.24% change. Track more Honeywell International Inc. financial stats to get the full picture.
Yes, HON dividends are paid quarterly. The last dividend per share was 1.19 USD. As of today, Dividend Yield (TTM)% is 2.27%. Tracking Honeywell International Inc. dividends might help you take more informed decisions.
Honeywell International Inc. dividend yield was 1.93% in 2024, and payout ratio reached 50.20%. The year before the numbers were 1.99% and 49.25% correspondingly. See high-dividend stocks and find more opportunities for your portfolio.
As of Nov 17, 2025, the company has 102 K employees. See our rating of the largest employees — is Honeywell International Inc. on this list?
EBITDA measures a company's operating performance, its growth signifies an improvement in the efficiency of a company. Honeywell International Inc. EBITDA is 9.82 B USD, and current EBITDA margin is 23.91%. See more stats in Honeywell International Inc. financial statements.
Like other stocks, HON shares are traded on stock exchanges, e.g. Nasdaq, Nyse, Euronext, and the easiest way to buy them is through an online stock broker. To do this, you need to open an account and follow a broker's procedures, then start trading. You can trade Honeywell International Inc. stock right from TradingView charts — choose your broker and connect to your account.
Investing in stocks requires a comprehensive research: you should carefully study all the available data, e.g. company's financials, related news, and its technical analysis. So Honeywell International Inc. technincal analysis shows the sell today, and its 1 week rating is sell. Since market conditions are prone to changes, it's worth looking a bit further into the future — according to the 1 month rating Honeywell International Inc. stock shows the sell signal. See more of Honeywell International Inc. technicals for a more comprehensive analysis.
If you're still not sure, try looking for inspiration in our curated watchlists.
If you're still not sure, try looking for inspiration in our curated watchlists.


