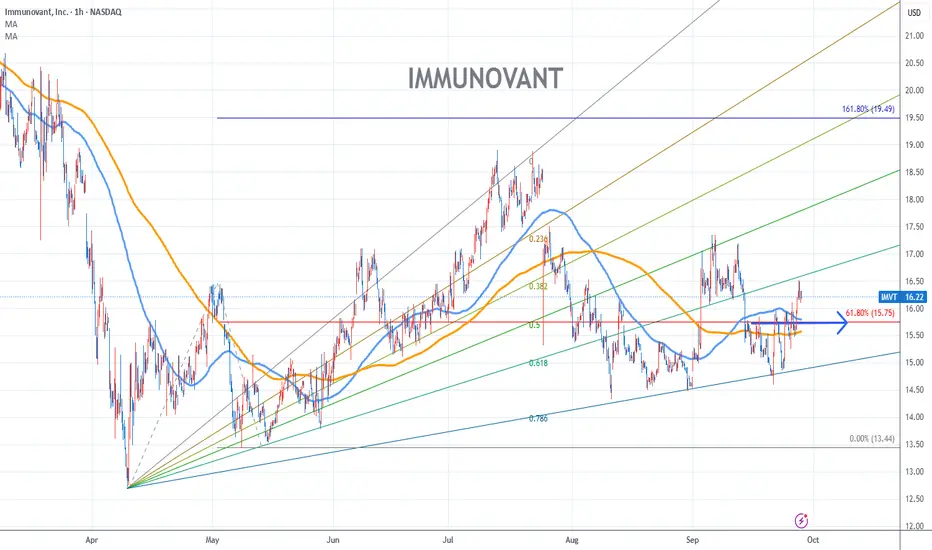
Immunovant Chart Fibonacci Analysis 092625Trading Idea
1) Find a FIBO slingshot
2) Check FIBO 61.80% level
3) Entry Point > 15.7/61.80%
Chart time frame:B
A) 15 min(1W-3M)
B) 1 hr(3M-6M)
C) 4 hr(6M-1year)
D) 1 day(1-3years)
Stock progress:A
A) Keep rising over 61.80% resistance
B) 61.80% resistance
C) 61.80% support
D) Hit the bottom
E) Hit the top
Stocks rise as they rise from support and fall from resistance. Our goal is to find a low support point and enter. It can be referred to as buying at the pullback point. The pullback point can be found with a Fibonacci extension of 61.80%. This is a step to find an entry-level position. 1) Find a triangle (Fibonacci Speed Fan Line) that connects the high (resistance) and low (support) points of the stock in progress, where it is continuously expressed as a Slingshot, 2) and create a Fibonacci extension level for the first rising wave from the start point of the slingshot pattern.
When the current price goes over the 61.80% level, that can be a good entry point, especially if the SMA 100 and 200 curves are gathered together at 61.80%, it is a very good entry point.
As a great help, TradingView provides these Fibonacci speed fan lines and extension levels with ease. So if you use the Fibonacci fan line, the extension level, and the SMA 100/200 curve well, you can find an entry point for the stock market. At least you have to enter at this low point to avoid trading failure, and if you are skilled at entering this low point, with the fibonacci6180 technique, your reading skill of to chart will be greatly improved.
If you want to do day trading, please set the time frame to 5 minutes or 15 minutes, and you will see many of the low points of rising stocks.
If you prefer long-term range trading, you can set the time frame to 1 hr or 1 day
Market insights
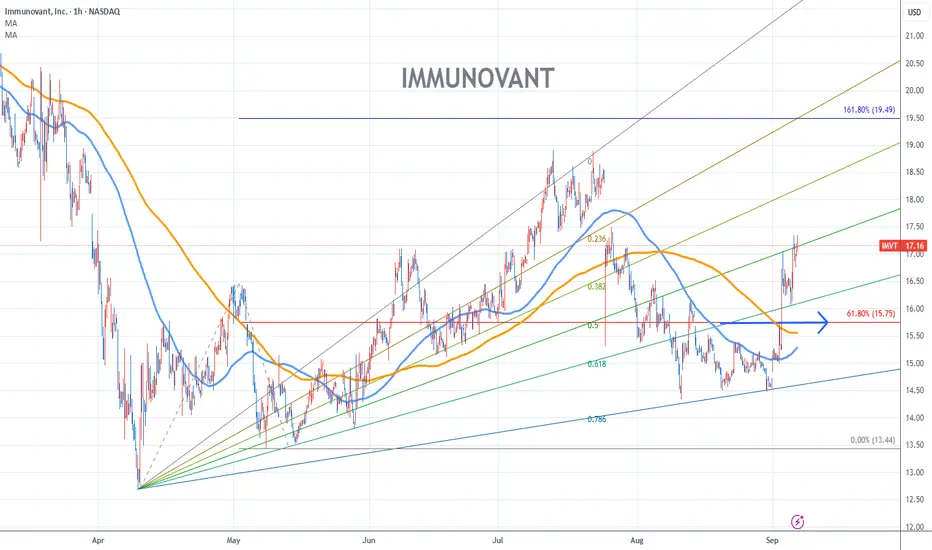
Immunovant Stock Chart Fibonacci Analysis 090625Trading Idea
1) Find a FIBO slingshot
2) Check FIBO 61.80% level
3) Entry Point > 16/61.80%
Chart time frame:C
A) 15 min(1W-3M)
B) 1 hr(3M-6M)
C) 4 hr(6M-1year)
D) 1 day(1-3years)
Stock progress:A
A) Keep rising over 61.80% resistance
B) 61.80% resistance
C) 61.80% support
D) Hit the bottom
E) Hit the top
Stocks rise as they rise from support and fall from resistance. Our goal is to find a low support point and enter. It can be referred to as buying at the pullback point. The pullback point can be found with a Fibonacci extension of 61.80%. This is a step to find an entry-level position. 1) Find a triangle (Fibonacci Speed Fan Line) that connects the high (resistance) and low (support) points of the stock in progress, where it is continuously expressed as a Slingshot, 2) and create a Fibonacci extension level for the first rising wave from the start point of the slingshot pattern.
When the current price goes over the 61.80% level, that can be a good entry point, especially if the SMA 100 and 200 curves are gathered together at 61.80%, it is a very good entry point.
As a great help, TradingView provides these Fibonacci speed fan lines and extension levels with ease. So if you use the Fibonacci fan line, the extension level, and the SMA 100/200 curve well, you can find an entry point for the stock market. At least you have to enter at this low point to avoid trading failure, and if you are skilled at entering this low point, with the fibonacci6180 technique, your reading skill of to chart will be greatly improved.
If you want to do day trading, please set the time frame to 5 minutes or 15 minutes, and you will see many of the low points of rising stocks.
If you prefer long-term range trading, you can set the time frame to 1 hr or 1 day
IMVT - Near all time highs with clear skies above
15% off all time highs.
A Minervini VCP looking setup.
4 month base setting higher highs and higher lows with price contraction into its breakout point. Expecting this to go next week or the week after.

✨ NEW: IMVT (6D) ✨ Shout Out to Casey_Louis for this one! ✨ TP3 @ 43.60
TP2 @ 34.40
TP1 28.45
BLO1 @ 19.85 (aggressive)
BLO2 @ 5.66 (conservative)

IMVT: VCP Pattern / PowerPlaySetup: PowerPlay
VCP: 3W 29/7 3T
RS: 99
The posted chart contains a VCP (volatility contraction pattern). The first label "W" stands for weekly and shows the duration of the entire consolidation. In the middle label, the percentage of contractions is indicated (for example, "15/4"), with 15 representing the -15% depth of the base and 4 representing -4% of the last contraction. The last part "T" represents the number of contractions. The light blue lines in the chart correspond to the contractions. A more detailed description can be found in Mark Minervini's books.
RS stands for relative strength and measures the strength of the stock compared to the overall market. The value range is 1-99 with 99 being the highest value. The rank was generated by fyntrade.

IMVT with a big breakout today!IMVT broke out of its trading channel on a big upgrade from Wells Fargo. Normally I could care less about upgrades but nice when it happens to your favorite stock.

🟩 $IMVT - Added yesterdayThis is a Power Play (High tight flag) setup.
We had advancement of +150% and Correction of -15%
Relative Strength is outperforming the market
Volume is mostly bullish
Bought on 28OCT and added on 31OCT
Formed a Cup and Handle Base on top of the Power Play

IMVT - Flag formation long setup IMVT- Break of 9.76, Stop signal 8.43, Target 1 12.43, Target 2 13.93 - Insider buying in October and late September from 3 insiders, small %'s though but reasonable $'s

IMVT Immunovant Price TragetsOn 8/13/2021 Chardan Capital brokerage Lowered the Price Target for the Buy rating from $55.00 to $22.00
On 8/10/2021 HC Wainwright brokerage Reiterated Rating to Buy and a Price Target of $19.00
My price target is the strong 14.5usd resistance.
Short Float 12.76%
52 Week Range 6.68 - 53.75
Now the price is 8.95usd

IMVT Target Price $10Target price $10, after hitting a 52 week low, IMVT is looking good for a bounce.

Immunovant Inc🧙 Immunovant Inc is a clinical-stage biopharmaceutical company. It is focused on enabling normal lives for patients with autoimmune diseases. The company's product includes IMVT-1401 targets the neonatal Fc receptor (FcRn).
If you want not to miss ideas like this one,🎯 subscribe and press a thumb up! 👍 Have a question? Don't be shy to ask! 🤓 Interested to study how to analyze charts, follow me!

Doubled Position $IMVT New Target 26.48 for 52.18% $IMVT Target 26.48 for 52.18%
Or next add level is at 8.32
I LOVE a good earnings over-reaction. I doubles my position at 11.87... new target set...
—
On the far right of the chart is my Average (Grey) Current Target (Green), and Next Level to add (Red) Percentage to target is from my average.
I start every position with 1% of my account and build from there as needed and as possible.
I am not your financial advisor. Watch my setups first before you jump in… My trade set ups work very well and they are for my personal reference and if you decide to trade them you do so at your own risk. I will gladly answer questions to the best of my knowledge but ultimately the risk is on you. I will update targets as needed.
GL and happy trading.

IMVT is a long swing trade opportunityImmunovant Inc offers at least 75% upside in the $16 range as of March 24, 2021.
Weaknesses
Stumble in most recent trial for treatment of autoimmune disorder Thyroid Eye Disease (Graves' Ophthalmopathy)
General and administrative expenses nearly doubled from $6.10M to $10.50M from Q42019 to Q42020*
Net loss of $79.30M for the 9 months ending December 21, 2020, which has nearly doubled compared to the same period in 2019*
Obviously fails the "ok boomer" test (see above) and does not pay a dividend
Strengths
Thyroid Eye Disease affects approximately 16 out of every 100K women yearly in North America and Europe, meaning nearly 27K new cases per year in the US alone
Research & Development spend increased by 4X from $5.00M to $21.10M in Q42019 to Q42020 as they expand manufacturing to support clinical trials*
Price tumbled almost 45% when Credit Suisse downgraded their IMVT rating from "outperform" to "neutral" and cutting their price target down from $49 to $31 on February 2, 2021
Price hammering continued through the February sell-off to vastly undervalued <$20 range
*All financials sourced from Immunovant's December 31, 2020 results published February 16, 2021.
TipRank
10 Analysts covering Immunovant including the Credit Suisse Analyst who has further knocked the target price down to $28
Median price target is $38
Chart
Price fell far beneath the 200-Day SMA on February 2, 2021 as part of the paused trial
5-Day EMA crossed the 20-Day SMA up on March 15, 2021 and has found support in the $15-$16 range
RSI trending <40 since the cross described above
Summary
Even using the Credit Suisse target of $28, Immunovant Inc has 75% upside based on the current price in the $15-$16 range (and the median $38 price target offers even more potential). IMVT is a swing buy opportunity with conservative initial price target of $28.


IMVT Technical Analysis 🧙Immunovant Inc is a clinical-stage biopharmaceutical company. It is focused on enabling normal lives for patients with autoimmune diseases. The company's product includes IMVT-1401 targets the neonatal Fc receptor (FcRn).
If you understand the idea,🎯 press a thumb up! 👍 Have a question? Don't be shy to ask! 🤓 Interested to study how to analyze charts, follow me!

IMVTBased on my fundamental analysis I have set a $35-$40 price target for IMVT. After a steep drop IMVT appears to have found support around $23 which was also supported by very strong volume. With support established at 23, a strong intrinsic valuation, and RSI indicating it is now oversold I believe this could be the start of a new uptrend.

IMVT - Buy AlertBuy IMVT at 27.50
First Target 29.50
2nd Target 35
Some good news about new research etc
