lCID is about to pump like crazy. IM BUYING NOW.Huge fib level on the monthly that I pulled from a sneaky move in the past. Huge levels on the yearly chart (marked) that we will hopefully pump to. This is a retracement play, this stock is trash, but that doesnt mean we wont retrace to test untested levels.
Market insights


Lucid...End of fallen?Lucid yet falling stronger...but, i think will be a great 2026 at the last 2 trimest.. the company growing on IA new car abd afforables price...get in make strong buys between $10 and $8. And keep it until September to see how is going the company

$LCID short, bear flag and they did just cut production guidanceNASDAQ:LCID short, bear flag, should at least got to $10 in the coming weeks/months.
- They just cut production guidance
Lucid lowered 2025 production outlook to ~18,000 vehicles due to supply issues. That’s another reset lower.
- Revenue missed and losses are still huge
Q3 revenue $336.6M vs ~$379M est, and adjusted loss was worse than expected.
Gross margins are deeply negative (improving, but still ugly).
- Cash burn + dilution treadmill
They have liquidity (~$5.5B), but the business is not self-funding yet.
They already used a $1.1B convertible to refinance and support operations, showing ongoing capital needs.

LCID — WEEK 49 TREND REPORT (2D) | 12/03/2025LCID — WEEK 49 TREND REPORT | 12/03/2025
Ticker: NASDAQ:LCID
Timeframe: TWO DAY
This is a reactive structural classification of LCID based on the weekly chart as of this timestamp. Price conditions are evaluated as they stand — nothing here is predictive or forward-assumptive.
⸻
1) Current Trend Condition [ Numbers to Watch ]
Current Price @ 13.56$
• Trend Duration : +45 weeks (Bearish)
• Trend Reversal Level ( Bullish ): 18.35$
• Trend Reversal Level ( Bullish Confirmation ): 14.63$
⸻
2) Position Status :
Unstable (price below both structural layers)
⸻
3) Temperature :
Neutral Phase
⸻
4) Momentum :
Bearish
⸻
Author’s Note
This analysis is fully reactive, not predictive. Market conditions, trend structure, and behavior are classified as they appear in real time. The objective is to identify where directional shifts first occurred, where structural integrity remains intact, and where it would begin to weaken if key levels were breached.
Predictive analysis projects outcomes that do not exist yet. Without price confirmation, prediction is built on baseless assumptions. This framework avoids that entirely by responding only to verified structural changes and live conditions.
The levels shown simply identify where the current trend structure first shifted and where it would begin to lose integrity if breached. Recognizing these boundaries allows for clearer interpretation of market behavior without relying on forward guarantees, speculative projections, or unsupported assumptions.
⸻
Methodology Overview
This classification framework evaluates directional conditions using internal trend-interpretation logic that references price behavior relative to its structural layers. These relationships are used to identify when price movement aligns with the framework’s criteria for directional phases, transition points, or regime shifts. Visual elements or structural labels reflect these internal interpretations, rather than explicit trading signals or preset indicator crossovers. This framework is observational only and does not imply future outcomes.

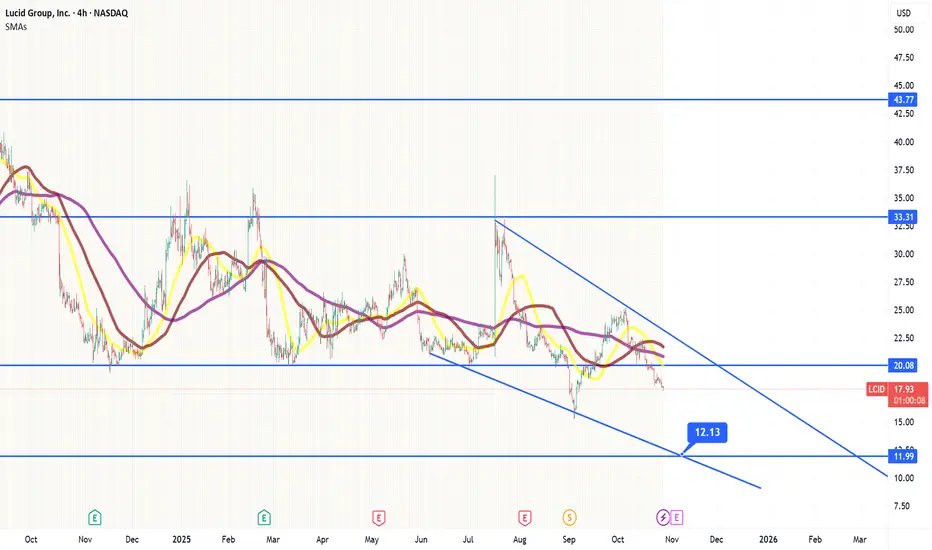
10? May be for December?It's clear its bearish. Most likely it will go down this December as well. Maybe I will buy it around 10 and DCA on it if it goes down further. I think in the next 6 months this could hit $24 based on technical analysis.
Happy trading and not a financial advice.

Lcid weekly chart
I know very well that no one will believe what I say, but I see that the LCID stock will target $90 in the long term. This is a fact that cannot be denied.
Good luck 4all

Lucid is going to pump to $10. Bottom in.My fibs and trend knowledge combined have me thinking lucid will pump to $10. Gpro and lucid are the meme stocks to watch. I know....

$LCID Gains as it Opens Gravity Touring Orders in CanadaLucid Group (NASDAQ: NASDAQ:LCID ) is trading at $12.20, up 4.14%, after announcing that Canadian customers can now order the Lucid Gravity Touring, its newest luxury electric SUV. Starting at $113,500 CAD, the Gravity Touring strengthens Lucid’s presence in the premium EV SUV space. Deliveries begin early next year, and buyers can configure the model in English or French through Lucid’s “Design Yours” platform.
Interim CEO Marc Winterhoff noted that the Gravity Touring expands Lucid’s reach into a critical market segment. Built on Lucid’s proprietary EV architecture, the model blends full-size SUV practicality with mid-size dimensions and seating for up to seven people. Its 89 kWh battery delivers an NRCan-estimated 542 km of range, supported by access to Tesla Superchargers, Electrify Canada, and 1000V DC fast-charging at up to 300 kW.
Lucid’s proprietary rear-motor boost enables 220 kW charging speeds on Tesla’s network—another competitive advantage as charging infrastructure becomes a key factor in EV adoption. Performance remains a highlight: dual-motor AWD with 560 hp, 0-100 km/h in 4.2 seconds, standard air suspension, and an optional Dynamic Handling Package.
The cabin supports flexible five- and seven-seat configurations, up to 3,400 L of cargo capacity, and multiple styling choices, including a Stealth or Platinum exterior appearance. These features position the Gravity Touring as a direct challenger to Tesla, Rivian, and premium European EV SUVs.
Technical Outlook (NASDAQ: NASDAQ:LCID )
LCID remains in a bearish structure after falling from its $35 February high. Price has broken the critical $20 support and is now approaching the $10 zone, which acts as the next demand area. A bullish reversal requires reclaiming $15, while deeper weakness opens the path toward $8.

LCID squezzeI think LCID (Lucid) squezze will happen in the future, don't have timeline for it, but that gap on the charts needs to be filled. RISKY MOVE.
This is not an investment advice.
Thanks, A.I.

$12 after q3 resultsLucid is bleeding cash and not meeting goals. $12 after q3 seems reasonable.
Superior EV's don't matter when they cost you $200k per car.
I doubt Lcid is around in 5 years time.
Option Alert: $UBER OCT 31 2025 $94 Calls – 130% ROI Potential iEnter: NYSE:UBER OCT 31 2025 $94 CALLS
Buy in Price: $4.05 - $4.10
Take Profit: $9.31
Stop Bleeding: $3.56
ROI Potential: 130%
Exit Within: 308 Minutes

Bullish Trade Plan – LCIDBullish Trade Plan – LCID
The market has already cleared sell-side liquidity and shown a strong reaction from the lows, confirming bullish intent.
Structure: Price has shifted upward after taking liquidity below, signaling strength.
Bias: Until the market reaches buy-side liquidity, deeper downside movement is less likely.
Resistance Zone: There is only one notable resistance where price may create a short pullback. If the pullback fails to push lower, then no significant resistance remains above.
Outlook: The target remains on the buy-side liquidity, and the market is expected to continue its bullish move until that level is taken.

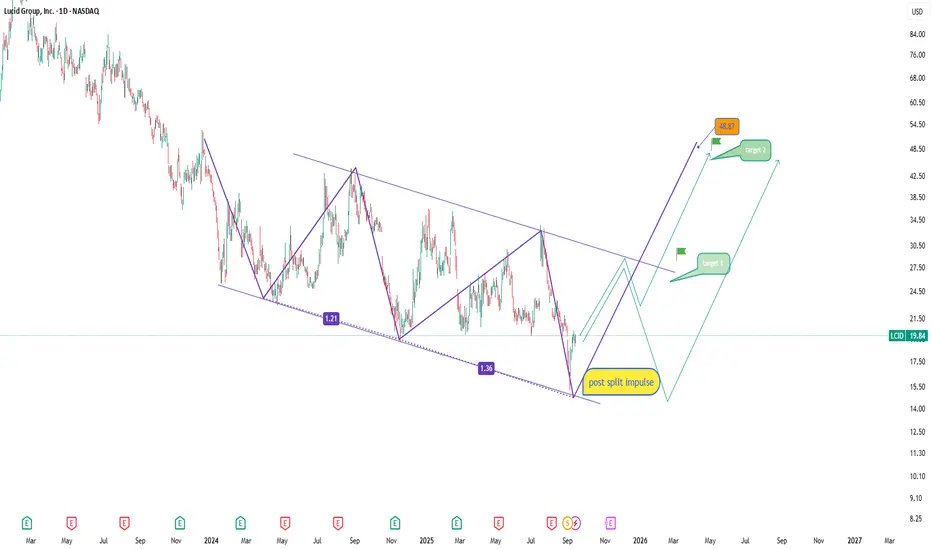
Lucid: post-split impulse and a chance for a new rangeLucid stock has absorbed the post-split selloff and is now showing signs of recovery. On the daily chart, price has moved out of the descending channel and consolidated above 19.50. The bullish scenario points to a first target at 27.00, where strong resistance is located. A breakout there could pave the way toward 48.00–49.00, marking a potential mid-term trend reversal.
EMAs are starting to turn upward, while volume is picking up, signaling increased buying interest. The key support lies in the 18.00–19.00 zone. As long as this area holds, the bullish case remains valid.
From a fundamental perspective, Lucid benefits from strong EV sector demand and continued backing from major investors in Saudi Arabia. Production challenges and high costs remain risks, but overall EV market growth provides optimism.
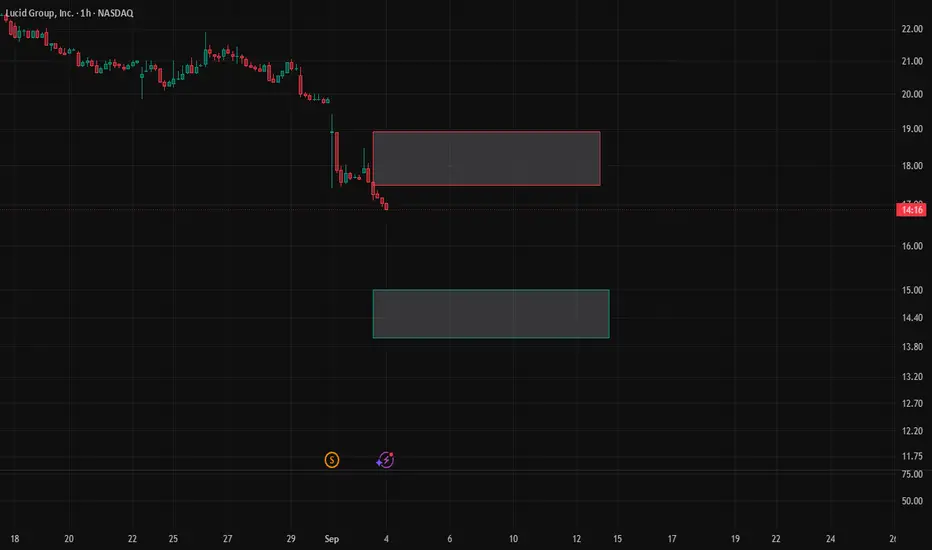
“Lucid’s Chart Isn’t Bearish – It’s Collapsing”1️⃣ Date & Time
Date: 3rd September 2025
Time: 12:45 AM IST
2️⃣ Fundamental News
Lucid executed a 1-for-10 reverse split on September 2nd.
Vehicle delivery guidance cut sharply → 18k–20k units vs initial lofty targets.
Analysts downgraded outlook; majority remain bearish.
⚡ Movement today aligns with structure, not news.
3️⃣ Public Sentiment & Human Behaviour
Retail Psychology: Panic exits after reverse split, many trapped at higher levels.
Institutional Strategy: No accumulation — every bounce used as exit liquidity.
Social Signal: Headlines spin the SUV launch as bullish, but real structure shows deep collapse.
4️⃣ Current Structure
Macro
Resistance: $20–22 → locked.
Support: $16 → $14 anchor.
Stage: Macro Collapse, no rescue gates open.
Micro
Resistance: $17.50–18.00.
Support: $16.20 → $15.80.
Behaviour: Controlled pullbacks, failed rescues, micro collapse intact.
5️⃣ Projection
Primary Path (70%): Drift toward $15.80–16.20, extension possible to $14.
Alternate Path (20%): Weak bounce to $18.00, rejection likely.
Low Path (10%): Rescue breakout above $20, only with strong institutional catalyst.
6️⃣ Pullback Levels
Shallow: $17.20
Medium: $18.00
Deep: $20.00 (unlikely rescue barrier)
7️⃣ Final View
Bias: Bearish.
Lucid remains in both Macro & Micro Collapse. Until $20+ is reclaimed with strength, downside path toward $15–$16 range dominates.
8️⃣ Essence
“Lucid’s chart is not in distress — it is in collapse. Every bounce is a distribution, every pullback an illusion. Path points only lower until a new structure is born.”
9️⃣ Disclaimer
⚠️ This analysis is shared for educational and research purposes only. It is not financial advice, trading advice, or an investment recommendation. Market decisions are entirely your own responsibility.
LUCID short interest high maybe is opportunity like GameStopLucid (LCID) is currently facing heavy selling pressure, but let’s be clear: this is not just normal selling. The stock has a short interest of around 29–30%, which is very high compared to most companies.
👉 Big funds betting against LCID include JPMorgan, Jane Street, Wolverine, Bank of America, and others. They are trying to profit from pushing the price lower.
But history has shown us a different story before — GameStop was also one of the most shorted stocks, and retail investors flipped the script by holding and buying gradually.
Yes, Lucid is going through a tough period right now (factories, expansion, high costs), but this is exactly the phase Tesla and BYD went through before success.
📈 I believe the real beginning of Lucid’s success will start around 2026–2028, as production scales and demand stabilizes.
💎🙌 The question is: do we let the shorts win, or do we hold and create another success story?
My view: This is a chance for gradual accumulation (buying in stages) at these levels.

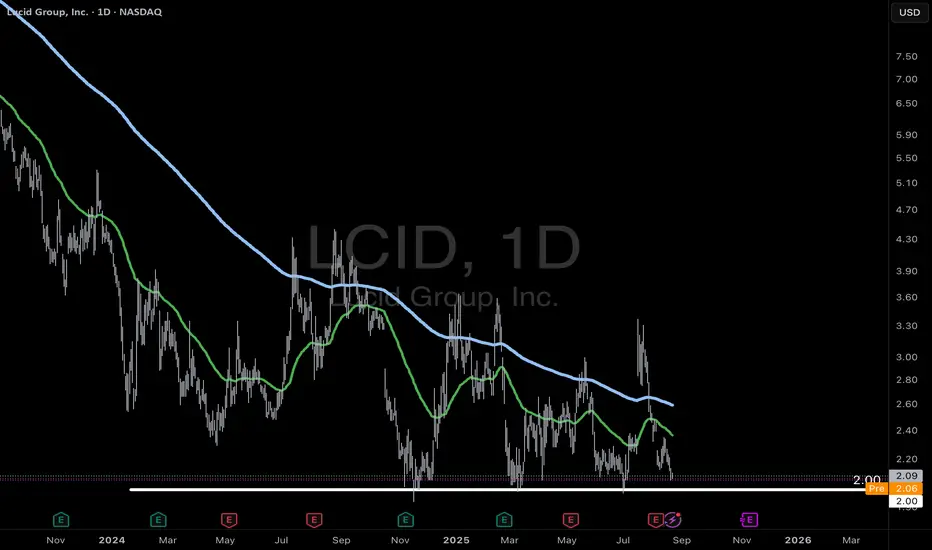
Lucid approaching the $2 support level?Will the $2 support level hold this time? Or will Lucid need to consider a reverse split to raise the stock price?
LCIDUSDT Ending Diagonal Near Strong DemandLucid Group continues its broader bearish move but now approaches a critical juncture with a well defined ending diagonal formation, often signaling trend exhaustion. Price action is nearing a historically strong demand zone, increasing the probability of a sharp reaction.
The trading plan is clear patiently accumulate within the projected buy zone as outlined on the chart, with focus on tracking price movement along the mapped reversal path. The setup presents a potential high reward-to-risk opportunity targeting the main sell-off resistance area, where major decisions will be reassessed.
Watch price closely as the ending diagonal matures. A strong bullish reaction could mark the start of a mid-term reversal phase.
📍 Drop your stock requests in the comments for quick technical updates only US stock assets will be analyzed under this post.

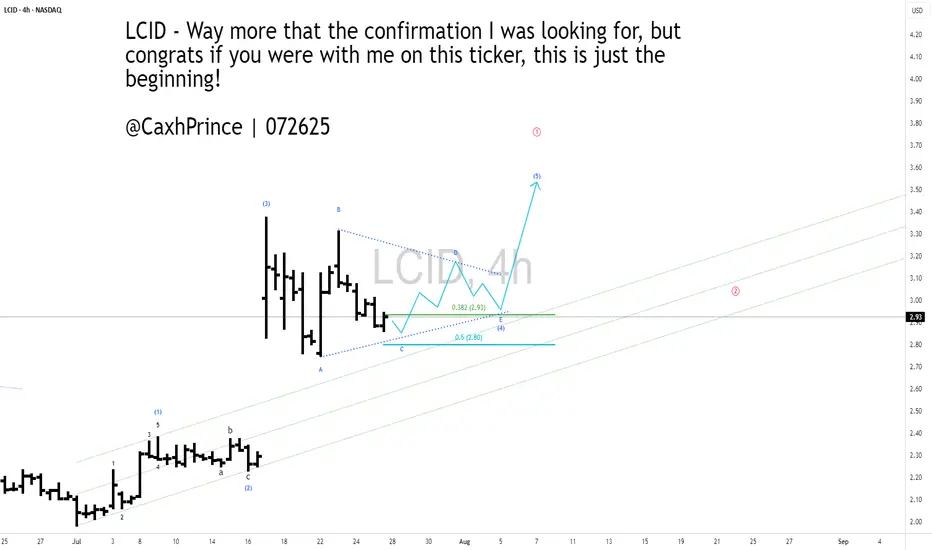
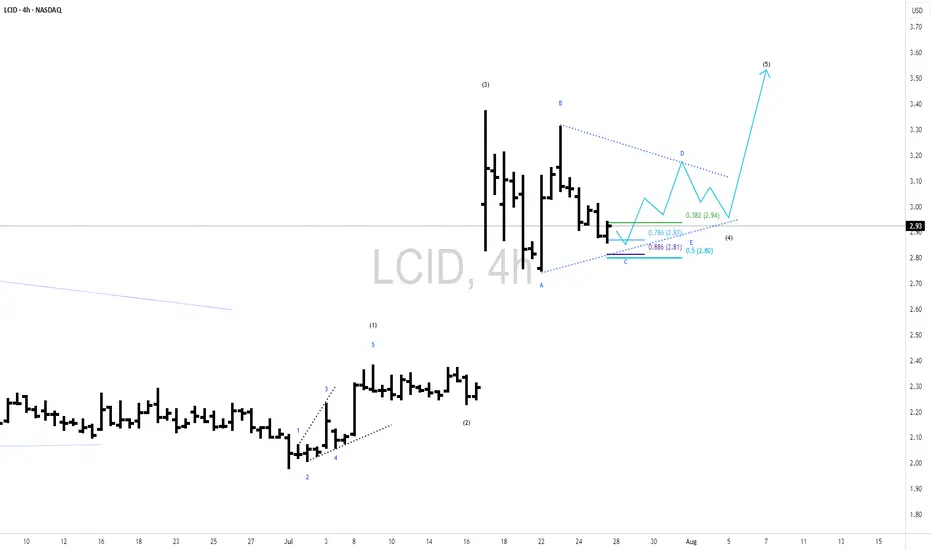
#LCID - 4HR [ A potential bullish view]Lucid blasted off last week with the collaboration of Uber and Robo-taxis. I think that blast infused more investors to the stock and I think it may never come back to take out its lows. If it does, I would load up more on it. I like their designs and the fact that they are now compatible with TESLA's Super Chargers make them even more attractive.
In my count here, I am sensing the current correction could form a triangular pattern for another high before one last correction for ABC down.
Go LCID, Go!!!
Check out my other chart ideas @CaxhPrince everywhere.

A 4HR Bullish view on #Lucid Motors ($LCID)Lucid blasted off last week with the collaboration of Uber and Robo-taxis. I think that blast infused more investors to the stock and I think it may never come back to take out its lows. If it does, I would load up more on it. I like their designs and the fact that they are now compatible with TESLA's Super Chargers make them even more attractive.
In my count here, I am sensing the current correction could form a triangular pattern for another high before one last correction for ABC down.
Go LCID, Go!!!
Check out my other chart ideas @CaxhPrince everywhere.
My thoughts on LCID-4HRLucid blasted off last week with the collaboration of Uber and Robo-taxis. I think that blast infused more investors to the stock and I think it may never come back to take out its lows. If it does, I would load up more on it. I like their designs and the fact that they are now compatible with TESLA's Super Chargers make them even more attractive.
In my count here, I am sensing the current correction could form a triangular pattern for another high before one last correction for ABC down.
Go LCID, Go!!!
Check out my other chart ideas @CaxhPrince everywhere.
Time for Lucid Group Inc. (LCID) – Short-Term Bullish --3.50 USDLucid Group Inc. (LCID) on the 4-hour chart is showing a moderately bullish structure, suggesting potential for continued short-term upside. After a period of consolidation and base-building, the price has broken above key moving averages (MA5, MA10, and MA30), which are now turning upward and beginning to act as dynamic support. This shift indicates improving technical sentiment. The nearest resistance is around the $3.08 level — a zone defined by previous swing highs. A confirmed breakout above this level could pave the way toward the next target around $3.50, which represents both a psychological threshold and a former supply zone.
Supporting this bullish outlook, momentum indicators (likely WaveTrend or Stochastic RSI) are signaling continued upside pressure without yet showing strong overbought conditions. However, caution is warranted: if the price gets rejected at the $3.08 resistance, a pullback toward the $2.70–$2.75 support area is possible. Holding that support would be crucial for maintaining the current higher-low structure. Overall, the technical setup favors a move toward $3.50, but it requires follow-through from buyers at key resistance levels.
Potential TP : 3.50 USD

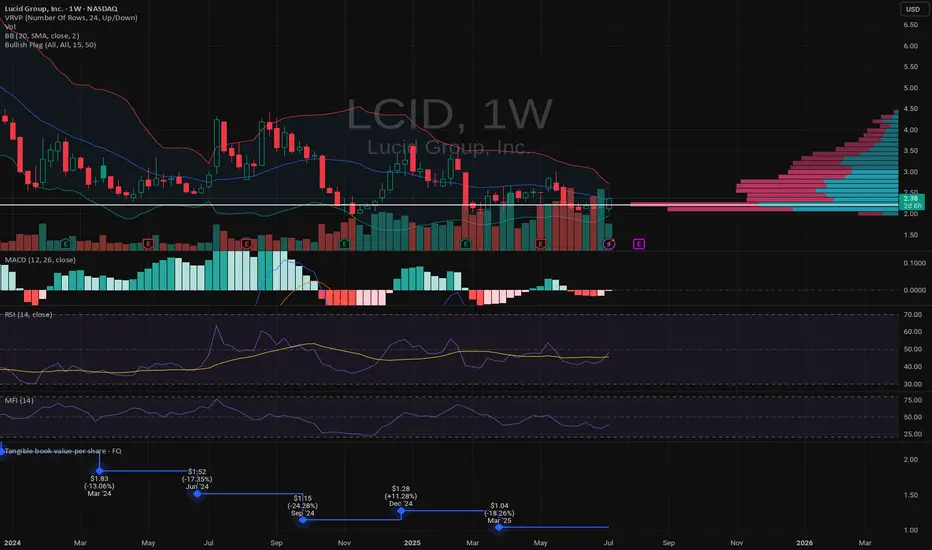
LCID - LONGLCID
LONG
Tight BB building pressure. Lots of other squeezes happening and this is no exception.
not trading advice.