$NBIS – Clean Bear Flag Setup as AI Names Get DistributedNASDAQ:NBIS – Bear Flag Trigger at 81 as AI Trade Unwinds
The AI trade is starting to crack — and NASDAQ:NBIS is shaping up as one of the cleanest downside setups on the board right now.
🔹 The Setup:
NASDAQ:NBIS is forming a textbook bear flag with a clear trigger around 81.
Every bounce has been sold, and the structure remains heavy and controlled — no urgency from buyers.
A breakdown here opens the door to a swift continuation lower.
🔹 Sector Context (This Matters):
AI names are getting wrecked following the NYSE:ORCL news and NASDAQ:AVGO earnings reaction.
We’re seeing distribution, not healthy pullbacks — rallies are being used to exit.
Many AI leaders are flashing topping patterns, signaling a broader unwind of speculative positioning.
🔹 Why NASDAQ:NBIS Stands Out:
Clean levels, clean structure, no chop.
One of the weakest names in the AI basket right now.
Along with NASDAQ:IREN under $40, this offers some of the best-defined risk/reward shorts in the space.
🔹 My Trade View:
1️⃣ Trigger: Breakdown through 81.
2️⃣ Stop: Above the bear flag highs / 9 EMA.
3️⃣ Target: Prior breakdown lows first, then reassess if the sector continues to unwind.
Big Picture:
At this stage of the cycle, AI companies are being distributed, not accumulated.
Until that changes, I’m treating every bounce as a sell-the-rip opportunity.
Market insights

$NBIS AI Infrastructure Gold Rush with Strategic Foresight Appearing in an interview with Reuters on December 3, 2025, Nebius Group N.V. (NASDAQ:NBIS)’s co-founder Roman Chernin spoke with optimism. He argued that demand for AI infrastructure can potentially expand ten- to hundred-fold once enterprises start to adopt rapidly evolving AI models. He shared that the company is building high-margin services and long-term customer relationships to prepare itself for potential downturns. This, he believes, positions the company to act as a consolidator if market conditions tighten.
Nebius Group N.V. (NASDAQ:NBIS)’s expansion strategy includes multibillion-dollar agreements with Microsoft and Meta. These include a $17 billion Microsoft deal signed in September and a $3 billion Meta partnership announced in November. Thanks to these strategic plays, NBIS has risen 248% so far in 2025, with its market cap surpassing the $25-billion mark. Chernin added that these efforts will now be leveraged to expand the company’s client base across traditional enterprises and emerging AI companies amid concerns about an AI bubble.
Meanwhile, the significance of these partnerships was highlighted in earlier analyst commentaries.
Reaffirming its “Buy” rating on November 13, BWS Financial cited strong demand for Nebius Group N.V. (NASDAQ:NBIS)’s AI cloud services and sees the Meta agreement as evidence of growing market confidence, despite short-term operational headwinds.
On the other hand, Citizens JMP initiated coverage of Nebius Group N.V. (NASDAQ:NBIS) on November 19, 2025, setting a $175 price target and an “Outperform” rating. The investment firm noted a shift in broader sentiment, with analysts now seeing the company as a credible ecosystem player, thanks to the Microsoft and Meta deals. The firm added that partnerships with these tech giants dismissed investor concerns tied to the company’s historical links to Yandex.
Through its Avride and TripeTen assets, as well as stakes in Toloka and ClickHouse, Nebius Group N.V. (NASDAQ:NBIS) delivers advanced AI infrastructure solutions to support large-scale compute and data workloads.
Nebius is expected to experience a faster increase in revenue next year, driven by its huge backlog.
The company's capacity expansion plans should support its revenue growth ramp-up in 2026.
Though the stock is expensive, it is still capable of rising impressively in the coming year due to the significant sales increase it is poised to deliver. Nebius' business model should supercharge its growth next year
Nebius rents out its computing power to customers that require it to run AI workloads, store AI-related data in the cloud, train large language models (LLMs), develop custom AI solutions, and execute AI inference solutions. More importantly, the company goes beyond just providing the hardware. It is a full-stack AI company offering managed software services that enable customers to build and fine-tune models and inference applications.
As such, it is in a position to capitalize on two key aspects of the AI market.
First, hyperscalers and AI companies are seeking to acquire computing power to run AI workloads in the cloud. There is a deficit in available AI computing power, which is why major cloud computing companies aren't able to fulfill their contracts. As a result, the contractual backlogs of these companies have skyrocketed.
Second, an increasing number of businesses, governments, and AI companies are likely to develop and deploy AI applications, both for their in-house use and for customers. That's because the technology is driving productivity gains for companies adopting it. Market research firm IDC estimates that each $1 spent on AI in 2030 could generate $4.60 in value.
This should pave the way for Nebius to keep growing at a blistering pace in the coming year, given the full-stack nature of its services. Its revenue in the first nine months of 2025 shot up by 437% to $302 million. Moreover, Nebius also reduced its adjusted net loss by 61% during this period to $170 million.
Management expects to achieve annualized run-rate revenue of $7 billion to $9 billion by the end of 2026. It calculates this metric by multiplying the revenue in the final month of the quarter by 12. This means sales in December 2026 could be as high as $750 million. That's significantly higher than what the company has generated so far in 2025.
For comparison, Nebius is expected to close 2025 with $556 million in revenue, up by 374% from last year. Analysts expect an acceleration in its top-line growth to $3.3 billion in 2026.
Nebius' revenue, therefore, could jump sixfold next year. This ambitious target seems achievable because the company has landed a couple of huge contracts from Meta Platforms and Microsoft that are likely to supercharge its growth in 2026. These two companies alone have created a revenue backlog of more than $20 billion for the company.
As a result, Nebius now plans to increase its connected data center capacity to a range of 800 megawatts (MW) to 1 gigawatt by the end of 2026. That would be a major increase over the 220 MW of connected power that it's projecting by the end of 2025. This major capacity expansion should support the incredible revenue growth that analysts are expecting from the company next year.
But will this blistering growth be enough to send the stock higher?
Investors may be worried about one thing
The stock's stunning rally in the past year is the reason it's now trading at a costly 65 times sales. That's way higher than the U.S. technology sector's average price-to-sales ratio (P/S) of 9.
But then, Nebius' red-hot growth, which is set to get better next year, justifies its valuation. In fact, the company's forward sales multiples are significantly lower due to the huge growth that it is expected to deliver. Even if Nebius trades at a significantly discounted 10 times sales (almost in line with the tech sector's average) next year and delivers $3.3 billion in revenue, its market cap could hit $33 billion. That points toward potential gains of 33% from current levels. However, this AI stock could deliver more than that since it is likely to enjoy a premium valuation due to its huge backlog, which could help it beat Wall Street's revenue expectations for 2026.

NBIS Weekly CALL Play: Early Pump Targeted Before the DropNBIS Weekly Signal | 2025-12-08
🔥 Market Mood: Mixed Momentum
📈 Indices: S&P and Nasdaq showing mild bullish bias
💵 Volatility: Cooling off — traders favor short-term breakouts
🧠 Flow Sentiment: Calls slightly outweigh puts (mildly bullish)
🏦 Macro: No major Fed events today → smoother intraday setups
🎯 Spotlight Trade Idea (General Template)
(Works for any stock — tell me a ticker and I’ll customize it.)
Setup Type: Momentum Scalping
Direction: LONG (high-volume breakouts)
Ideal Entry: At retest of support / VWAP bounce
Target Range: +0.8% to +1.5%
Stop Loss: Below VWAP or -0.5%
Confidence: Moderate (50–60%)
Timeframe: 5–30 min candles
🧠 Why This Works Today
Market volatility is low → breakout patterns cleaner
Options flow is leaning bullish → supports long scalps
High-volume names (NVDA, AAPL, TSLA, META) showing strong tape action
Algorithms heavily targeting liquidity pockets → fast moves
⚠️ Risk Notes
Avoid chasing extended candles
Respect stop losses
Liquidity thinner near close → extra slippage risk

More downfall in NBISNBIS waves still look very much in middle of a 7 wave down move correction (6 completed). The 7th wave is going to be sharp, fill all gaps, touch long standing trend resistance line which interesects with 0.5 levels of complete upmove.
Wait for a better entry at $58 mark.

$NBIS - Not in position, but bullish long-term.Currently watching from the sidelines. While the AI infrastructure thesis is compelling, the technical setup isn't screaming "buy now."
Why I prefer NASDAQ:NBIS over NASDAQ:IREN :
- Far less climactic price action.
- Better positioned structurally with Microsoft/Meta contracts
- More room to build a base without FOMO pressure
Patient approach:
Easy path to $70 if selling continues (38% off highs already)
New ATH likely won't come until well into 2026
No rush - let the story develop and the chart settle
My plan: Wait for a proper base formation or compelling technical entry. The fundamental story will still be there in Q1/Q2 2026. Better to miss the first 10% of a move than catch a falling knife with this much volatility and dilution risk.

$NBIS Fundamental Catalysts and Institutional Confidence
NASDAQ:NBIS The core investment thesis for Nebius is powerfully underpinned by its recently secured position as a critical infrastructure partner for AI industry leaders. The landmark $17.4 billion, five-year agreement with Microsoft, announced in September, served as a transformative catalyst, propelling the share price 47% higher and fundamentally resetting the market's perception of the company. This was decisively followed by a $3 billion deal with Meta, confirming that the Microsoft partnership was not an isolated event but rather indicative of Nebius's proven capability in the high-stakes AI capacity arena.
Citizens Financial's Market Outperform rating and $175 price target underscore this shift, explicitly noting that these endorsements from Microsoft and Meta effectively mitigate any prior market concerns regarding the company's historical ties to Yandex, validating its security and operational integrity. Furthermore, the growing institutional interest is quantifiable, with 65 hedge funds reporting positions in their Q3 13F filings, including a notable 56% increase in stake from Jericho Capital Asset Management.
Crucially, management's commentary indicates these mega-deals are not the ceiling but a foundation. CEO Arkady Volozh stated that the Meta deal was "limited only by the capacity we had available," signaling immense, unmet demand. These contracts provide Nebius with formidable, pre-committed revenue streams to finance the aggressive expansion of its core AI cloud business, which continues to serve a broader base of AI startups and enterprises.
Technical Analysis and Price Structure
Complementing these robust fundamentals, the stock's price action is currently tracing a recognizable bullish XABCD harmonic pattern, suggesting the completion of a corrective phase and the initiation of a new upward impulse wave.
Key Support and Hierarchy: The primary and strongest support level rests firmly at $80.00, which aligns with the pattern's structure and recent consolidation. Should broader market volatility induce a deeper pullback, two subsequent Fibonacci-based support zones are identified:
Support 1: $62.60 (at the 0.618 Fibonacci retracement level).
Support 2: $50.00 (a significant psychological and technical level).
Critical Risk Zone: A breach below $50.00 would enter a "danger zone" around $40.00, which would threaten the integrity of the current bullish pattern and necessitate a fundamental reassessment of the trade thesis.
Momentum Trigger: A defined "blue line" resistance trendline (often corresponding to the pattern's completion point or a key moving average) is acting as immediate overhead resistance. A sustained break and close above this blue line is critical, as it is expected to trigger the next wave of bullish momentum, confirming the pattern's predictive move.
Projected Targets: Upon a confirmed breakout, the pattern projects two primary upside price objectives:
Initial Target: $140.00
Extended Target: $160.00
These technical targets, when viewed alongside Citizens Financial's $175 fundamental price target, create a convergent band of expected appreciation, offering a clear risk-reward framework.
Synthesis and Outlook
In summary, Nebius Group has successfully transitioned into a credentialed and sought-after player in the AI infrastructure landscape, backed by multi-billion-dollar votes of confidence from industry titans. This fundamental momentum is now mirrored in the technical chart, where a bullish XABCD pattern indicates a high-probability setup for a significant advance. The convergence of a $175 analyst price target and technical projections toward $140-$160, guarded by well-defined support near $80, presents a structured opportunity. Investors should monitor for a decisive breakout above the noted blue line resistance to confirm the anticipated bullish momentum is underway.

NBIS Bearish ContinuationNBIS on the 1D chart is locked in a clear downtrend since mid-October, rolling over from highs above 140 to consolidate around the 94 area. Price is trading below the 20-day MA (~99.40) and 60-day MA at 106.23, while still holding above the long-term 120-day MA near 81.57. Momentum confirms the bearish tone: MACD is negative with the line below the signal, and Squeeze Momentum is deeply red, showing strong downside pressure. Structurally, price is moving inside a Bear Flag consolidation after a sharp drop, pointing to a potential continuation move lower once the range gives way.
For now, 106.23 is the key resistance, reinforced by the 60-day MA, with an intermediate supply band around 98–100 near the 20-day MA. As long as price stays capped beneath that zone, the primary path favors a downside break. A daily close below 93 and the lower flag boundary would lean toward continuation, opening room toward 90 first and then the stronger demand region around 85. If 81.57 fails on a decisive breakdown, an extension toward 78 cannot be ruled out.
On the flip side, a daily close back above 100 and a clean reclaim of the 20-day MA would start to challenge the bearish narrative, potentially squeezing price toward 102 and even 114 if momentum flips. Until that happens, sellers keep the upper hand and invalidations should be respected with discipline. This is a study, not financial advice. Manage risk and invalidations.
Thought of the Day 💡: The best trades aren’t the loudest setups, they’re the ones with clean levels and clear invalidations.
--------------------------
Thanks for your support!
If you found this idea helpful or learned something new, drop a like 👍 and leave a comment, I’d love to hear your thoughts!

NEBUIS BREAKOUT??The chart shows NBIS trading in a short-term uptrend, the trendline that has been tested multiple times, we are seeing consistent higher lows and strong buyer interest. Price is currently pushing into a major resistance zone at the 200MA, which has acted as a rejection point in the past. There are two potential plays here: a bullish breakout through the 200MA that could open room toward the first target at $102 (T1) and potentially $109 (T2), or a bearish rejection that would likely send price back to retest the ascending trendline and possibly the support levels around $92–$90. Volume has tapered during the pullback(Holiday week) suggesting consolidation rather than selling pressure. Overall, the chart reflects a decisive moment where price must either break above resistance to continue the uptrend or fail and return to support.
Let me know what you think!

$NBIS is most likely in a broad range for a whileNebius is an AI-centric cloud + GPU infrastructure play. Great narrative for the coming years.
But technically, I’d wait. It just triggered a correction after ~25 weeks of trend strength and made small double-top. Historically, it usually needs more time.
Next ~6 months probabilities:
20%: strong upside expansion
20%: major downside leg
60%: broad chop/range ($50–$140)
Conclusion: I will likely be long in the future but for now there are better swing trades to take.
NBIS NeutralSupport Zone
Long entry 88
Stop 80,
Target 120
Risk management is much more important than a good entry point.
I am not a PRO trader.
In my trading plan, the Max Risk of each short term trade should be less than 1% of an account.

Next support levels for NBISAfter breaking down past week, now we face a very important week for markets, where we have almost a data issued every day.
These are the supports for the downside, where the last one means almost a 60% down.
If we are able to respect the upper monthly support, the trend can continue up, but also be careful of a possible bear flag that takes up down there.
NBIS US🌎Nebius (NBIS) — Strong Growth on the AI Wave
In Q3, revenue from the core data center business reached $146.1 million, a staggering 355% year-over-year growth.
The partnership with Microsoft is fundamentally changing the scale of Nebius's business. Annual recurring revenue (ARR), the company's key metric, is projected to be $7-9 billion next year, up from $0.9-1.1 billion this year. This implies sevenfold growth and is a conservative valuation, given the potential for new deals.
Nebius is a select NVIDIA partner, providing it with priority access to the most advanced GPUs (AI chips).
The launch of its own inference platform (deployment of AI models) enhances Nebius's overall value proposition, enabling customers to implement their AI-based solutions faster and more efficiently.
Although the company is still unprofitable overall, gross profit is growing at a faster pace (+365% year-on-year), and margins have increased by 2 percentage points. This is a key indicator of future profitability.
Adjusted EBITDA losses narrowed by 89% year-on-year to $5.2 million, and the core AI infrastructure division is already profitable on this metric with a 19% margin.
Compared to some competitors (such as CoreWeave), Nebius uses a less aggressive debt strategy, mitigating the risk of a slowdown in AI investments.
The company is expected to achieve operating profitability by fiscal 2027-2028, with the potential to achieve positive adjusted EBITDA as early as next year.
Following the earnings report, shares fell 40% from their peaks, bringing an attractive entry point closer. The market overreacted despite outstanding fundamental results.

NBIS Bearish Setup?NBIS spent most of 2025 trending higher, but the tone flipped after late-October’s peak. Price sliced below the 20- and 60-day MAs and is now pressing a critical demand zone at 101.91–99.80 (neckline/MA60 vicinity). A clear Double Top at 135.00 caps the structure, while MACD momentum is decisively negative and Bollinger Bands are opening—classic fuel for continuation if support gives way.
Primary path: a daily close beneath 99.80—and especially <97.00—confirms the breakdown and activates the double-top objective. That opens 95.00 first, then the 90.00–88.00 support zone, with an extension risk toward 82.00 on a measured move. Any weak bounce that stalls under 110.00 keeps sellers in control. For risk control on shorts, an invalidation is a daily close back above 115.50 (reclaiming the 20-day and negating the breakdown).
Alternative: if buyers defend 99.80–102.22 and price reclaims 115.50, that would suggest a failed breakdown. In that case, squeeze pressure can unwind higher toward 112.00–120.00, with 135.00 the larger supply to watch. Bulls are only back in charge on a sustained hold above 115.50; lose 99.80 on a closing basis and the bearish thesis remains the higher-probability track.
Thought of the Day 💡
At turning points, clarity comes from behavior at the line in the sand. Trade the confirmation, not the hope.
This is a study, not financial advice. Manage risk and invalidations

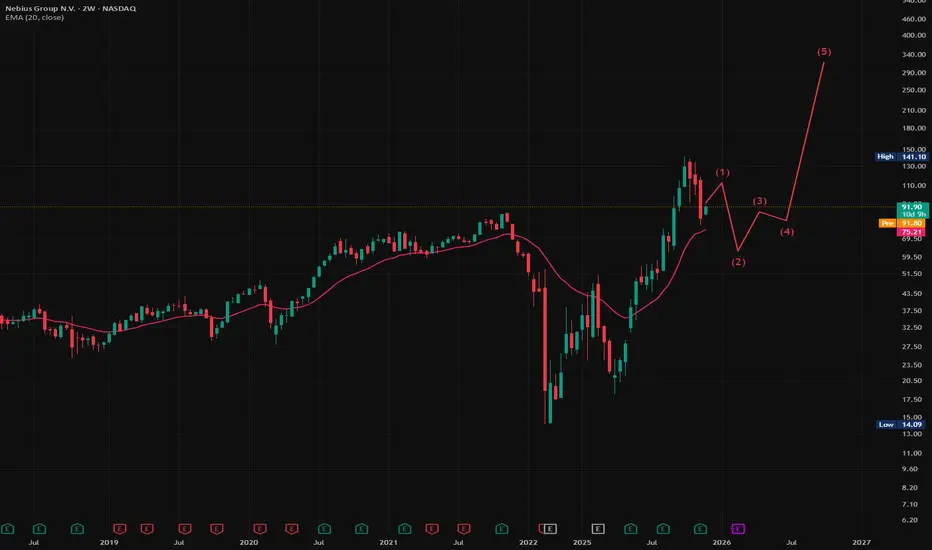
Can NBIS close the 1.618 retracement by EoY?Tomorrow NBIS present their Q3 results.
If we think of a (final?) End-of-Year rally for all related AI stocks, NBIS could be following the ascending channel and reach the 266 $ level by 31st December 2025. That is a 140% ...
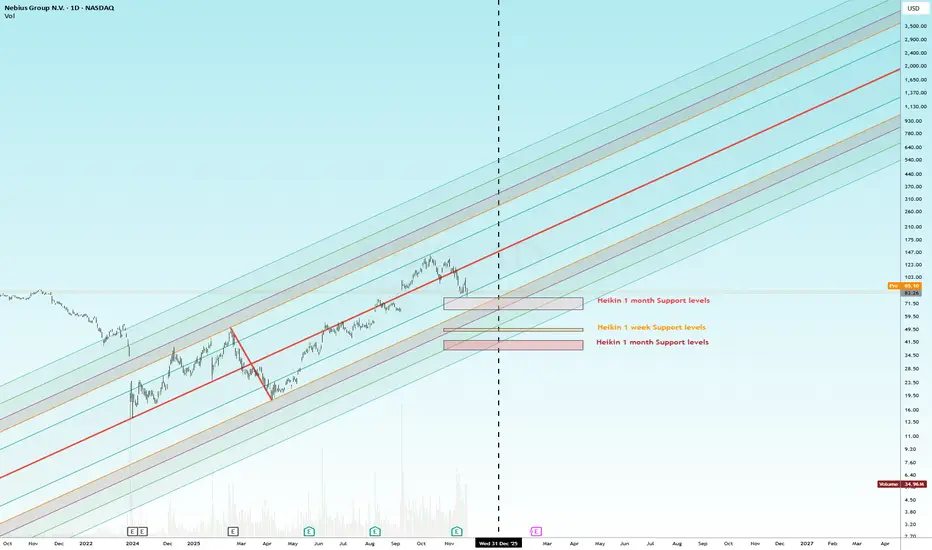
If things go very wrong tomorrow and NBIS lose the ascending trend, the first important support could be the Hekin weekly support at around 82 $.

NBIS QuantSignals V3 Weekly 2025-11-09NBIS QuantSignals V3 Weekly 2025-11-09
NBIS Weekly Signal | 2025-11-09
• Direction: BUY CALLS | Confidence: 58%
• Expiry: 2025-11-14 (6 days)
• Strike Focus: $107.00
• Entry Range: $6.70
• Target 1: $9.75
• Stop Loss: $4.55
• Weekly Momentum: BULLISH (+9.32% 1W)
• Flow Intel: Bullish (Low P/C Ratio) | PCR 0.34
• 🔴 HIGH RISK WARNING: Use only small position size due to lower confidence and high uncertainty.
⚖️ Compliance: Educational commentary for QS Premium members only. No financial advice.
🎯 TRADE RECOMMENDATION
Direction: BUY PUTS
Confidence: 58%
Conviction Level: SPECULATIVE
🧠 ANALYSIS SUMMARY
Katy AI Signal: NEUTRAL trend (50% confidence) with bearish bias - predicts price declining from $114.81 to $112.26 (-2.22%) by week's end with stop at $116.53
Technical Analysis: Stock shows weak momentum despite weekly bullish context - 24h decline of -12.50%, trading near week range top (90.1%), MACD momentum bearish for weekly swing
News Sentiment: Minimal recent news impact - background technology sector updates with no immediate catalysts driving current price action
Options Flow: Conflicting signals - low Put/Call Ratio (0.34) suggests bullish sentiment, but unusual activity at $86 call indicates speculative positioning rather than strong directional conviction
Risk Level: HIGH - Katy's low confidence (50%) and conflicting technical/flow signals require cautious positioning
💰 TRADE SETUP
Expiry Date: 2025-11-14 (6 days)
Recommended Strike: $107.00
Entry Price: $6.50 - $6.90
Target 1: $9.75 (50% gain from entry)
Target 2: $13.00 (100% gain from entry)
Stop Loss: $4.55 (30% loss from entry)
Position Size: 2% of portfolio
⚡ COMPETITIVE EDGE
Why This Trade: Contrarian play against conflicting signals - Katy's bearish prediction outweighs mixed technical/flow data
Timing Advantage: Early weekly entry allows full capture of predicted downward tr
Image
QS Analyst
APP
— Yesterday at 10:17 PM
ajectory across multiple trading sessions
Risk Mitigation: Strike selection at $107.00 provides adequate buffer (6.8% below current price) for gradual decline scenario
🚨 IMPORTANT NOTES
⚠️ KATY CONFLICT EXPLANATION: Despite composite bullish guidance (+3.7 score), Katy's detailed time series clearly predicts consistent downward movement from $114.81 to ~$111.62 (-2.78%) over the week. The AI shows 96 consecutive prediction points with declining trend, outweighing the composite bullish factors.
Trade is SPECULATIVE due to Katy's low confidence (50%) and conflicting market signals
Monitor for any breaking news that could reverse the predicted downward trajectory
Consider smaller position size given the high-risk nature of this contrarian play
CRITICAL REMINDER: This recommendation follows Katy AI's directional prediction despite conflicting composite guidance. The detailed time series analysis reveals consistent bearish momentum that overrides the mixed technical/flow signals.
📊 TRADE DETAILS 📊
🎯 Instrument: NBIS
🔀 Direction: PUT (SHORT)
🎯 Strike: 107.00
💵 Entry Price: 6.70
🎯 Profit Target: 9.75
🛑 Stop Loss: 4.55
📅 Expiry: 2025-11-14
📏 Size: 2.0
📈 Confidence: 58%
⏰ Entry Timing: N/A
🕒 Signal Time: 2025-11-09 01:17:23 EST
🔴 HIGH RISK WARNING: Use only small position size due to lower confidence and high uncertainty.

NBIS showing a potential C&H?If this move does ultimately materialize, we can expect to reach the previous high of $141.06 in a matter of days.
In the event that we fall below $118 however, this C&H will be considered invalidated.

NBIS eyes on $112.91: proven Golden Genesis to Break or KillNBIS trying to recover from the retreat of high flyers.
Currently testing a proven Golden Genesis fib at $112.91
The whole world is keenly aware of this level so watch closely.
.
See "Related Publications" for other Golden fib reactions, such as META top:
Hit BOOST and FOLLOW for more such PRECISE and TIMELY charts.
=========================================================
.

NBIS, Bullish OutlookWhy the Bull Case Looks Strong
Big Deal Catalyst
Nebius recently landed a massive contract with Microsoft Corporation — a ~$17.4 billion, 5‑year GPU/infrastructure deal (potentially ~$19.4 billion) which signals major trust and scale in its business.
That kind of deal moves the needle and places NBIS into the line of sight as a serious player in the AI infrastructure race.
Growth Opportunity in AI Cloud Infrastructure
The company is repositioned (post its split from its prior Russian‑associated parent) to focus solely on AI infrastructure, cloud services and GPU‑driven data centres.
Analysts see significant upside if it executes: e.g., Seeking Alpha notes “immense near‑term growth” with a strong cash position and minimal debt.
Momentum & Market Positioning
Shares have surged dramatically YTD, meaning investor sentiment is already shifting.
The company is positioning itself to fill large data‑centre and compute gap for major tech players, which is a structurally attractive niche.
Valuation & Upside Potential
While the valuation is high (many multiples of earnings or revenues), the theory is: you’re paying for future scale, not just current output. Some analysts believe there’s meaningful upside if growth continues.

NBIS : Long worth TryingNebius group stocks are technically strong.
The downtrend since November 9, 2021 has been broken and the price is trading above the 50 and 200-period moving averages.
When we draw a medium-term Fibonacci level, we can take the take profit point at 0.618 and the stop-loss point at 0.382.
This gives us a Risk/Reward Ratio of 3.00.
A small position size is ideal.
Risk/Reward Ratio : 3.00
Stop-Loss : 43.46
Take-Profit : 60.00

NBIS – Sharp Pullback After Parabolic Run: Oct. 21-25Watching $110–$115 for the Next Pivot ⚡️
🟩 Daily Timeframe – Macro Trend and Correction Phase
After a massive parabolic rally through September and early October, NBIS is undergoing its first meaningful correction within a clean ascending channel. Friday’s session dropped nearly −7.8%, confirming a short-term reversal from the overextended highs.
Price has now fallen back into the lower midline zone ($112–$115), aligning with previous breakout support. This zone acts as the key pivot: bulls must defend it to keep trend structure intact.
Technicals:
* MACD has clearly crossed bearish — momentum rolling over with expanding red histogram.
* Stoch RSI sits deep near 5.0, indicating the stock is oversold but not yet reversing.
* The rising channel remains valid; however, the next lower trendline support is around $100–$102, making that the possible landing zone if $110 breaks.
If buyers reclaim $120+, momentum could quickly shift back up, but until then the trend favors a controlled pullback inside the broader bullish structure.
🟦 1-Hour Timeframe – Local Structure and Trend Shift
The 1-Hour chart shows a clear Change of Character (CHoCH) followed by a Break of Structure (BOS) around $113, confirming the short-term bearish control.
NBIS is now trapped in a descending wedge between $110 and $123, forming lower highs and higher lows as volatility compresses. This pattern often signals bottom formation or continuation, depending on whether bulls can force a reclaim above resistance.
Key observations:
* CHoCH at $118, BOS below $113, confirming supply dominance.
* Price holding $111–$112 support, forming a potential accumulation base.
* MACD histogram stabilizing, hinting that downside momentum might be slowing.
* Stoch RSI bouncing from oversold — could lead to a temporary relief rally early week.
If bulls can break $115–$116, expect a retest of $120–$123; failure to hold $110 opens room toward $103–$105.
🟨 15-Minute Timeframe – Intraday Setup and Liquidity Sweep Zone
On the 15-minute chart, we can see NBIS attempting to build an intraday base after printing a BOS at $113.5. The short-term descending trendline (from $123) remains intact but is getting tested repeatedly — suggesting pressure is shifting from sellers to buyers.
* A small CHoCH printed late session near $113.8, showing possible micro-structure reversal.
* MACD rising with early bullish divergence vs price.
* Stoch RSI recovering from deep oversold levels — confirmation of buyers stepping back in.
Intraday key zones:
* Support: $110.9–$112.0
* Resistance: $115 → $120.3
A clean 15-min close above $115 could trigger a sharp relief rally to $120–$123. However, if the $110.9 level gives out, expect a quick flush to the $103 liquidity pocket.
🎯 Trade Scenarios
Bullish Setup 🟢
* Entry: Break above $115–$116 with increasing volume.
* Target: $120 → $123 → $130.
* Stop-Loss: Below $110.
* Confluence: MACD crossover + RSI > 55 on 15M/1H.
Bearish Setup 🔴
* Entry: Breakdown below $110.9 or rejection from $120 zone.
* Target: $103 → $98.
* Stop-Loss: Above $116.
* Confluence: MACD flattening + EMA slope turning down.
🧭 Outlook for the Week (Oct 21 – 25)
NBIS is in a healthy correction phase following a euphoric run — the type that shakes out weak hands before the next real leg. The $110–$115 region will define whether this is a bullish pullback or the start of deeper retracement.
If bulls hold $110 and reclaim $120, expect a mean-reversion bounce to $125–$130 midweek. But if $110 fails, the stock likely revisits its trendline base near $100 before finding fresh demand.
Patience will be rewarded — watch the wedge breakout and RSI structure before committing size.
Disclaimer:
This analysis is for educational purposes only and does not constitute financial advice. Always conduct your own research and manage your risk.

NBIS NebiusNASDAQ:NBIS Nebius This name looks to be breaking through the uptrend line. A close above this zone — which has acted as resistance until now — flips it into support. Keep in mind, a retest of that uptrend line is likely after the breakout, and that retest would offer a clean buy setup. Follow me on X Enginv777

NBIS LONGI’ve been a long-time investor in APLD since it was in the $2–3 range—I really like the business model. NBIS caught my attention a few months ago and looks poised for another move higher, with an earnings gap up followed by tight consolidation above.
NBIS is showing impressive momentum, up over 250% year-to-date, fueled by a $17.4 billion AI infrastructure deal with Microsoft and massive revenue growth (+322% QoQ). While the company still has losses, earnings are improving sharply, highlighted by a recent 392% EPS QoQ surge, supported by a strong balance sheet (quick ratio 9.6, moderate debt).
Currently trading around $99 with a market cap of $24.8B, the forward target price sits at $127.20, suggesting significant upside. Technicals confirm strong accumulation, with the stock well above its 20, 50, and 200-day SMAs and an RSI near 74, showing bullish momentum without being overbought. Insider ownership is a healthy 20%, signaling confidence.
If it breaks out, this stock could potentially double in the coming weeks to months.

NBIS spec longNBIS is down 5% as I write this, ugly. But earnings were good and I think a weak hand shake-out with the overall market beta flush. Looks like a head and shoulders forming on the daily with what should be support at VWAP from earnings gap at 69.14ish down to the 20day EMA at 66.50ish.
