Day/Swing Trade To The DownsideOnce we break this yellow zone take this to the downside , grab a contract thats not too far away from the money (ROBINHOOD)
4HR & 30M Timeframe
Market insights

PLTR – Parabolic Rally Exhaustion | Bearish DivergencePLTR
Stock is trading at aroud 5068% Overvalued Levels
Shows signs of trend exhaustion after a strong parabolic rally.
Multiple rejection highs near the top, combined with a clear bearish RSI divergence, suggest weakening momentum.
Price has lost Supertrend support and is now moving toward a key pivot zone around 150 USD.
A breakdown below this level could trigger a deeper correction toward the 120–125 USD area.
As long as price remains below the recent highs, the bias stays corrective.

Palantir - H&S - ShortExpecting something like this to play out coming weeks for Palantir. Went short on the top of the right shoulder (It is still in process of being a shoulder).

PalantirPLTR is trading at the top of tis respective target box. Looking at the overnights, price is currently up by a little over a dollar. That isn't too significant, but the white count doesn't have much room left to the upside before the turquoise pattern takes precedent. If price moves above $187.06, then I will transition to the turquoise pattern. The white count never hit the 1.0 where a=c though. This is the main reason I still favor the white count. However, as I have mentioned several times in the past, that is not a governing rule of price action. It is merely the standard in a corrective pattern.
One thing I do not like about the white count though, is the lack of structure within this last move higher. Traditionally b waves present as 3-wave structures. Although I could technically make 3 waves out of this pattern higher, it isn't very clear. Ultimately time will tell. As I mentioned above, price has little room to the upside before it presents us with clarity. Hopefully, we can get clarity one way or the other this week.

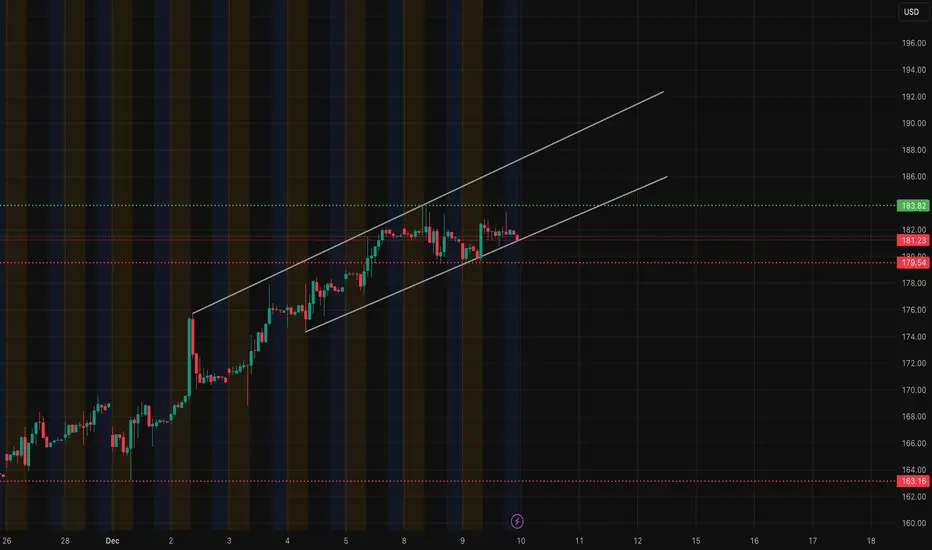
PLTR — Dec. 10 Outlook | Tight Range Inside an Up-ChannelTight Range Inside an Up-Channel, Watching 181–180 Zone
PLTR has been walking up inside a clean ascending channel for several sessions, and today’s structure keeps that story intact — but pressure is building at the mid-channel line.
On the 1H, price is still respecting the channel, but momentum is slowing. You can see several candles failing to push through the 183 area. This is the same zone where sellers stepped in previously, and it lines up with the green resistance band.
The 15-minute SMC chart gives a clearer read on intraday behavior. Earlier we had a BOS toward the upside, but now price is drifting back into the lower half of the wedge. The latest movement shows a CHoCH toward the downside, which warns that buyers are losing control short-term. As long as price sits under 182–182.8, buyers are not in full momentum.
The downside SMC levels at 181.23 → 180.77 → 179.55 are the zones to watch. If PLTR loses 181 with conviction, we likely slide into the discount zones you mapped — especially the 179.5 liquidity level.
Now the GEX chart is important here. PLTR is pinned between heavy call interest above (183–188) and notable put support building near 172.5–170. That creates a compression window around current price. GEX is neutral to slightly supportive but not strong enough to force a breakout on its own. If price stays under 183, dealers aren’t under pressure to hedge upward — meaning upside moves can fade quickly.
So the way I’m looking at this:
If PLTR holds 181 and stays inside the channel bottom, buyers still have a chance to rotate back into 183. That’s the only spot where a real breakout would make sense.
If 181 breaks, it opens the path toward 180 and potentially 179.5, which is where liquidity sits and where price would likely stabilize before deciding the next leg.
This chart right now is about patience. No momentum until one of these levels breaks cleanly.
Disclaimer:
This analysis is for educational purposes only and not financial advice. Always do your own research and manage risk according to your trading plan.
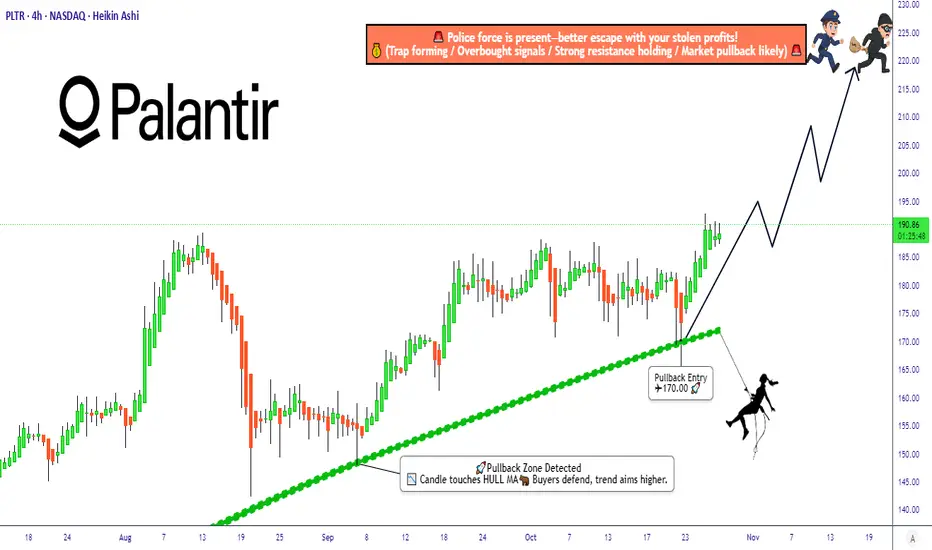
Palantir (PLTR) Bulls Preparing for Takeoff — Setup Explained💎 PALANTIR TECHNOLOGIES INC. (PLTR) — Swing Trade Profit Playbook 💎
Exchange: NASDAQ
Style: Swing Trade | Thief Layering Strategy | Bullish Pullback Setup
🧭 PLAN
We’re plotting a bullish pullback setup confirmed by the Hull Moving Average and a Heikin Ashi reversal doji — signaling that buyers are regaining strength and getting ready to dominate again. 💪📊
This setup thrives when the crowd is sleeping — that’s when the thief plans the perfect entry on discount zones! 🕶️💸
🎯 ENTRY STRATEGY — “THIEF LAYERING SYSTEM”
Instead of chasing green candles, this strategy stacks multiple buy limit layers to build position quietly and efficiently. Each layer grabs value from dip zones — just like a thief collecting gold coins on the way down! 🏴☠️💰
Layered Entry Plan:
🔹 1st Layer: $175 — early scout entry, feel the market reaction.
🔹 2nd Layer: $180 — main position loading zone near Hull MA support.
🔹 3rd Layer: $185 — continuation confirmation layer if trend holds.
🔹 4th Layer: $190 — momentum add-on for breakout confirmation.
👉 You can add more layers if volatility gives deeper discounts. Adjust according to your risk profile — precision is key, greed is optional! 🎯
🛑 STOP LOSS
This is the Thief SL at $165 — clean, disciplined, and below the recent structural support.
⚠️ Note to all Thief OG’s: This isn’t a fixed stop for everyone. Manage your own risk — move smart, stay stealthy. Every thief has their own escape route! 🏃♂️💨
💰 TARGET / TAKE PROFIT
Our main target is $220, where the “police force” (strong resistance) is waiting to trap late buyers. That’s our signal to escape with profits while the market gets noisy. 🚨💵
⚠️ Note: Don’t copy-paste my TP — adjust it based on your risk-reward ratio. The thief gets in, takes the bag, and disappears like smoke! 😎💨
🌐 CORRELATIONS & RELATED PAIRS TO WATCH
While executing this PLTR play, keep an eye on related movers:
💡 NYSE:AI (C3.ai): another AI data stock — often mirrors PLTR’s momentum.
⚙️ NASDAQ:NVDA (NVIDIA): strong leader in AI space; when NVDA rallies, PLTR usually follows.
📊 NASDAQ:QQQ (NASDAQ ETF): overall tech sentiment indicator — if QQQ pulls back, expect PLTR sympathy moves.
🧠 NASDAQ:META , NASDAQ:GOOG : big-data and AI-driven plays that set tone for broader sector trends.
Key Insight: When NASDAQ:QQQ or NASDAQ:NVDA show continuation strength, PLTR tends to respond aggressively due to its higher volatility factor. A synchronized move could amplify this setup’s reward potential! 💥📈
⚙️ MARKET CONTEXT
Palantir continues to benefit from the AI and defense analytics boom, showing stronger fundamentals and recurring government contracts. The chart recently cooled off, forming a healthy reaccumulation base, ideal for swing traders planning layered re-entries before the next push to $220+. ⚔️📊
🕶️ DISCLAIMER (READ BEFORE HEISTING)
This is a Thief-Style Trading Strategy — meant for fun and education.
Trade smart, manage your capital, and always protect your loot! 🧠💼
✨ “If you find value in my analysis, a 👍 and 🚀 boost is much appreciated — it helps me share more setups with the community!”
#PLTR #Palantir #SwingTrade #ThiefStrategy #StockMarket #AI #BullishSetup #TechnicalAnalysis #HullMA #HeikinAshi #RiskManagement #NASDAQ #ProfitPlaybook
Palantir Technologies Inc. poised for breakout above key support
Current Price: $183.57
Direction: LONG
Confidence Level: 70% (Several professional traders identify a firm support base at $177–$180 with bullish technical undercurrents. While X sentiment is mixed, the growth-focused tilt plus above‑average trading volume supports a moderately confident LONG call.)
Targets:
- T1 = $185.00
- T2 = $190.00
Stop Levels:
- S1 = $182.00
- S2 = $180.00
**Wisdom of Professional Traders:**
Drawing from the collective insight of multiple professional traders, the mood leans toward building a long position this week. The frequent emphasis on the $177–$180 support area shows how traders see this as a launch pad for further gains. Several traders highlighted how PLTR has respected this zone repeatedly, bouncing back intraday and holding higher lows, which points towards underlying demand and the potential for a quick rally if resistance is tested. The narrative ties in with strong earnings growth and expanding commercial revenues — catalysts that many traders believe will keep buyers engaged.
**Key Insights:**
The main thing I’m watching is how technical momentum is starting to shift upward. MACD is curling into a bullish cross, RSI sits comfortably at 48 giving room to run before overbought territory, and volume has been running about 20% higher than average. The $185 level is coming up often — traders see it as the first breakout trigger, with a sustained push above this opening the path to $190. Fundamentally, Palantir’s 30% YoY revenue growth and 121% surge in U.S. commercial business are reinforcing bullish sentiment despite valuation concerns.
This mix of steady price action near support and elevated trader chatter is also hinting at a potential short‑squeeze scenario, given the large short interest. A high-profile position against PLTR could backfire quickly if buying pressure pushes past resistance with momentum.
**Recent Performance:**
You can see this in last week’s moves — PLTR dipped to $177 before reversing sharply to $186 intraday, then settling back to $183.57. That rebound was accompanied by significant volume above the 34M average, showing strong interest during dips. Even with broader tech weakness, Palantir has been holding in the upper band of its recent range, demonstrating resilience and a willingness from buyers to step in.
**Expert Analysis:**
Several professional traders are zeroing in on $177 as the key floor and $185 as the near‑term ceiling. The consensus is that staying above $182 keeps the bullish bias intact while offering a tight entry point. The 50‑day EMA near $176 still acts as deeper support, providing a cushion in case of unexpected volatility. Given Palantir’s high beta (~2.3), analysts expect a sharp reaction to any catalyst in the next few sessions — which favors a LONG trade now right before a critical resistance test.
**News Impact:**
Recent Q3 earnings smashed records with net income hitting $144M and major contract values climbing, which traders consider a solid fundamental tailwind. The CEO’s interview gaining virality has boosted meme interest, an ingredient that often accelerates upward momentum. While a stretched P/E is a risk, this also sets the stage for fast moves if positive news or technical signals emerge, since shorts will be forced to cover in a rising market.
**Trading Recommendation:**
Here’s my take — I’m going LONG with an entry in the $182–$183 zone, targeting $185 for the first breakout milestone and $190 if momentum stays strong over the next 5–7 trading days. Stops are set tight near $182 for initial protection, with a secondary stop at $180 to shield against deeper pullbacks. Keep an eye on whether volume holds above average at resistance — if it does, this trade offers a solid risk‑reward profile backed by both technical setup and improving fundamentals.

PLTR Dec 12. Testing Supply While Holding Higher LowsPLTR has been climbing steadily off the morning low and is now sitting inside a rising structure on the 15-minute timeframe. Price continues to make higher lows, but it is also repeatedly stalling at the same supply zone near 188–189. This level has acted as a ceiling for two sessions, and today’s late trading once again paused right beneath it.
The rising trendline from the morning recovery shows solid buyer interest — each dip into that trendline was defended, keeping PLTR on an upward trajectory. As long as price stays above 185.5–186, the immediate structure remains constructive.
Above price, the 189–190 zone is the key breakout area. It has rejected PLTR multiple times, and the most recent candles show hesitation as soon as price approaches it. A clean break above 189.5 would shift control toward buyers and give PLTR room to test the upper boundary of the channel near 190.5–191.
Below price, the next meaningful support sits at 182.5–183. This level served as the reaction zone earlier, and it aligns with the mid-channel structure. A break below 185 would likely send PLTR back into 183–182.5 to find buyers.
Now looking at the options landscape, the GEX levels strengthen these same areas of interest.
The 189–190 zone corresponds with a significant positive gamma cluster — the highest positive NET GEX region for PLTR right now. When price pushes into these upper positive-gamma areas, dealer hedging tends to resist expansion, which explains the repeated slowdowns near 189–190. Price does not immediately reject, but it stalls, hesitates, and comes back down, which matches exactly what the chart shows.
If PLTR breaks and holds above 190, it clears the gamma resistance band and opens the pathway to the next call concentration around 192–193. In that environment, hedging pressure shifts and allows price to travel more freely.
On the downside, negative gamma pockets appear around 182–180. These levels align with the lower demand zone and the mid-channel support. If PLTR loses 185 and falls into these gamma pockets, volatility expands and price can accelerate more quickly toward 182.5–180.
This alignment between price structure and GEX creates a clean roadmap for Dec 12:
• Holding above 186 keeps the rising structure intact
• Breaking above 189.5 clears the supply zone and targets 190.5–192
• Failing at 189 and dropping under 186 sends PLTR toward 183
• Losing 183 opens the deeper gamma-driven target near 180
PLTR is coiling under a well-defined ceiling with strong support beneath it. The next move through either 189 or 186 should set the tone for tomorrow.
This analysis is for educational purposes only and not financial advice.

PLTR Technical AnalysisAfter a strong bullish trend, PLTR is now showing signs of momentum weakening, with sharp swings and unstable highs.
The long-term ascending trendline (black) remains the key structural support, and price reaction around this level will define the next move.
The 50-day SMA is still holding, but volatility near resistance suggests growing uncertainty.
Bullish Scenario
If price holds the ascending trendline and breaks above recent resistance:
Targets
• Target 1: 195
• Target 2: 205
• Target 3: 215–220
Stop Loss
• Daily close below 175
Rationale:
Holding the trendline and breaking higher would confirm trend continuation and renewed bullish momentum.
Bearish Scenario
If price breaks below the ascending trendline and confirms the breakdown:
Targets
• Target 1: 160
• Target 2: 150
• Target 3: 140–145
Stop Loss
• Reclaim and daily close above 185
Rationale:
A trendline breakdown after multiple failed highs often triggers a deeper corrective phase.
Very Short Summary
• Above trendline → Bullish continuation
• Below 175 → Deeper correction likely

PLTR — Compression Above Key Gamma Zone, TA for Dec 17PLTR spent the session digesting the prior impulse move and is now sitting in a tight range just under the recent intraday high. The bounce from the lower trendline earlier today was clean and impulsive, but since then price has slowed and transitioned into consolidation rather than continuation. That tells me buyers are still present, but they’re no longer chasing aggressively at these levels.
From a structure perspective, the short-term trend is still intact. Higher lows remain respected, and price is holding above the prior demand zone around the mid-180s. As long as that area holds, the bullish structure is not broken. However, momentum has clearly cooled, and this is where PLTR needs a catalyst or liquidity push to resolve the range.
Options positioning helps explain why price is stalling here.
The current price is sitting right inside a positive gamma pocket, with the strongest CALL interest stacked above near the 190–192 area. That zone acts as a magnet only if price can reclaim acceptance above the local high. Until that happens, dealers are likely hedged in a way that keeps price pinned and choppy. This explains the slow grind and lack of follow-through despite a bullish intraday structure.
Below price, PUT exposure increases meaningfully into the low-180s. That area aligns well with the rising trend support on the chart. If price pulls back into that zone and stabilizes, it would be a location where downside pressure may start to get absorbed rather than accelerated.
For upside continuation, PLTR needs to hold above the current consolidation base and push through the upper intraday resistance with volume. Acceptance above that level opens the path toward the next gamma-heavy area near 190+, where momentum can expand quickly if dealers are forced to chase hedges higher.
If price loses the current range and slips back below the rising support, the move likely turns into a deeper mean reversion rather than a trend continuation. In that scenario, the low-180s become the key area to watch for reaction. A clean break below that would shift the bias from consolidation to short-term weakness.
Right now, this is a patience trade. PLTR is not breaking down, but it’s also not ready to trend unless one of these levels is resolved decisively. Until then, expect rotation, fake breaks, and tight intraday ranges.
I’m watching how price behaves around the current consolidation high. Expansion or rejection there will tell the story for the next leg.
Disclaimer
This analysis is for educational purposes only and reflects personal market observations. It is not financial advice. Always do your own research and manage risk accordingly.

I am bullish on Palantir (PLTR)I am bullish on Palantir - $PLTR.
This was the chart for my last Palantir publication, with all the key levels I marked out.
I already bought some with dollar cost averaging. I am buying at the CMP, and my target is $200 - $2007 and beyond.
What is your view on PLTR

Palantir Technologies Inc. eyes $190 breakout this week
Current Price: $181.76
Direction: LONG
Confidence Level: 68% (Several traders leaning bullish with momentum above key EMAs, but sentiment on X is more cautious)
Targets:
- T1 = $185.00
- T2 = $190.00
Stop Levels:
- S1 = $178.00
- S2 = $175.00
**Wisdom of Professional Traders:**
This analysis brings together insights from multiple professional traders and active market watchers, providing a collective view on Palantir's short-term prospects. The traders I've been following agree that PLTR’s recent price action above its 50-day EMA and proximity to the upper range of its recent trading zone is a bullish technical development. Several have pointed out that gamma exposure concentrations at $180 and $190 are acting as price magnets into year-end, suggesting that further upside could come quickly if resistance levels are broken.
**Key Insights:**
Here’s what’s driving this setup for me — traders are focused on Palantir’s ability to hold above $180 after a strong 2.16% move last Friday. Some identified an ABC correction pattern in prior sessions, but the fact that PLTR has broken back above the B-wave high flips the short-term bias bullish. At the same time, revenues are surging with US commercial sales up 121% YoY, which adds a fundamental tailwind to the technical momentum.
What caught my attention is the consistent discussion of $190 as the next key level. That’s not just a round number – several identified it as the next significant resistance, backed by option market positioning. If the stock can clear $185 early this week, a quick push toward $190 is on the table before sellers may push back.
**Recent Performance:**
Last week, Palantir climbed from the mid-$170s to close at $181.76, outpacing the broader tech sector on strong volume. The move pulled the stock back above both its 50-day EMA and important mid-range support-turned-resistance at $180. Earlier setbacks in November had retraced from highs above $200, but the recent rebound is showing energy and has shaken off concerns from the prior 20% drawdown.
**Expert Analysis:**
Multiple professional traders I’ve tracked note that the weekly Ichimoku cloud never flipped bearish throughout this pullback – a sign of trend resilience. They see that as a green light for resuming the uptrend toward the higher end of the annual range. On short-term charts, the consolidation above $177 is acting as a base. The options market is also skewed toward calls in the $185–$190 range, which aligns with their upside targets. Some caution remains over rich valuation metrics, with P/E ratios above 400, but the momentum and narrative are currently overpowering those headwinds in the near term.
**News Impact:**
Recent headlines have amplified bullish interest — partnerships with Nvidia and other AI-driven companies, plus analyst praises for Palantir’s dual-engine AI platform, have supported the bid. While a few analysts warn of an overextended valuation, fund inflows and hedge fund positioning changes signal that institutional players are still active. This kind of news flow keeps Palantir in the conversation as a key AI beneficiary, reinforcing the technical buy signals.
**Trading Recommendation:**
Here’s my take: I’d lean long on PLTR at current levels, aiming for $185 and then $190 this week, with stops at $178 and $175 to manage risk. The chart is pointing toward a breakout attempt, and the trader consensus I’m seeing favors buying dips above support. I would size moderately given the valuation risks, but the balance of technical, fundamental, and sentiment factors makes this a trade worth taking on the long side.

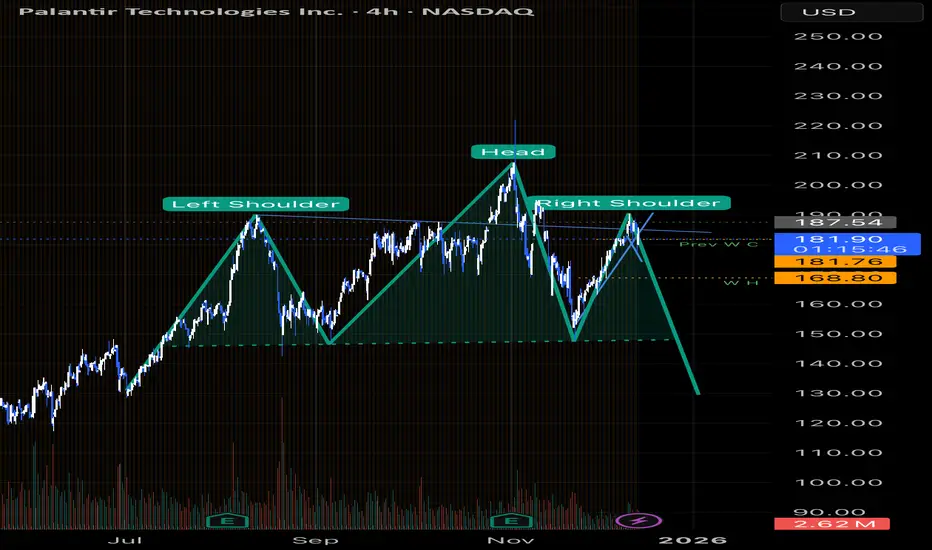
PLTR - H & S Pattern on higher Time Frames?I‘m not a big fan of Pattern Trading but it‘s very helpful to determine direction.
One of the most accurate Patterns - in terms of direction - is the Head and Shoulders Pattern.
Palantir has the most obvius of all AI Stocks. If you check NVDA or AMD, I‘m pretty sure you‘ll also find one.
PLTR“Palantir’s 5-year chart shows a highly volatile post-IPO cycle, followed by a prolonged base and a sharp repricing as profitability, government demand, and AI narrative converge.”

You will ask yourself "how did he know Telsa would make ATH"?This fractal suggested Tesla would soon hit ATH (if it continued to follow Palantir). I've been following this pattern for months (see previous Tesla fractal charts). Here's an example:
But what if Tesla wasn't "following" Palantir minute for minute...but somehow Tesla was ofset (as shown in today's chart? Then a different outcome is revealed.
Today's chart has been a Tesla map and has offered confluence for the charts that I have recently published showing my tesla buy zone before ATH. Everything pointed towards ATH.
I added to my Tesla positions by setting buy orders down to $386 based on the above chart (the anticipated low). Tesla's actual low was around $382. I am pleased that this retracement's bottom was called within 1%. And the anticpated bounce to ATH has also played out as a 35% pump from the $382 low to new ATH (35% so far in the past 16 trading days).
Congratulations to everyone making gains following along.
Now the question remains how high will Tesla's 3rd angle blow off go?
More importantly, how will we know when to get out...before the inevitable larger retracement after this blow off? Following along for the answer to that million dollar question.
May the trends be with you.

Palantir Technologies (PLTR) – Growth1. Strong Revenue Growth: Palantir’s revenues have been growing ~30–40% annually, with commercial expansion complementing its government contracts.
2. AI Integration: Platforms like AIP accelerate AI adoption for clients, giving Palantir a competitive edge in a rapidly growing market.
3. Global Expansion: Partnerships in international markets (e.g., UAE) provide new revenue streams.
4. High Profit Margins: Gross margins are around 80%, and the company generates solid cash flow.

$PLTR long term trend is extremely unsustainable behaviorNASDAQ:PLTR re-entered short. Still expecting reversion toward double digits over next 12 months.
Fundamental thesis: increased competition in 2026 likely.
Technical setup: A bull trend that is this stretched is extremely unsustainable behavior and therefore Palantir is heavily overdue for a major correction.

$PLTR | COVERAGE INITIATED — Personal Position Update [W49]COVERAGE INITIATED — Bullish Classification (Trend Shift Identified)
PLTR — WEEK 49 TREND REPORT | 12/05/2025
Ticker: NASDAQ:PLTR
Timeframe: W
This is a reactive structural classification based on the weekly chart as of this timestamp. Price conditions are evaluated as they stand — nothing here is predictive or forward-assumptive.
⸻
Author’s Note — Personal Position Update
I initiated my own position on [ NASDAQ:PLTR ] during Week [ 49 ], entering at $ [ 181.76 ].
This decision follows my personal criteria: I only participate when my system identifies a verified structural trend shift supported by both a confirmed weekly flag and a qualifying candle state. This note reflects my activity only and is not a suggestion for anyone else.
As of this update, my position is currently up ~ [ 0% ] from my entry.
My structural exit level is $ [ 177.54 ] on a weekly-close basis. This level will continue to adjust upward automatically as the structure strengthens. If price closes below that threshold, my system classifies the trend as structurally compromised, and that is where I personally exit.
This update exists solely to document my own participation and the structural levels I monitor. It is not predictive and does not imply any future outcome.
⸻
Structural Integrity
• 1) Current Trend Condition [ Numbers to Watch ]
• Current Price @ $
• Trend Duration @ +0 Weeks
( Bullish )
• Trend Reversal Level ( Bearish ) @ $
• Trend Reversal Level ( Bearish Confirmation ) @ $
• Pullback Retracement @ $
• Correction Support @ $
⸻
2) Structure Health
• Retracement Phase:
Uptrend (operating above 78.6%)
• Position Status:
Healthy (price above both structural layers)
⸻
3) Temperature :
Neutral Phase
⸻
4) Momentum :
Bullish
⸻
Structural Alignment
NEUTRAL STRUCTURAL CONDITION
This mark represents a period where directional behavior was unclear. Market movement here reflected compression, chop, or indecision — neither trend direction was dominant. It does not signal continuation or reversal, only that price action was not showing strong alignment in either direction.
⸻
Methodology Overview
This classification framework evaluates directional conditions using internal trend-interpretation logic that references price behavior relative to its structural layers. These relationships are used to identify when price movement aligns with the framework’s criteria for directional phases, transition points, or regime shifts. Visual elements or structural labels reflect these internal interpretations, rather than explicit trading signals or preset indicator crossovers. This framework is observational only and does not imply future outcomes.

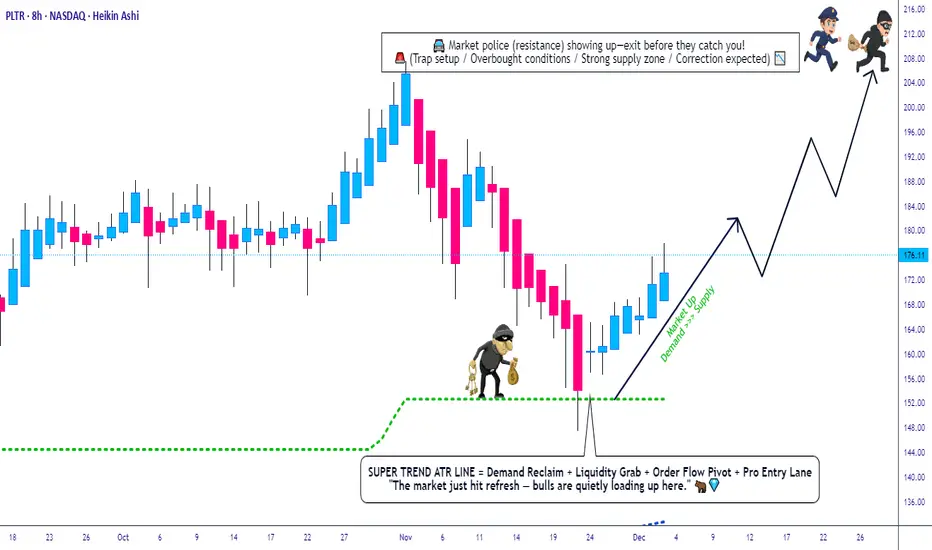
PLTR Swing Map: Heikin Reversal + ATR Push + Trend Confirmation*📈 PLTR — Palantir Technologies Inc. | NASDAQ
Swing Trade Profit Playbook (Bullish Edition) 🔥🕶️**
🔍 Trade Thesis (Polished & TradingView-Safe Version)
PLTR is showing a bullish continuation setup, supported by:
✅ SuperTrend Buy Signal confirming upside momentum
✅ ATR expansion showing strong volatility power pushing price upward
✅ Heikin Ashi Doji Reversal confirming short-term exhaustion + shift toward buyers
💡 A clean technical alignment for a bullish swing structure 📊
🎯 Entry Plan (Thief Layer Strategy — TradingView Permitted Version)
Using the Layered Limit Entry Method (a.k.a. “Thief Strategy” — fun nickname only, but fully rule-safe 🙌):
📌 Layered Buy Zones:
Buy Limit @ 150.00
Buy Limit @ 155.00
Buy Limit @ 160.00
Buy Limit @ 165.00
(You may increase layers based on your own plan, risk & liquidity preference.)
This approach helps scale into the position with controlled risk during volatility. 🧩💰
🛑 Stop-Loss (Risk Shield)
SL for this layered structure placed at:
👉 145.00
Note to my respected traders (Thief OG’s 😎):
This SL is NOT a recommendation — adjust based on your personal risk tolerance and account management.
🎯 Target Zone (Resistance + Overbought Region Awareness)
Price faces major resistance ahead + potential overbought traps.
Police (Sellers) are waiting there 🚓… so take profits smartly & exit like a true OG.
👉 Primary Take-Profit Target: 205.00
Note:
TP is NOT a recommendation — set targets based on your strategy and risk profile.
📡 Correlated/Related Markets to Watch
Keep an eye on pairs/stocks that often show AI-tech momentum correlation, macro sensitivity or sentiment overlap with PLTR:
🔗 Related Symbols:
NASDAQ:QQQ — Tracks NASDAQ 100, strongly influences PLTR direction
NASDAQ:NVDA — AI sector leader; strong uptrends often spill over to PLTR
NASDAQ:MSFT — AI + cloud ecosystem correlation
NASDAQ:GOOGL — AI demand + tech-sector flows
NASDAQ:META — Growth-tech sentiment indicator
NYSE:AI (C3.ai) — Direct thematic correlation in AI narrative
AMEX:SPY — Overall market mood, risk-on / risk-off confirmation
📌 Key Correlation Insights:
When QQQ or SPY break upward, PLTR generally strengthens.
AI momentum from NVDA / MSFT earnings or news often boosts PLTR interest.
If tech indexes pull back sharply, PLTR retraces faster due to its volatility profile.
Use these pairs to confirm trend strength, avoid traps, and time layer entries smartly. 🔍✨
📘 Final Notes (Polished for TradingView Compliance)
This trading plan is structured for educational + entertainment purposes, using a fun “Thief Style” theme — but the technical framework is fully professional, rule-compliant, and polished for serious swing traders.
Always manage your own risk, analyze independently, and only trade what aligns with your strategy. 📚⚖️
✨ “If you find value in my analysis, a 👍 and 🚀 boost is much appreciated — it helps me share more setups with the community!”
#PLTR #Palantir #Stocks #SwingTrade #NASDAQ #BullishSetup #TradingView #TechnicalAnalysis #LayersEntry #ATR #SuperTrend #HeikinAshi #RiskManagement #AIStocks #ThiefStrategy #Investing #MarketAnalysis
PLTR — [2D] WEEK 49 TREND REPORT | 12/04/2025PLTR — WEEK 49 TREND REPORT | 12/04/2025
Ticker: NASDAQ:PLTR
Timeframe: 2D
This is a reactive structural classification of PLTR based on the weekly chart as of this timestamp. Price conditions are evaluated as they stand — nothing here is predictive or forward-assumptive.
⸻
1) Current Trend Condition [ Numbers to Watch ]
Current Price @ 178$
• Trend Duration @ +546 Days ( Bullish )
• Trend Reversal Level ( Bullish ) @ 177.54
• Trend Reversal Level ( Bearish Confirmation ) @ 166.16
• Pullback Support @ 133.47
⸻
2) Structure Health
• Retracement Phase:
Uptrend (operating above 78.6%)
• Position Status:
Healthy (price above both structural layers)
⸻
3) Temperature :
Neutral Phase
⸻
4) Momentum :
Bullish
⸻
Author’s Note
NEUTRAL STRUCTURAL CONDITION
This mark represents a period where directional behavior was unclear. Market movement here reflected compression, chop, or indecision — neither trend direction was dominant. It does not signal continuation or reversal, only that price action was not showing strong alignment in either direction.
⸻
Methodology Overview
This classification framework evaluates directional conditions using internal trend-interpretation logic that references price behavior relative to its structural layers. These relationships are used to identify when price movement aligns with the framework’s criteria for directional phases, transition points, or regime shifts. Visual elements or structural labels reflect these internal interpretations, rather than explicit trading signals or preset indicator crossovers. This framework is observational only and does not imply future outcomes.

Palantir Short: Head and Shoulders.Palantir looking like its forming a textbook example of an Head and Shoulders pattern!
I anticipate as (if?) NDQ and SPX keeps declining and for this head and shoulders patterns to execute flawlessly.
There are also contributing signs like seen by the resistance in 180-190 area marked on my chart.
But the key metric for me is VOLUME , volume was very low during our last thrust up which signals to me a trend change for the coming weeks might unfold soon.
Currently about to close the day with a Bearish Engulfing Candle .
180-190 validated once again its proving to be a resistance. PLTR have been strugling with this area for over 4 months.
Over the past 31 days there is a visible volume decrease

$PLTR ShortInitially shorted
PLTR from 175s on 17th
Nov. Closed my position around 153 and bought back for a bounce around 155.
Medium term I am bearish on & PLTR, we can clearly see a failed high at around 209. If price wanted to stay bullish it should have consolidated or stayed above the previous high at around 189 but this to me is a trap price pushing above 189 and coming back down.
I have closed my longs here and will be looking for LH now, might even go to 185 around the 0.618 Flb level but nothing changes for me I will be looking for swing shorts.
Put this post earlier but it was restricted for some reason so posting it again now. Now the price has started to halt near the 0.618 level and we might get the down move now. Let’s see

PLTR growth ideaPotential targets market, trends automatically plotted using TrenVantage LITE indicator. Longer term PLTR has the geopolitical and socioeceonomic factors to succeed. IF AI is indeed a bubble only a few companies will survive and this with all of its government contracts surely will be one of those survivors. Upside target plotted with a retrace this target changes.
