Santa Rally / V-Shaped Recovery WatchNASDAQ:QQQ continues to respect the 50 & 100 DMA, just like every selloff since July. Momentum indicators are exiting oversold territory, suggesting a familiar upside rotation.
AMEX:SPY confirms.
AMEX:IWM remains structurally bullish on the monthly (cup & handle).
CRYPTOCAP:BTC shows classic oversold mean reversion behavior.
Key risk: loss of 100 DMA.
Bias: upside continuation while support holds.
Market insights

Market SignalMarket Signal is an algorithm that evaluates statistical trends in price action of QQQ and its holdings to determine whether QQQ is currently in an uptrend (📈) or downtrend (📉)
Every day after market close, our Market Signal algorithm returns a numerical market sentiment value, ranging from -9 (most bearish) to +9 (most bullish), with 0 being a neutral score.
📈 QQQ is considered to be in an uptrend during consecutive days of positive Market Signal values
📉 QQQ is considered to be in a downtrend during consecutive days of negative Market Signal values
See full screen chart -> www.tradingview.com

An Urgent Warning to ALL Traders & InvestorsWhat in the world just happened to the market today? NASDAQ:QQQ AMEX:SPY AMEX:IWM
That’s exactly what we’re breaking down—calmly, logically, and from an investor’s perspective.
In this video, I walk through the major indexes ( NASDAQ:QQQ , AMEX:SPY , and AMEX:IWM ) across multiple timeframes to explain the pullback, what *could* be driving it (macro fears, rates, inflation/GDP concerns), and the two paths the market may take next.
We also cover the VIX spike (but still at relatively low levels), COR3M/market stress, and what I’m seeing in crypto (BTC and ETH) as part of the broader “risk-on/risk-off” puzzle.
The key takeaway: this is a choppy “kangaroo market.” I lay out the bullish bounce scenario vs. the bear structure scenario, and the specific levels that would confirm either direction—so you can stay prepared, not emotional.
Not Financial Advice - DYOR

MASSIVE RALLY OR MASSIVE CRASH...In this video we will talk about if the markets are in store for a MASSIVE RALLY OR MASSIVE CRASH...
NASDAQ:QQQ AMEX:SPY AMEX:IWM

QQQ Market Open PlaybookThe dominant structure from October-November is still up, but momentum has clearly rolled
Price is now below the anchored VWAP from the November high & hovering just above the VWAP from the November low
This is no longer trend-following territory
It’s range/distribution behavior unless reclaimed quickly
RSI ~mid-50s rolling down; stochastic deeply oversold & still pointing lower so downside pressure not yet exhausted
Failure to hold ~$608-$610 opens a measured move toward the $580-$585, which lines up with prior demand
Bias (4H) is neutral to bearish unless VWAP(high) is reclaimed & held
Rising wedge breakdown is clean & confirmed
The post-break retest failed near $615-$618
Price is below both anchored VWAPs & the VWAP(high) is now acting as resistance
Selling pressure increased on the breakdown, but follow-through has been orderly, not panicked, which suggests controlled distribution, not capitulation
RSI mid-30s & trending lower; stochastic pinned low so no bullish divergence
Bias (1H) is bearish continuation unless price reclaims ~$613-$615 with volume
Important nuance is that falling wedges only resolve bullish if they break with expansion & right now, volume is not expanding meaningfully
Double bottom attempt is structurally weak & 2nd low lacks momentum divergence confirmation
Price is chopping under VWAP(high), which caps upside attempts
1. Bullish (lower probability right now)
Hold $608-$610
Break & hold >$612
Target $615-$618 (VWAP(high) + prior supply)
2. Bearish (base case)
Lose $608
Quick acceptance below $602, then $595, with $580-$585 as the larger 4H objective
I’d reassess bearish bias if any 2 of the following occur,
Reclaim & hold anchored VWAP from November high
1H RSI reclaims >50 & 15m breakout with clear volume expansion
Until then, rallies look sell-able, not chase-able
Premarket at ~$608.50 is sitting on a decision level, not a support you can trust blindly
1. Bearish continuation (base case)
Short setup (preferred)
Price below both anchored VWAPs, post–rising-wedge breakdown, weak momentum
Entry $612-$615
VWAP(high) + prior breakdown shelf
Ideal entry is rejection, not strength
Stop (invalidation)
>$618.50 (15m close)
Above VWAP(high) + structure
Anything above here negates bearish structure
Targets
$608 - range low
$602-$600 - intraday liquidity
$585-$580 - 4H objective, anchored VWAP(low) + prior demand
What must be true
Rallies are overlapping and low-volume
VWAP(high) continues to reject
RSI fails to reclaim 50 on 1H
2. Countertrend Long (only if conditions trigger)
Long setup (reaction trade, not trend)
Entry on a hold of $608-$610 after confirmation
15m >$612
Volume expansion on breakout
No long if these 3 things don’t happen
Stop
<$607.80
Hard stop; no tolerance
Targets
$615.80-$618.00 (VWAP(high)/supply)
$620-$622 only if acceptance above VWAP(high)
This long is mean-reversion only so don't assume trend continuation unless price accepts above $618
3. High-timeframe (most important)
$608.00
Holding above = range still alive
Losing & accepting below = downside acceleration
If you see fast move below $608, failed reclaim within 1-2 candles (15m), then that’s continuation, not a fakeout
1. Bearish alignment
1H RSI <45
VWAP(high) overhead
15m bounces on declining volume
2. Bullish shift (requires confirmation)
1H RSI >50
VWAP(high) reclaimed and held
15m breakout with volume > prior average
No divergence = no guessing


QQQ Trading Opportunity! SELL!
My dear followers,
This is my opinion on the QQQ next move:
The asset is approaching an important pivot point 617.26
Bias - Bearish
Safe Stop Loss - 620.93
Technical Indicators: Supper Trend generates a clear short signal while Pivot Point HL is currently determining the overall Bearish trend of the market.
Goal - 611.35
About Used Indicators:
For more efficient signals, super-trend is used in combination with other indicators like Pivot Points.
Disclosure: I am part of Trade Nation's Influencer program and receive a monthly fee for using their TradingView charts in my analysis.
———————————
WISH YOU ALL LUCK

QQQ (19 December)As long as QQQ holds $612, downside risk is fading & acceptance above $618 turns this from a bounce into a base
Higher lows are forming from ~$600 to ~$612-$615
Price is holding above reclaimed value ($612-$615) across time frames
This invalidates the immediate bearish breakdown scenario
RSI is bullish continuation momentum, not mean-reversion
Stoch is overbought on lower time frames, but it's not a sell signal unless price breaks support
Momentum is supporting price, not diverging against it
Volume expansion on the push through $612
No heavy sell-volume on pauses
This is controlled buying, not short covering only which boosts the strength of the bounce
1. $615 is now critical support & must hold on pullbacks
If price holds $615, the market is building a base
2. Expect chop at $618-$620
Rejection only matters if price falls back below $615
3. $625
If $620 breaks with acceptance, price likely moves here quickly
This would strongly favor a bullish continuation
4. Loss of $615, then loss of $612 would put price back into balance/chop - not yet trend failure, but bad for short-dated calls
As long as $615 holds, staying bullish is justified
The market has shifted from risk of a bounce failure to building a base
Bears lost control at $612
Bulls need $620+ to fully take it back
Now it’s about whether momentum follows through quickly enough

Megaphone price action expectationBounce up to Christmas, correct for all of Q1 (correction ending in March), bounce up for a good Q2, then Q3 brings the pain
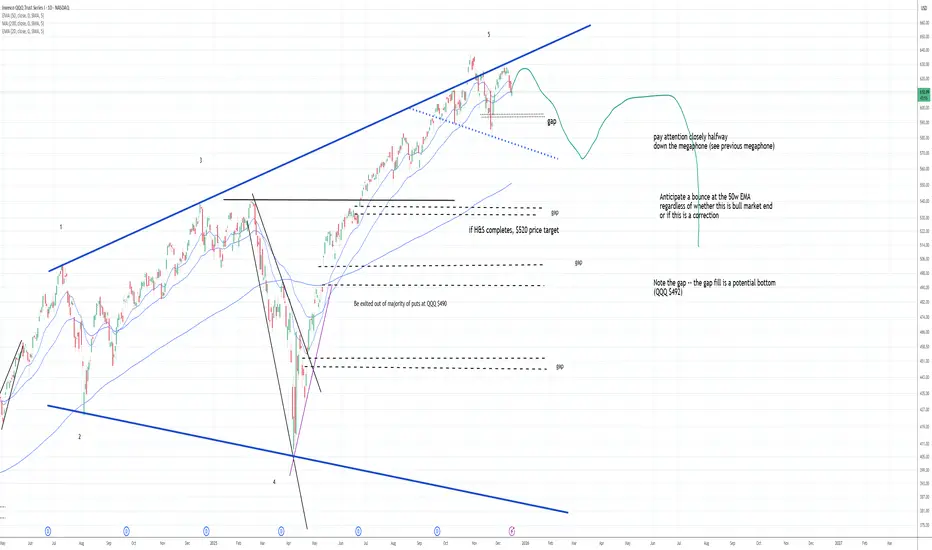
QQQ Two optionsThey're currently retesting this move to the high but its already been tested, could hold this second time around after the regain. If it fails expect new lows sub 588
TrenVantage LITE plotting trends

QQQ (US100 – USTECH – NQ) WEEKLY PREDICTION - (08 DEC)QQQ (US100 – USTECH – NQ) WEEKLY PREDICTION
📊 Market Sentiment
Market sentiment remains bullish, supported by expectations of a potential FED rate cut in December.
Additionally, Trump’s likely nominee for the next FED Chair Kevin Hassett, a strong advocate of aggressive rate cuts has strengthened this bullish outlook.
Markets have already begun pricing in the possibility of earlier and more aggressive cuts throughout 2026, fueling continued upside momentum.
📈 Technical Analysis
QQQ is strongly bullish at the moment.
In my opinion, as long as SPY continues pushing toward all time highs, QQQ is unlikely to experience any meaningful retracement.
📌 Game Plan – Prediction
I expect QQQ to reach 629 this week at minimum.
A strong move may occur right after the market opens however, since the FED decision will be released on Wednesday, the early part of the week may show some choppy or ranging price action.
💬 For deeper sentiment and strategy insights, subscribe to my Substack free access available.
⚠️This analysis is for educational purposes only and does not constitute financial advice. Always conduct your own research before trading or investing.
Going long on qqqGoing long on qqq today. It tapped into the fair value gap and got a strong buy signal from my algorithm. I am targeting the recent highs with a stop below the strong bullish candle.

WEEKLY QQQ (NQ-US100-USTECH) Outlook - Prediction (14 DEC)WEEKLY QQQ (NQ-US100-USTECH) Outlook - Prediction (14 DEC)
📊 Market Sentiment
Market sentiment has turned slightly bullish again following the FED’s rate cut decision. We saw the market react quickly after Powell’s speech. QE has restarted, and the FED stated it will buy $40 billion of Treasury bills over the next 30 days. This narrative supports the bullish case; however, $40B is relatively small compared to the overall size of the U.S. market.
At the same time, the bearish narrative is strengthening. Powell stated that “rates are now in a plausible range of neutral,” and the FED emphasized that it will assess incoming data until the January meeting. No decision has been made for January yet.
This keeps the market in a state of uncertainty and when the market lacks a clear narrative, it often turns bearish. Keep this in mind.
📈 Technical Analysis
QQQ hit the 629 level, as I pointed out last week. I am linking last week’s QQQ prediction below for reference.
Price ran the 629 level but could not close above it. After that, we saw selling pressure due to SPY and YM hitting all time highs and getting rejected. QQQ was the weaker index last week, which explains why we did not expand as much as SPY and why QQQ failed to reach all time highs.
I believe the expansion higher will resume, but first price needs to gather more energy before continuing upward.
📌 Prediction – Outlook
I am tracking three different scenarios:
Scenario 1 (Black Line) – Bullish:
Price runs the 610.5 level and closes above it. If this occurs, I will be buying calls, targeting 617.5 first, with a runner for higher levels.
Scenario 2 (Orange Line):
Price retraces to 610.5 and closes below, creating a deeper pullback. Price then reaches 605.5 and closes back above it. This would likely initiate bullish momentum.
In this case, I would be buying calls, targeting 610.5 first and 617.5 as the second target.
Scenario 3 (Red Line) – Bearish:
Price retraces to 610.5 and aggressively closes below. Price then continues lower toward 597.5 without showing strength.
If price later closes back above 597.5, I will look to buy calls.
Initial profit targets would be 605.5 and 610.5.
💬 For detailed insights and broader market context, please check my Substack link in profile.
For educational purposes only. This is not financial advice.

QQQ Implied Move RangeQQQ's implied expected move is calculated using the current option chain to find the ATM straddle (cost of ATM call + ATM put for nearest expiry)
Expected Move (≈ 1σ) ≈ $0.85 × (ATM Straddle Premium)
The result gives a one-standard-deviation range (≈ 68% probability) for the underlying’s move over the option’s life
For a short horizon (“by tomorrow”), pick the front-month (or nearest-term) options that expire soon & use their straddle; alternatively, use annualized implied volatility (IV) converted to daily/weekly via the standard volatility-scaling formula
Move = S × IV × SQRTΔ t /365
Where S = underlying price & Δ t = number of days to expiry
This yields a symmetric “+/-” band, but it does not forecast direction - only the magnitude (volatility expectation)
The front-month or nearest options typically price in a short-term move of roughly +/-1% to +/-1.5% around the current price, ~$625, which suggests a likely trading range for tomorrow of roughly $618 to $634 (-1% to +1.5%)
The implied move is derived from option-markets’ aggregated expectations - it doesn’t tell you direction
Actual price can & often does, break outside the straddle-implied band; especially, if there's a surprise (Fed tone, macro data, headlines)
The implied move reflects volatility pricing
If implied volatility collapses (after the event), realized moves may be smaller
If IV remains elevated or rises, moves may exceed the band
The “+/-1%-1.5%” range is a typical result for front-month options under normal volatility
In a “event week” (like FOMC), implied volatility can be distorted, meaning the real move could be larger, or the band may understate risk
Use the $618-$634 band as a “probability envelope”
Markets seem to expect QQQ to stay somewhere in that range under “normal” conditions
If you expect a dovish surprise - the upper half (near $629-$634) is reasonable
If you expect a hawkish or cautious tone - then the lower half (near $620–$618) is better
If you expect a major surprise or risk-off - plan for possible breakouts beyond that band (to either side)
1. FOMC 27 July 2022
QQQ closed @ $306.81 the day before FOMC
1 day close was $309.81
3 day close was $315.27
Actual 1 day move was +0.98%
Actual 3 day move was +2.76%
The 1 day move stayed within the typical implied move (~+/-1-1.5%)
The 3 day move exceeded the common expected-move envelope (~+/-2-3%), driven by a surprise dovish tone
2. FOMC 14 December 2022
QQQ closed @ $297.50 the day before FOMC
day close was $285.94
3 day close was $268.60
Actual 1 day move was -3.9%
Actual 3 day move was -9.7%
This massively exceeded the typical implied move band
Implied range around that meeting was ~+/-1.5-2% & the realized move was far greater
Powell pushed back on easing conditions
3. FOMC 22 March 2023
QQQ closed @ $305.00 the day before FOMC
1 day close was $309.42
3 day close was $315.57
Actual 1 day move was +1.45%
Actual 3 day move was +3.47%
The 1 day move landed right inside the expected band
The 3 day move pushed to the upper edge or slightly beyond the common ~+/-3% implied envelope
A mild dovish shift + banking-crisis risk-off reversal supported tech
1. QQQ usually stays within the implied move on Day 1
Roughly +/-1–1.5% is historically typical
Breaks above +/-2% tend to occur only on strong surprises
2. QQQ frequently breaks the implied move by Day 3-5
The 3-5 day window often includes volatility expansion, trend continuation if the Fed surprises & mean-reversion if the first move was emotional
3. Surprises create the largest deviations
Hawkish surprises are the biggest downside breaches (December 2022)
Dovish surprises are sizable upside breaches (July 2022)
4. Base-case FOMC outcomes generally stay within the implied band
Typical outcomes settle into the +/-1-1.5% Day 1 move, but still tend to fade over 3-5 days
Around 70-80% of the time, QQQ stays within a “1σ” band after FOMC
20-30% of the time, it breaks out with a big move (usually driven by a surprise)
The 3 day window is actually slightly more prone to exceed the band than 1 day or 5 day
This suggests that 3-5 sessions after FOMC is where the real repricing happens
🕊️ Dovish
Day 1 +0.5% to +1.5%
Day 3 +1% to +3% if the narrative sticks
Day 5 some giveback is common = net +0.5% to +2%
🧸 Base Case (“hawkish cut”/cautious)
Day 1 –0.5% to +0.5% (within 1σ band)
Day 3 drift –0.5% to –1.5%
Day 5 further mild weakness = total -1% to -2.5%
🦅 Hawkish
Day 1 -1% to -2.5% (near or beyond 1σ band)
Day 3 -2% to -4% total
Day 5 is either stabilization or a small overshoot lower = –3% to –5% total in a stronger shock
Something like the base-case band happens ~70-80% of the time
A true “shock” move (outside band, +/-3–5%) occurs roughly 1 in 4 to 1 in 5 meetings
Directionally, given current positioning yield re-steepening + QQQ’s extension, I’d assign higher odds of a base or mildly hawkish outcome, so statistically, the 3-5 day fade is still my default
The 3-5 session window is where the bigger, more directional, macro-driven moves happen
In the current macro setup, the bias is toward the base/mildly hawkish path, which historically lines up with a contained Day 1 move, then a drift lower over the following 3-5 sessions
+/-1.5% (1 day)
Upside $625 × 1.015 ≈ $634
Downside $625 × 0.985 ≈ $616
+/-3% (bigger, 3-5 day)
Upside $625 × 1.03 ≈ $644
Downside $625 × 0.97 ≈ $606
+/-5% (shock/tail scenario)
Upside $625 × 1.05 ≈ $656
Downside $625 × 0.95 ≈ $594
1. If we close >$634, it nudges into “strong dovish” territory & day 3-5, holding above $625-$630 keeps the “wave 5 extension” idea alive; even then, a later retest of $620-$625 is typical behavior
2. A drift toward $608-$615 lines up with historical negative median returns & if QQQ breaks below ~$615 & closes there on Day 3-5, odds increase that we’re in bigger corrective territory, not just a quick shakeout
QQQ (12 December)A ±3% envelope around the 20d MA does 3 important things
1. Upper band
Marks short-term trend extension
Rallies that fail from here often lead to multi-week digestion
2. 20d MA
Control line for short-term trend
Chop around it = balance, not resolution
3. Lower band (~-3%)
Where momentum resets actually complete
Where successful Santa rallies most often launch
Price is slightly below the 20d MA & still well above the −3% band
Recent selloffs have tagged the 20d MA, but not the lower band & that tells us that the reset is in progress, but not finished
When Santa rallies succeed, price either 1) touches or briefly pierces the −3% band, then reclaims the 20d MA OR 2) spends enough time between midline & lower band that volatility collapses
The key is whether sellers are forced to exhaust themselves & that exhaustion point lines up with ~$590-$600
The cleanest sequence for a high-quality Santa set-up is that price drifts/flushes into the −3% band & we see long lower wicks, smaller red bodies, failed follow-through on down days & price reclaims the 20d MA since Santa rally starts from inside value, not above it
This leads to grind higher quietly, carry into early January & avoid sharp January reversals
A weak or fake Santa rally happens when price never touches the −3% band
Rallies start from above the 20d MA, upper band is hit quickly & momentum rolls again in early January
The chart still argues for at least one push toward the lower band (~$590s) before a durable Santa rally - not because Santa can’t happen without it, but because momentum has not been fully neutralized & the market hasn’t forced capitulation from late longs
Santa-ready = price has touched the −3% band & reclaimed the 20d MA
Not Santa-ready = price still oscillating above the lower band
This ±3% / 20d MA view confirms everything from the weekly MACD
It visually explains why $590-$600 keeps showing up
Santa rallies that start after a lower-band test are stronger & last longer
Santa rallies that start before it are more fragile
The weekly MACD is saying that momentum is rolling, not reversing &
in strong bull markets, this exact MACD behavior typically resolves via price moving sideways-to-down until momentum resets & the trend continues - not how a major top appears
The MACD is not deeply negative which argues against panic-style selling, but it does demand time or price, or both
The weekly MACD does not resolve with a quick bounce to $625, or a shallow 2-3% dip
It usually resolves with a 5-8% pullback, or several weeks of chop
From the ~$637 high
5% ≈ $605
6-7% ≈ $595 to 590
Which lines up exactly with weekly 20 MA & prior breakout structure
Structure strongly favors price visiting ~$590 since that actually resets momentum
The weekly trend is bullish & weekly momentum is resetting
Daily structure is corrective, 4H AVWAPs suggest balance & the 1H wedge pattern is a short-term pressure
When all of those align, the most common resolution is drift/chop to a test of $590-$600, consolidate a base & rally
A $620-$625 bounce can still happen inside that process, but it’s secondary, not required
Test $590s, then base ~55% (base case)
Chop $600-$620, no resolution ~25%
ATHs without touching $590 ~15%
Sharp breakdown below $580 ~5%
The weekly MACD confirms a reset is underway & that reset most cleanly completes near $590-$600
A $620-$625 bounce is optional, not necessary
Any move into $590-$600 that holds weekly structure is bullish, not bearish
The higher-probability outcome is a test of the $590s before any Santa-rally-style push to new highs
Historically, QQQ does not print new ATHs while weekly momentum is actively resetting since that reset almost always completes before the seasonal tailwind expresses itself
So if there is a Santa rally, it’s far more likely to start from lower prices, not launch from mid-reset levels
A move into the $590s completes a 5-7% pullback, resets weekly momentum cleanly, flushes late longs & sets up positioning for a late-December/early-January run
This sequence aligns perfectly with typical late-year behavior
Santa rallies that actually stick, not fail
Markets prefer to rally from fear, not from complacency
The one thing that would flip this quickly is if & only if price closes on the daily above $625, followed by strong acceptance
Seasonality is subordinate to structure
The market is resetting, not breaking
Santa rally odds improve after a dip, not before
$590s before ATHs is the cleaner, more durable path
Any dip into the $590s that holds weekly structure is bullish fuel, not danger
This SMH/QQQ ratio chart is the missing piece & it materially tilts the odds toward the base case
The ratio is still in a clear uptrend, it's above its rising MA, so long-term structure is higher highs, higher lows, which means semiconductors are still outperforming QQQ on a medium-term basis, so despite the AVGO-driven selloff, leadership has not broken & that matters a lot
The pullback is a mean-reversion, not a regime change
In strong markets, relative strength pulls back to the MA, then either consolidates & resumes higher, or rolls over decisively (which has not happened)
Semis are ~40% of QQQ’s momentum contribution
QQQ rarely makes a sustained leg lower without semis underperforming
The ratio holding implies any QQQ downside is corrective & not the start of a broader drawdown
That supports bounce attempts, shallow-to-moderate retraces & defense of higher MAs (50d & 100d MA)
This slightly changes the probability weights in my opinion vs a $590 test as highest single outcome
Bounce to $620-$625, stall ~45%
Bounce & range $615-$630 (no immediate $590) ~25%
Breakdown to $590 test ~20%
Breakout & reclaim $632+ ~10%
So $590 is still very much in play, but it is less inevitable than it looked without the ratio & this is exactly why relative strength matters
The $590 test would be much more likely if SMH/QQQ closes below its MA & then fails to reclaim it within ~3-5 sessions
If that happens semis stop leading & QQQ likely seeks the 100d MA (~$590-$596)
If ratio stabilizes and turns up, QQQ holds above $610, then the $625 test becomes constructive, not corrective
I believe this ratio shows that the cause (profit-taking) is validated, the damage is contained & that the sequence still favors bounce, consolidation/decision & either delayed ATHs or a shallow reset
What it argues against is an immediate waterfall to $590
The SMH/QQQ ratio says leadership is intact
That reduces (does not eliminate) the odds of an immediate $590 flush
A bounce toward $620-$625 is now even more likely
The next decision happens at $625, not $590; unless, semis lose relative strength
CPI & NFP next week are much more likely to affect intraday volatility than weekly direction since they are unlikely to invalidate the $590-$600 reset thesis unless the data meaningfully re-prices the rate path, which Powell explicitly tried to prevent so treat CPI/NFP days as liquidity events & not trend confirmation days
Powell effectively said Don’t overreact to individual prints - policy is about the trend
Watch where price closes, not the spike
If the market uses data to explore lower value & then fails to continue, that’s bullish
If it uses data to bounce, but cannot reclaim key levels, the reset continues
The data does not replace the technical process - it only colors it

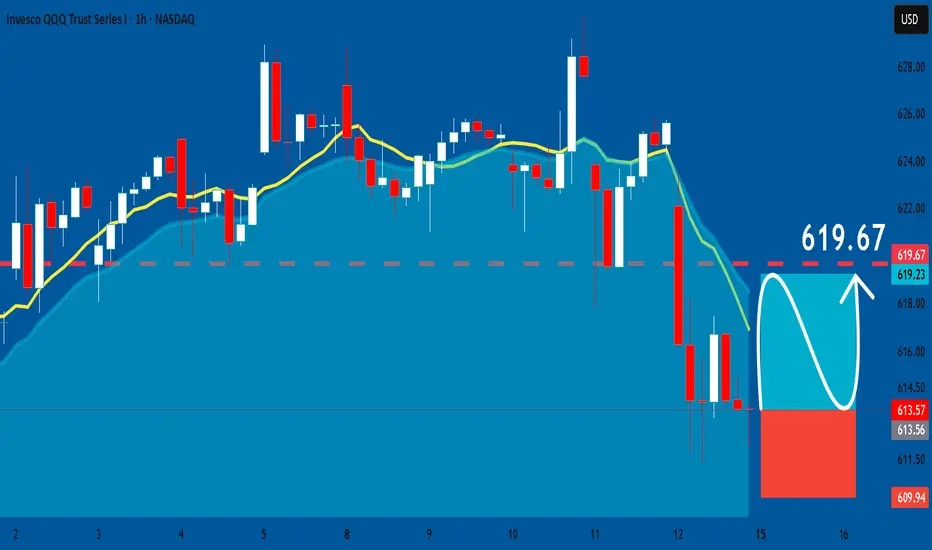
QQQ: Long Trading Opportunity
QQQ
- Classic bullish pattern
- Our team expects retracement
SUGGESTED TRADE:
Swing Trade
Buy QQQ
Entry - 613.57
Stop - 609.94
Take - 619.67
Our Risk - 1%
Start protection of your profits from lower levels
Disclosure: I am part of Trade Nation's Influencer program and receive a monthly fee for using their TradingView charts in my analysis.
❤️ Please, support our work with like & comment! ❤️
QQQ, Consolidation. Reversal, Continuation. All suggestions!(RED LINE) PREMARKET TOP OF DAY (TOD) price action refers to significant price movements and volume spikes in stocks before the 9:30 AM ET market open
-
(GREEN LINE) In premarket trading, the PREMARKET BOTTOM OF DAY price action refers to the lowest price a stock reaches during the extended-hours session (typically 4:00 AM to 9:30 AM ET)
-
(GREEN LINE & ZONE) An ASCENDING TREND LINE connecting the pre-market low and subsequent higher lows during the regular session is used by traders to identify an uptrend and potential support levels.
-
(RED LINE & ZONE) A DESCENDING TREND LINE connecting the premarket high and subsequent market session lower highs is a technical analysis indicator of persistent selling pressure, often forming part of a descending triangle pattern.
-
(BLUE LINE) The "PREVIOUS DAY'S HIGHEST PRICE" (PDH) is a key technical indicator showing the peak price of a stock or asset from the last trading session, used by traders for support/resistance levels, identifying breakouts (price moving above it), trend confirmation, and setting stop-loss/take-profit points
-
(BLUE LINE) The "PREVIOUS DAY'S LOWEST PRICE" (PDL) is the absolute minimum price a stock or security traded at during the last complete trading session, acting as crucial support for intraday traders to gauge market weakness or find bargain entry points
-
(YELLOW ZONE) The term "MARKET OPENING CANDLE" generally refers to the first candlestick that forms when a financial market opens for a new trading session (e.g., the first 5-minute candle of the day, or the daily candle for a new trading day). Traders use its characteristics and subsequent price action to gauge initial market sentiment and potential direction

QQQ (NQ-US100) Weekly Prediction – Outlook (21 DEC)QQQ (NQ-US100) Weekly Prediction – Outlook (21 DEC)
📊 Market Sentiment
Market sentiment turned fully bullish after the CPI data came in significantly lower than expected on Thursday. While the consensus expectation was 3.1%, the actual CPI print came at 2.7%, representing a meaningful downside surprise.
This data does not directly determine the outcome of the January FED meeting, as another CPI report will be released on January 13, 2026, which will be far more critical for the FED’s decision making process. However, the current soft inflation trend increased the probability of another lower CPI reading in January, which positively impacted risk sentiment across markets.
📈 Technical Analysis
Last week’s QQQ analysis played out perfectly. I hope you were able to capitalize on it. Price reversed precisely from the levels we anticipated following the CPI release. I am linking last week’s QQQ weekly analysis below for reference.
After the CPI data, price transitioned back into a clean bullish structure on both the daily and weekly timeframes. On Friday, QQQ rallied impulsively and closed the week with strong bullish momentum.
Overall, I think the market structure supports bullish continuation.
📌 Game Plan
I think QQQ may directly test 618.5 (Target 1) early in the week, followed by a move toward 625.75. These are the two bullish targets I expect to be reached within this week.
Price may also move toward these targets without any meaningful retracement. I plan to close one third of my call options at 618.5 and the remaining portion at 625.75 from the positions I am holding since Thursday.
If price pulls back to 611.75 or 607 before reaching 625.75 and prints strong 1H or 4H bullish candle closes, I will look to add new call option positions targeting 625.75.
In the event of a developing bearish structure, I will provide updates. However, at this stage, I do not see any clear bearish signals.
💬 For deeper sentiment and strategy insights, subscribe to my Substack free access available.
This analysis is for educational purposes only and does not constitute financial advice. Always conduct your own research before trading or investing.

Mean Reversion Setup: QQQ1. RSI in oversold region
2. Price likely to rebound back the the mean
Trade Rules:
Entry Trigger - RSI has cross below oversold region, enter limit buy at close price
Exit Trigger - Close at market when close price cross above exit trigger (Red Line)
Notes: Maximum of 3 open positions
Reading Market Intent vs Reacting to PriceMost traders react to price.
I focus on intent, the pressure that builds before price responds.
That philosophy is what the HIGHCREW Intelligence System is built around.
The RSI Scout Edition isn’t the engine.
It’s a simplified lens that highlights when momentum is expanding or stalling so intent becomes visible instead of reactive.
This is one layer of a broader intelligence framework — additional systems will be released over time.

Global Equity Markets Under Pressure: Causes and ConsequencesMacroeconomic Headwinds Driving Market Stress
One of the primary reasons global equities face pressure is the challenging macroeconomic backdrop. High inflation, tighter monetary policy, and slowing economic growth often converge to create an unfavorable environment for stocks. Central banks, led by the US Federal Reserve and followed by institutions such as the European Central Bank and the Bank of England, tend to raise interest rates to control inflation. While necessary, higher interest rates increase borrowing costs for businesses and consumers, reduce corporate profitability, and lower future earnings expectations. Since equity valuations are largely based on discounted future cash flows, rising rates directly weigh on stock prices.
In addition, uneven global growth adds to market uncertainty. While some economies show resilience, others struggle with weak consumption, declining exports, or fiscal constraints. China’s growth fluctuations, Europe’s energy-related challenges, and the cyclical slowdown in parts of the US economy collectively affect global investor confidence. When growth expectations fall, equity markets usually reprice lower.
Geopolitical Tensions and Global Uncertainty
Geopolitical developments play a major role in putting pressure on global equities. Conflicts, trade disputes, sanctions, and diplomatic tensions disrupt supply chains, increase commodity prices, and create uncertainty about future economic stability. Markets dislike uncertainty more than bad news; when the outlook becomes unclear, investors often reduce exposure to risk assets like equities and shift towards safer instruments such as bonds, gold, or cash.
Trade fragmentation and protectionist policies also impact multinational corporations. Many global companies rely on integrated supply chains and international markets for revenue growth. Any disruption or restriction increases costs and reduces margins, leading to downward revisions in earnings forecasts and, ultimately, lower stock prices.
Corporate Earnings Under Strain
Another key factor behind global equity pressure is the strain on corporate earnings. Rising input costs, higher wages, and expensive financing compress profit margins. Even companies with strong revenue growth may struggle to maintain profitability in such an environment. When quarterly earnings fail to meet expectations or forward guidance turns cautious, markets react swiftly and negatively.
Moreover, currency fluctuations add another layer of complexity. A strong US dollar, for example, can hurt companies that earn a significant portion of their revenue overseas, as foreign earnings translate into fewer dollars. Emerging market companies may also face higher debt servicing costs if they have dollar-denominated liabilities, further affecting profitability and investor sentiment.
Liquidity Tightening and Risk Appetite
Global equity markets thrive on liquidity. When central banks reduce liquidity through quantitative tightening or balance sheet reductions, the flow of easy money into financial markets slows down. Lower liquidity means fewer buyers at higher prices, making markets more sensitive to negative news. As a result, even small disappointments can trigger sharp corrections.
Risk appetite among investors also declines during such phases. Institutional investors, hedge funds, and retail participants become more selective, preferring quality stocks with strong balance sheets over speculative or highly leveraged companies. This shift often leads to broad market weakness, especially in high-growth sectors that depend heavily on future earnings.
Sectoral Impact and Market Rotation
Pressure on global equities does not affect all sectors equally. Technology and growth-oriented sectors are usually the most sensitive to rising interest rates because their valuations depend on long-term growth assumptions. Financials may face mixed outcomes, benefiting from higher interest margins but suffering from increased credit risk. Cyclical sectors such as metals, energy, and industrials often reflect concerns about slowing global demand.
At the same time, defensive sectors like healthcare, utilities, and consumer staples tend to outperform during periods of equity market stress. This sectoral rotation reflects investors’ attempts to preserve capital rather than chase high returns. However, even defensive stocks may not be immune if broader market sentiment turns deeply negative.
Emerging Markets and Capital Flows
Emerging market equities often experience amplified pressure during global risk-off phases. Capital tends to flow out of emerging economies and into developed markets perceived as safer. This outflow weakens local currencies, increases inflationary pressure, and forces central banks to maintain higher interest rates, further slowing economic growth.
Despite these challenges, emerging markets with strong fundamentals, improving reforms, and domestic demand-driven growth can show relative resilience. However, in the short term, global equity pressure usually leads to synchronized declines across most regions.
Investor Psychology and Market Volatility
Psychology plays a crucial role when global equities are under pressure. Fear, uncertainty, and negative headlines can create a self-reinforcing cycle of selling. As markets fall, investors worry about further losses and rush to exit positions, increasing volatility. Social media, algorithmic trading, and 24-hour news coverage amplify these reactions, making market moves sharper and faster than in the past.
However, such periods of stress also lay the groundwork for future opportunities. Valuations become more attractive, weak hands exit the market, and long-term investors can gradually accumulate quality assets at discounted prices.
The Road Ahead: Risks and Opportunities
While global equities remain under pressure, the future path depends on several key variables. Inflation trends, central bank policy decisions, geopolitical stability, and corporate earnings growth will determine whether markets stabilize or face further downside. Any sign of easing inflation, rate cuts, or improved global coordination can quickly boost investor confidence.
For investors, the focus should shift from short-term market noise to long-term fundamentals. Diversification across regions and asset classes, disciplined risk management, and patience become especially important during such phases. History shows that periods of equity market pressure, though uncomfortable, are a natural part of market cycles and often precede phases of recovery and growth.
Conclusion
Global equity markets under pressure reflect a complex mix of economic, political, and psychological factors. While the current environment may appear challenging, it is not unprecedented. Understanding the underlying drivers helps investors make informed decisions rather than emotional reactions. Ultimately, equity markets reward long-term discipline, and periods of stress often create the foundation for the next cycle of opportunity.

Hello trader, for today, QQQQ is at 609.01 in real-time pre-markwww.tradingview.com
A bullish entry would be above 616.00 with a possible projection to the 628.00 area. Otherwise, our bearish entry should be below 606.00, potentially reaching the 600.00 area, which could be a reversal zone. Today is Friday, so we must be cautious of market traps. Have a good trading day.
