Hello trader, for today, QQQQ is at 609.01 in real-time pre-markwww.tradingview.com
A bullish entry would be above 616.00 with a possible projection to the 628.00 area. Otherwise, our bearish entry should be below 606.00, potentially reaching the 600.00 area, which could be a reversal zone. Today is Friday, so we must be cautious of market traps. Have a good trading day.
Market insights

Pitchfork upMarket should bounce here. Pitchfork analysis confirmed but multiple bounces. Inside pitchforks using the legs in February 2025, April 2025, October 2025, and November 2025

Qs HedgeQQQ is at make or break if it does not hold 600 I'm my option
I'm still favoring long if until next month
But possible hedge play on retrace

QQQ mid-term TANasdaq uptrend is still not fully restored, and it's having a negative trampoline move, the recent pump is overbought on indicators, watch out for the correction in the near future.
If SMA50 test won't be successful then it may go down to test the previous lows again, watch the blue line as a pivot for the support.

Santa coming? possible Inverse H&Scould be one more flush then get everyone chasing for year end rally!!! expect chasing same names that got sold..

Inverted Cup and HandleLooking at bouncing off of the .5 retracement fib level and back up a bit, likely to match local high before sell off. Handle might be from low volume 'Santa Claus rally' due to retailers pumping it a bit. Wait and see but might be a good place to go long here as long as CPI doesn't shit the bed, which it won't.

QQQ Year end target - 575Calling the top has not worked. But this time it looks different. Thesis is that all the news is baked in. Need some year end profit taking.

RSI Beta Test Access (Invite-Only)I’m opening a limited beta test for my upgraded RSI V2 indicator, built specifically for scalpers and intraday traders who want earlier confirmation and cleaner momentum reads.
If you’d like free access during the beta phase and can provide feedback, send me a DM here on TradingView and I’ll add you to the invite-only list.
This version will remain private while it’s being tested.
Thanks in advance to everyone who participates.

$QQQ Update & Charting"My 5 year plan for NASDAQ's ETQ (QQQ)" Update:
Nasdaq's ETF NASDAQ:QQQ , has a historic support on the weekly 200 Moving average (MA) as shown as the dark blue line-indicator. I will do a brief TA breakdown of the indicators, charting & future steps.
At point (A), we visualize the start of a zone-block & trendline rejection zones, which will later become a breakout point and wick support on point (B) in pair with a 200 MA indicator support zone. Now at point (B), we also see the same 200 MA indicator support zone, followed by a previous support zone-block visualized by a left arrow. Finally on point (C), we observe price action find support at point A's zone-block & MA zone, after rejection by 50 MA.
What to expect:
After APR 25, we see bullish price action and can expect to hit 'target', calculated by FIB retracements. We are visualizing this chart to foresee bearish price action that will trigger buy-limits at both buy zones (555.60-493.80), with a trailing stop-loss at 388.00, being activated at 400.00-407.00 zone-block.
Indicators & Tools: 200 & 50 SMA, FIB RETRACEMENT (-0.618, -27, 0, 0.5, 0.618, 0.786, 1), rectangle (support/resistance/buy-zone) & trendline.
Below is the link to the original idea.

QQQ Implied Move RangeQQQ's implied expected move is calculated using the current option chain to find the ATM straddle (cost of ATM call + ATM put for nearest expiry)
Expected Move (≈ 1σ) ≈ $0.85 × (ATM Straddle Premium)
The result gives a one-standard-deviation range (≈ 68% probability) for the underlying’s move over the option’s life
For a short horizon (“by tomorrow”), pick the front-month (or nearest-term) options that expire soon & use their straddle; alternatively, use annualized implied volatility (IV) converted to daily/weekly via the standard volatility-scaling formula
Move = S × IV × SQRTΔ t /365
Where S = underlying price & Δ t = number of days to expiry
This yields a symmetric “+/-” band, but it does not forecast direction - only the magnitude (volatility expectation)
The front-month or nearest options typically price in a short-term move of roughly +/-1% to +/-1.5% around the current price, ~$625, which suggests a likely trading range for tomorrow of roughly $618 to $634 (-1% to +1.5%)
The implied move is derived from option-markets’ aggregated expectations - it doesn’t tell you direction
Actual price can & often does, break outside the straddle-implied band; especially, if there's a surprise (Fed tone, macro data, headlines)
The implied move reflects volatility pricing
If implied volatility collapses (after the event), realized moves may be smaller
If IV remains elevated or rises, moves may exceed the band
The “+/-1%-1.5%” range is a typical result for front-month options under normal volatility
In a “event week” (like FOMC), implied volatility can be distorted, meaning the real move could be larger, or the band may understate risk
Use the $618-$634 band as a “probability envelope”
Markets seem to expect QQQ to stay somewhere in that range under “normal” conditions
If you expect a dovish surprise - the upper half (near $629-$634) is reasonable
If you expect a hawkish or cautious tone - then the lower half (near $620–$618) is better
If you expect a major surprise or risk-off - plan for possible breakouts beyond that band (to either side)
1. FOMC 27 July 2022
QQQ closed @ $306.81 the day before FOMC
1 day close was $309.81
3 day close was $315.27
Actual 1 day move was +0.98%
Actual 3 day move was +2.76%
The 1 day move stayed within the typical implied move (~+/-1-1.5%)
The 3 day move exceeded the common expected-move envelope (~+/-2-3%), driven by a surprise dovish tone
2. FOMC 14 December 2022
QQQ closed @ $297.50 the day before FOMC
day close was $285.94
3 day close was $268.60
Actual 1 day move was -3.9%
Actual 3 day move was -9.7%
This massively exceeded the typical implied move band
Implied range around that meeting was ~+/-1.5-2% & the realized move was far greater
Powell pushed back on easing conditions
3. FOMC 22 March 2023
QQQ closed @ $305.00 the day before FOMC
1 day close was $309.42
3 day close was $315.57
Actual 1 day move was +1.45%
Actual 3 day move was +3.47%
The 1 day move landed right inside the expected band
The 3 day move pushed to the upper edge or slightly beyond the common ~+/-3% implied envelope
A mild dovish shift + banking-crisis risk-off reversal supported tech
1. QQQ usually stays within the implied move on Day 1
Roughly +/-1–1.5% is historically typical
Breaks above +/-2% tend to occur only on strong surprises
2. QQQ frequently breaks the implied move by Day 3-5
The 3-5 day window often includes volatility expansion, trend continuation if the Fed surprises & mean-reversion if the first move was emotional
3. Surprises create the largest deviations
Hawkish surprises are the biggest downside breaches (December 2022)
Dovish surprises are sizable upside breaches (July 2022)
4. Base-case FOMC outcomes generally stay within the implied band
Typical outcomes settle into the +/-1-1.5% Day 1 move, but still tend to fade over 3-5 days
Around 70-80% of the time, QQQ stays within a “1σ” band after FOMC
20-30% of the time, it breaks out with a big move (usually driven by a surprise)
The 3 day window is actually slightly more prone to exceed the band than 1 day or 5 day
This suggests that 3-5 sessions after FOMC is where the real repricing happens
🕊️ Dovish
Day 1 +0.5% to +1.5%
Day 3 +1% to +3% if the narrative sticks
Day 5 some giveback is common = net +0.5% to +2%
🧸 Base Case (“hawkish cut”/cautious)
Day 1 –0.5% to +0.5% (within 1σ band)
Day 3 drift –0.5% to –1.5%
Day 5 further mild weakness = total -1% to -2.5%
🦅 Hawkish
Day 1 -1% to -2.5% (near or beyond 1σ band)
Day 3 -2% to -4% total
Day 5 is either stabilization or a small overshoot lower = –3% to –5% total in a stronger shock
Something like the base-case band happens ~70-80% of the time
A true “shock” move (outside band, +/-3–5%) occurs roughly 1 in 4 to 1 in 5 meetings
Directionally, given current positioning yield re-steepening + QQQ’s extension, I’d assign higher odds of a base or mildly hawkish outcome, so statistically, the 3-5 day fade is still my default
The 3-5 session window is where the bigger, more directional, macro-driven moves happen
In the current macro setup, the bias is toward the base/mildly hawkish path, which historically lines up with a contained Day 1 move, then a drift lower over the following 3-5 sessions
+/-1.5% (1 day)
Upside $625 × 1.015 ≈ $634
Downside $625 × 0.985 ≈ $616
+/-3% (bigger, 3-5 day)
Upside $625 × 1.03 ≈ $644
Downside $625 × 0.97 ≈ $606
+/-5% (shock/tail scenario)
Upside $625 × 1.05 ≈ $656
Downside $625 × 0.95 ≈ $594
1. If we close >$634, it nudges into “strong dovish” territory & day 3-5, holding above $625-$630 keeps the “wave 5 extension” idea alive; even then, a later retest of $620-$625 is typical behavior
2. A drift toward $608-$615 lines up with historical negative median returns & if QQQ breaks below ~$615 & closes there on Day 3-5, odds increase that we’re in bigger corrective territory, not just a quick shakeout
Technologies and Innovations in the Global Market1. Digital Transformation and Industry 4.0
One of the most significant technological trends in the global market is digital transformation, often encapsulated under the concept of Industry 4.0. This term refers to the integration of digital technologies, the Internet of Things (IoT), artificial intelligence (AI), robotics, and big data analytics into industrial processes. By connecting machines, systems, and data, businesses can optimize production, improve efficiency, and reduce costs.
In manufacturing, smart factories equipped with sensors and AI-driven analytics allow real-time monitoring of operations, predictive maintenance of machinery, and adaptive production lines. These innovations enable companies to respond rapidly to market changes, reduce waste, and customize products according to consumer preferences, a trend known as mass personalization.
2. Artificial Intelligence and Machine Learning
Artificial intelligence has become a central pillar of innovation across multiple sectors. Machine learning, natural language processing, and computer vision technologies are being deployed in industries ranging from finance and healthcare to retail and logistics.
In finance, AI algorithms assist in fraud detection, risk assessment, and automated trading. Healthcare benefits from AI-powered diagnostic tools, predictive analytics for patient care, and drug discovery processes accelerated through computational models. Retailers leverage AI for personalized marketing, demand forecasting, and inventory management. The integration of AI into daily operations has enabled companies to make data-driven decisions faster and with greater accuracy.
3. Blockchain and Decentralized Systems
Blockchain technology, initially associated with cryptocurrencies, has evolved into a transformative innovation for the global market. It provides a secure, transparent, and decentralized way to record transactions, which is particularly valuable for supply chain management, finance, and digital identity verification.
For instance, in the supply chain sector, blockchain allows stakeholders to track products from origin to consumer, ensuring authenticity and reducing the risk of counterfeiting. Financial institutions use blockchain to facilitate cross-border payments more efficiently and with lower costs, bypassing traditional intermediaries. Additionally, smart contracts — self-executing contracts on blockchain networks — are revolutionizing legal, real estate, and business agreements by automating enforcement.
4. Internet of Things (IoT) and Connectivity
The proliferation of IoT devices has connected the physical and digital worlds in unprecedented ways. Sensors embedded in everyday devices—from industrial machinery to home appliances—generate massive amounts of data that can be analyzed to optimize performance, predict failures, and enhance user experiences.
Smart cities are emerging globally, powered by IoT infrastructure that manages traffic, energy, water supply, and waste systems efficiently. In agriculture, precision farming relies on IoT devices to monitor soil health, weather conditions, and crop growth, enabling higher yields and sustainable practices. The expansion of 5G networks further accelerates IoT adoption by providing high-speed, low-latency connectivity, making real-time applications more feasible and scalable.
5. Renewable Energy and Sustainable Technologies
Innovation in renewable energy technologies has become a crucial driver of global market dynamics. Solar, wind, hydro, and bioenergy innovations are reshaping the energy sector, making it more sustainable and economically viable.
Technological advancements in solar panel efficiency, battery storage, and grid management are reducing dependency on fossil fuels. Companies are investing in green hydrogen, carbon capture, and smart energy management systems to align with environmental regulations and meet the growing demand for clean energy. Sustainable innovations not only reduce environmental impact but also create new business opportunities in carbon trading, energy-efficient construction, and electric mobility.
6. Fintech Innovations
Financial technology, or fintech, has revolutionized the global financial market by providing digital alternatives to traditional banking and financial services. Mobile banking apps, digital wallets, peer-to-peer lending platforms, and robo-advisors are making financial services more accessible, faster, and cheaper.
Blockchain and AI technologies are particularly influential in fintech, enabling secure digital payments, real-time credit scoring, and automated investment management. In emerging markets, fintech solutions are bridging the financial inclusion gap, allowing unbanked populations to participate in the economy, transfer funds, and access credit with minimal friction.
7. Biotechnology and Healthcare Innovation
The biotechnology sector is another major area of global technological innovation. Advances in genomics, bioinformatics, and molecular biology are transforming healthcare, agriculture, and environmental management.
In medicine, breakthroughs in gene editing technologies like CRISPR have opened doors for treating genetic disorders. Personalized medicine, driven by genomics and AI, enables treatments tailored to individual patient profiles, improving outcomes and reducing side effects. Additionally, innovations in telemedicine, wearable health devices, and remote monitoring are redefining patient care, especially in areas with limited access to healthcare infrastructure.
8. E-commerce and Digital Platforms
The growth of e-commerce platforms has reshaped global trade and consumer behavior. Innovations in digital payment systems, logistics optimization, and AI-powered recommendation engines have made online shopping seamless, personalized, and efficient.
Global giants in e-commerce and emerging platforms in regional markets have expanded reach, enabling small and medium enterprises to access international markets with minimal upfront costs. The rise of omnichannel strategies, integrating online and offline sales experiences, further reflects the transformative impact of technology on retail and consumer engagement.
9. Autonomous Systems and Robotics
Autonomous systems, including drones, self-driving vehicles, and industrial robots, are driving efficiency and innovation in logistics, transportation, and manufacturing. Drones are used for surveillance, delivery services, and agricultural monitoring. Autonomous vehicles promise safer and more efficient transportation networks, while collaborative robots (cobots) work alongside humans in factories to improve productivity.
These technologies reduce labor-intensive tasks, minimize errors, and enhance operational scalability, enabling businesses to respond faster to market demand while reducing costs.
10. Future Outlook and Challenges
While technological innovation propels the global market forward, it also brings challenges such as cybersecurity risks, data privacy concerns, and workforce displacement due to automation. Governments, businesses, and educational institutions are increasingly focused on developing regulatory frameworks, reskilling programs, and ethical guidelines to ensure technology benefits society broadly.
Looking ahead, emerging technologies like quantum computing, extended reality (XR), and synthetic biology hold the potential to further disrupt global markets. Companies that invest in innovation, adapt rapidly, and embrace digital ecosystems are likely to gain competitive advantage, while traditional players face pressure to evolve or risk obsolescence.
Conclusion
Technologies and innovations have become the engines driving growth, efficiency, and competitiveness in the global market. From AI and IoT to renewable energy and biotech, the integration of advanced technologies across industries is creating new business models, enhancing productivity, and transforming consumer experiences. However, the pace of innovation also demands careful consideration of ethical, social, and economic implications. In the coming decades, the ability of nations and businesses to harness these innovations responsibly will define their position and success in the global economic landscape.
December 8 - December 12 2025: Disappointment ImminentThe market has not changed too much since last week, where my assessment that the market was in a neutral state turned out to be mostly accurate. I’m continuing to refine my analysis so I have changed some things heading into this week which should help provide even clearer signals. With the rate decision in focus, it will be important to consider the implications that a cut (which I am biased towards) vs unchanged rates will have on these indicators, as it will likely make the difference between the market continuing its bullish trend to end the year or if equities will continue to feel pressure from high interest rates and a slowing economy.
1. Macro
Here we are seeing low demand for treasuries TVC:US10 and the dollar TVC:DXY while bond and equity put hedging has been unwinding. I think the current state of the market provides a clear signal of why the Fed needs to cut interest rates this month - dumping bonds while growth stagnates will make real yields surge and could cause the market to retreat from US assets altogether, which would be a worst-case scenario. I think the Fed has no choice but to keep cutting rates in order to keep yields down. Since the breakeven rate FRED:T5YIE was rising at the end of last week, a drop in the nominal yield TVC:US05Y now would send the real yield to lower lows.
2. FX
Since the dollar can service as a funding or carry currency, I am comparing US rates to “carry” countries and the dollar index to other carry currencies in order to determine whether investors in this yield-seeking regime would be interested in dollars. Here you can see that compared to yields in Great Britain, Canada, New Zealand, and Australia (not shown), US yields are underperforming, and as a result, the dollar is weakening against the respective currency indices TVC:AXY , TVC:CXY , TVC:ZXY
This is my new indicator that normalizes carry country yields (GB, CA, SE, NZ, AU) vs safe haven yields (JP, CH, EU, & US), shown on the dashed line, and respective currency pairs on the dotted line in order to detect the risk regime. Here we are seeing that carry yields are elevated and the market is still chasing after them compared to rushing to funding currencies for yield or safety.
Here is a comparison of funding countries. My expectation for this week is that
1. The market will still be seeking yield (risk-on)
2. If US yields & USD fall, it will lift carry trades vs USD (such as FX_IDC:CADUSD & OANDA:AUDUSD )
3. Risk-on regime continues, which will boost US equities
Of course, the opposite will play out if the Fed keeps rates high, however they need to keep foreign investors buying US debt in order to sustain our unsustainable debt for a little while longer. Leaving rates unchanged will spook investors about the trajectory of monetary policy and lead to higher yields. This is why I am quite confident we will see a rate cut and am explaining this scenario in more detail.
3. Risk
Credit fear continues to ease, while risk-on tech bets AMEX:XLK recover against safety in consumer staples AMEX:XLP
4. Equity Comparison
Tech is still battered compared to other sectors. A sign of tension will emerge if tech continues to underperform the market while the Fed is signaling continued monetary easing. This would point to a true change in sentiment in which the market may be bearish on Tech. If this were to happen, a major market correction could be on the horizon.
5. Bias
I’ve changed a few things on this layout and moved the CVD indicators to my QQQ chart since they react better to regular market hours order flow. Here I have a Z-score indicator of CME_MINI:ES1! - CBOE:VX1! which shows that the equity regime for September so far is bullish. ADL is flattening out but is not giving a useful signal yet. I also changed the linear Historical Volatility indicator to a Z-score oscillator which shows HV is declining and moving back to its floor, which can also be seen on VIX. Since we are guaranteed to see a major volatility spike after the rate announcement, I think VIX may be choppy until then.
What’s worth noting is that with HV (non-directional) at its floor (sensitive to any Vol spikes) and VIX back to its floor ahead of the rate announcement, this signals to me that equities may have more sensitivity to a downside movement.
+-+-+-+-+-+-+-+-+-+-+-+-+-+-+-+-+-+-+-+-+-+-+-+-+-+-+-+-+-+-+-+-+-+-+-+-+
When viewed together, I think all of this sends an interesting message that points to divergence between Macro/FX and US equities. With the Fed cutting rates into slower growth and Tech underperforming, low HV/VIX makes equities vulnerable to a reduction in risk exposure. I think this is what we will see if rates are cut under the current regime.
1. Yields will fall, but TVC:DXY may hold steady if there is equity pressure in the US.
2. Risk-on yield-seeking trades in FX will continue. Dollar may hold up against other funding currencies but will fall against higher-yielding currencies
3. Tech will underperform
4. VIX catching a bid will correspond with US indices falling
5. Since global environment will still be risk-on, volatility will be limited to the US and may be less intense
As always, the reason I post my analysis is to provide a reference point as the week unfolds, and to backtest my strategies for improvement. For now, my bias is low volatility until FOMC (likely sideways or upside drift) followed by downside later in the week.

QQQ End of a Corrective Bounce?The Thanksgiving bounce was real & technically healthy with a sharp V-reversal off ~$585
Buyers regained key MAs (20d & 50d), oscillators turned upward & price broke out of the panic low without resistance
Last week’s action built a tight coil under a clear ceiling & this type of setup often resolves after a catalyst (FOMC)
QQQ is at a true inflection point - not obviously topping, not clearly breaking out
Both a pullback or breakout are technically reasonable
A pullback is possible given stretched momentum, thinning volume, clear resistance $631-$637, many components are strong, but not surging & other short-term exhaustion signals which makes a risk of fade technically credible
A breakout is still possible because the trend structure is intact, buyers defended every dip for 2 weeks, short-term AVWAPs are rising under price (support) & no reversal signals so the market tends to drift upward into events
The most realistic path is a slow grind into $630-$633 early this week & after FOMC, the market chooses its path
If buyers don’t have conviction, then a pullback toward $612 to $605
If buyers get a catalyst, then a breakout above $637
A “bounce into FOMC & then fade” base case is completely supported by the charts,
but it’s not the only valid outcome
A breakout remains technically possible if $637 is reclaimed with volume
QQQ’s Thanksgiving rally carried into last week’s consolidation & the index is now poised at resistance in a balanced, technically neutral state so it can push higher into the $630-$633 early in the week, but the real move (pullback or breakout) will be decided after FOMC
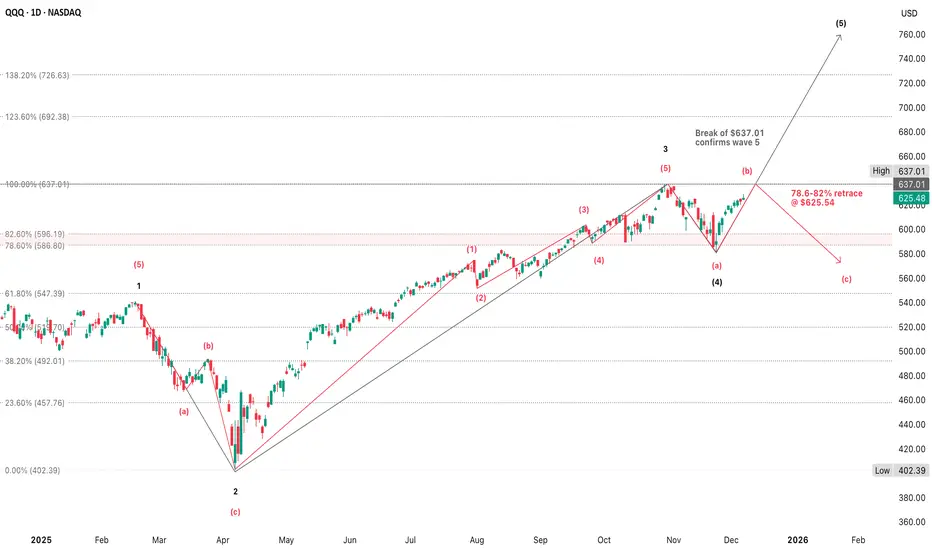
Wave 5 & Wave b often look similar until one key level is broken or held & right now, price is where both counts remain technically valid & that’s why I feel at a loss - it's ambiguous by nature, but there are precise levels that resolve the ambiguity
1. Price must break above the prior high at $637.01 with no exceptions
Wave 5 must make a higher high relative to wave 3
2. Wave 5 should show expanding candles, improving breadth & stronger volume on the
push through resistance bands
Right now the move out of wave a is corrective-looking & wave 5 often starts with corrective back-testing; however, it has the look of an a–b–c upward correction, not a start of a new leg higher & this is a yellow flag for the bull case
1. If price rejects at resistance, wave b is confirmed & wave 5 is invalidated
Price often stops exactly at the 78.6-82% retrace, which is common for wave b peaks
Price should fail below $632-$637, then break $600-$605 & possibly accelerate lower to $570
2. If price closes above $637, then wave 5 is confirmed, period
3. If price rejects $630-$637 & breaks below $612, then the wave b path is confirmed
This is the most important support on the chart
Break $612 & the bounce was corrective so wave c is next
The bounce up from wave a low looks much more like a wave b correction than a wave 5 start given the retracement depth (~78.6%) fits wave b perfectly, declining volume, stretched oscillators without trend confirmation & price pinned under major resistance
Wave 5 usually doesn't start with weak volume & overlapping candles, but wave b rallies often do
We don't confirm the wave b top until the market breaks support
Structurally, the chart is sound & doesn't violate any hard Elliott rules
A wave b often retraces 61.8-78.6%, or sometimes 100% of wave a
The current rally is sitting just below the 78.6-82% ($630-$632) & may even tag $637 if the market pushes into the event/catalyst
Wave c unfolds in 5 clean subwaves, often in a move parallel to wave a & usually lands near the 61.8% retrace of the prior impulse
A realistic target is $560-$575
The wave c target around $572 is reasonable if the correction continues
0.618 × wave a (~32 points)
1 × wave a (most common, ~52 points)
1.618 × wave a (during strong, sharp corrections, ~84 points)
$572 is between the 0.618 & 1 projections for wave c
Lands almost perfectly on the 50% retracement of the entire wave 3 advance
Qqq And tech sectorsI think in the coming week we will see Qqq close gap at 632, there is a chance for a pullback to 618-620 also this week.. I'll explain below how I come to both conclusions..
First The bad :
I'll start with The TVC:VIX
Fallen wedge here which is bullish for the vix... looks like a minimum bounce back to 17.00 is coming this week..
Max upside if Fomc goes bad is 19.50 -20.00 or 200ma
Naturally if the vix spikes you will see a pullback on equities..
If the vix spikes to 17.00 then I think we pullback to 618-620
This pullback would with a break below 622.00
Now if vix spikes back to 20.00, well that's the worst case scenario and that would put Qqq at 611-613 which provides the strongest support
20/50 sma plus price action
If qqq breaks below 610 and vix spikes above 23 then the bull rally is over !
I think as long as 613 holds Qqq is going to 640 minimum and 655 max
Remember at the end of the day we are dancing with the devil up here at the 15yr resistance
Bulls haven't last more than 2weeks up here in the last 2yrs before a 7-15% correction
I'm not showing this to confuse you, I'm showing you the bigger picture so you can understand that despite whatever bullish move that happens in the next 2weeks I don't think it sustains through the entire Dec and another sell like what we saw in Nov is around the corner..
Now on to why I feel like qqq is headed to 640-660.
First off Qqq is showing a broadening wedge and it has reclaimed its summer channel
A descending broadening wedge usually pushes the stock/Index back to its ATH (See iwm) and sometimes higher ..
The measured moved goes like so
so an 8% move up from the breakout would put Qqq at 660 or 1.618 on fib extension
When you look at the 3 biggest sectors
AMEX:XLC
AMEX:XLK
NASDAQ:SMH
You'll see similar bullish patterns
AMEX:XLC
Just broke out of a bullflag in its 3 yr uptrend
Bullflag wants to take this sector back to 120 minimum
NASDAQ:META and NASDAQ:NFLX will pump XLC the most
AMEX:XLK
Same broadening wedge as Qqq and pretty much same analysis
This move up on XLK I think will push NASDAQ:MSFT back to 510..
NASDAQ:SMH
Chips
Same broadening wedge as Qqq and XLK
Actually outperformed most tech Sectors because of Intc , amd and AVGO.. but I think the next leg up comes from NASDAQ:NVDA with a push back to 190ish
Now , down to the action/Tradeable analysis..
NASDAQ:QQQ , wait for a move back above 627.00 to go long next week.. target of course is 632
Qqq has been trading for the most part of this rebound in this tight channel in white; Keep an eye out for the resistance
Any opening bove 623 is neutral and you could try calls with a stop below 622.00
Things get bullish back above 627
Things get bearish below 622 with a target of 618.
622-627 IS CHOP..
Has a gap left open at 617 and the 1hour 200ma is there too . I know I said below 618 and 612 comes but they could dip for the gap close and push back above..
There is a trade I like going into this week.
1st . NASDAQ:MSFT
Weekly chart has given 3 higher lows.
Daily chart is showing wedge breakout and retest
I think it's headed back to 510 this month which in perspective is only a 5% upside.
Above 485 take calls to 492
Above 495 take calls to 510
Simple setup.

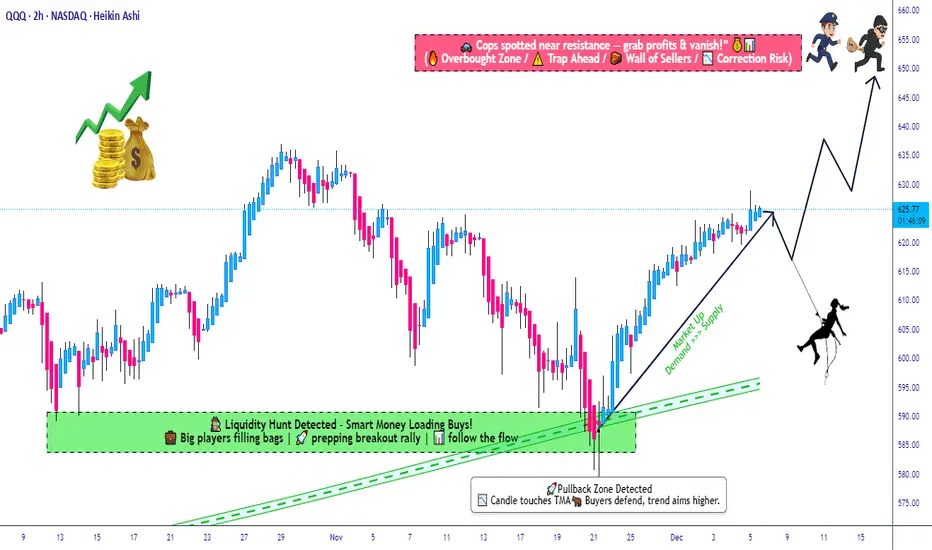
Market Focus on QQQ — Bullish Setup Taking Shape!🎯 QQQ ($INVESCO NASDAQ-100) Bullish Swing Trade Setup
The Layered Entry "Thief" Strategy | Profit Playbook 💰
📈 MARKET OUTLOOK
The QQQ (INVESCO QQQ TRUST) is positioned for a bullish swing trade setup. 🚀 This technical analysis focuses on strategic multi-layer entry execution with defined risk/reward parameters suitable for intermediate swing traders.
🎪 ENTRY STRATEGY: "LAYERED THIEF" METHOD
This isn't your typical entry—we're using smart limit order layering 🎯 to accumulate positions at key support zones. Think of it as a professional scale-in approach!
📍 Limit Order Entry Layers:
Layer 1: $605.00 ⭐
Layer 2: $610.00 ⭐
Layer 3: $615.00 ⭐
Layer 4: $620.00 ⭐
💡 Pro Tip: Feel free to add additional layers ($625, $630, etc.) based on your risk tolerance and account size. The thief's advantage is patience and positioning!
Entry Triggers: Volume confirmation + Support zone bounce + Institutional accumulation signals 📊
🛑 STOP LOSS (Risk Management)
⚠️ THIEF SL: $590.00
📢 DISCLAIMER: This stop loss is a suggestion only. You are responsible for setting your own risk parameters based on your trading capital, risk tolerance, and market conditions. Trade at your own risk! 🎲
🎊 PROFIT TARGETS (Exit Strategy)
PRIMARY TARGET: $650.00 ✅
SECONDARY RESISTANCE: $660.00 ⚠️
Note: The $660 zone presents strong technical resistance combined with overbought conditions and potential reversal traps. We recommend taking profits at $650 and letting a small portion run if momentum confirms. Smart money moves!
📢 DISCLAIMER: Target levels are suggestions based on technical analysis. Your profit-taking strategy should align with your personal risk/reward ratio. Final exit decisions rest with you! 🎯
🔗 CORRELATED PAIRS TO MONITOR
Keep an eye on these related assets for confirmation signals:
🔴 QQQ Constituents & Index Correlation:
NASDAQ:AAPL (Apple Inc.) — Tech sector heavyweight; if AAPL breaks support, QQQ may follow 📱
NASDAQ:MSFT (Microsoft Corp.) — AI & cloud leader; typically leads QQQ moves upward 🤖
NASDAQ:NVDA (NVIDIA Corp.) — Semiconductor bellwether; massive correlation to tech rallies 💻
NASDAQ:TSLA (Tesla Inc.) — Growth driver; watch for momentum continuation signals ⚡
NASDAQ:GOOGL (Alphabet Inc.) — Large-cap tech anchor; supports QQQ uptrend confirmation 🔍
📊 Macro-Level Pairs:
NASDAQ:NDX (NASDAQ-100 Index) — Direct parent index; should mirror QQQ closely 📈
AMEX:SPY (S&P 500 ETF) — Broader market health check; risk-on environment confirmation ⭐
AMEX:IWM (Russell 2000 Small-Cap) — Risk sentiment gauge; divergence = caution ⚠️
TVC:DXY (US Dollar Index) — Inverse correlation; strong dollar = headwind for tech 💵
Key Correlation Points: Watch for tech sector strength continuation and macro risk-on sentiment. If NDX confirms, QQQ breakout is highly probable! 🚀
💡 STRATEGY BREAKDOWN
✅ Bullish Bias with patience-based accumulation
✅ Defined Risk at the $590 level
✅ Layered Entry for optimal position sizing
✅ Technical Confluence at resistance zones
✅ Risk/Reward Potential = Approx 1:2.5 ratio
🎓 TECHNICAL VALIDATION CHECKLIST
✅ Support zone identification at $605-620 range
✅ Volume analysis at entry levels
✅ RSI divergence confirmation
✅ Moving average alignment (200 SMA positioning)
✅ Institutional order flow patterns
✅ Market structure (Higher Highs/Higher Lows)
✨ If you find value in my analysis, a 👍 and 🚀 boost is much appreciated — it helps me share more setups with the community!
#QQQ #SwingTrade #TechETF #NASDAQ100 #TradingStrategy #ThiefStrategy #LayeredEntry #ProfitPlaybook #Bullish #TechnicalAnalysis #ETFTrading #RiskManagement #ActiveTrading

QQQ Heading to 635 soonBy breaking the current resistance layer chances are high we will be heading to 635 this week.

QQQ A Fall Expected! SELL!
My dear followers,
This is my opinion on the QQQ next move:
The asset is approaching an important pivot point 625.54
Bias - Bearish
Technical Indicators: Supper Trend generates a clear short signal while Pivot Point HL is currently determining the overall Bearish trend of the market.
Goal - 612.68
About Used Indicators:
For more efficient signals, super-trend is used in combination with other indicators like Pivot Points.
Disclosure: I am part of Trade Nation's Influencer program and receive a monthly fee for using their TradingView charts in my analysis.
———————————
WISH YOU ALL LUCK
Stock Market Forecast | BTC TSLA NVDA AAPL AMZN META MSFTStock Market Forecast | CRYPTOCAP:BTC SP:SPX NASDAQ:NDX CME_MINI:ES1!
Mag 7 | TSLA NVDA AAPL AMZN META MSFT GOOGL

QQQ VWAP Based EntriesWhen price moves from below to above an AVWAP decisively, it signals short covering & a shift in control from sellers to buyers & when 2 or more AVWAPs converge liquidity concentrates, reversals or breakouts often happen there & these are the spots where traders take reversal trades, breakout entries, or stop placements
Right now, the 3 & 21 November AVWAPs are separated, meaning trend strength
When they converge, it signals compression
1. Using AVWAPs as a dynamic stop-loss is one of the simplest & most effective uses
If you're long above the 21 November AVWAP, the rising blue AVWAP is your dynamic stop
A close below it should signal an exit
It reflects the average buyer cost basis, not arbitrary price levels
2. An AVWAP is a useful trend filter
Price above rising AVWAP(s) suggests a long bias
Price below falling AVWAP(s) suggests short bias
When price chops around a flattening AVWAP, stay out
AVWAP is a trend health indicator
3. AVWAP + candlesticks = clean entry signals
The strongest signals come when price pulls back into an AVWAP, prints a small reversal candle (hammer, doji, engulfing) & ATR is declining (just like now) since these become high-quality continuation entries
As a high-level playbook, anchor VWAPs at major pivots (highs, lows, breakdowns, earnings gaps), trade pullbacks into rising AVWAPs during uptrends & trade rejects from falling AVWAPs in downtrends
Use converging AVWAPs as inflection points
Use the nearest rising AVWAP as your stop
Anchor to the close if the candle represents an event you want to capture (breakout, breakdown, a clear reversal bar, a candle where closing price indicates the market's verdict, earnings, FOMC, etc)
Anchor to (H+L+C)/3 (the “typical price”) when you want a smoothed, less-biased VWAP for longer-term structures or swings
Typical price reduces noice from intraday spikes & avoids sensitivity to one extreme print or over-reaction to the tails on the candle (AVWAP from swing highs/lows or the start of a trend)
Price is above all AVWAPs
This means all meaningful “cost basis cohorts” are beneath price
The market is structurally repaired, at least in volume-weighted terms
Overhead resistance from anchored supply does not exist right now
This is a very different situation from when AVWAPs are stacked above price
The ATH AVWAP is rising & firmly below price
This is one of the best signs of long-term trend health in AVWAP analysis
When the ATH AVWAP is rising, decisively reclaimed & acting as near-term support, it usually tells you the prior correction has been fully absorbed
Longs from the top are no longer underwater
Selling pressure from those prior buyers is neutralized
Trend followers using AVWAP logic have flipped their filters back to “risk-on”
This is an objective, mathematical read & not a prediction
The 3 & 21 November AVWAP are now support layers
3 November (red) are breakdown-day sellers who are now underwater & this is a bullish dynamic because they can’t apply pressure
21 Nov (blue) are capitulation low buyers, still profitable & in control - primary support
Together, these form a layered support around $605-$612, or the area where dip-buyers have historically stepped-in
A stop-loss location for AVWAP-based trading systems
Now that price is above all 3 major AVWAPs, the focus shifts to behavior around the ATH AVWAP & since price is above it already, there are only 2 meaningful reads
1. Bullish continuation setup
2. Price may pull back to the ATH AVWAP ($618)
Find buyers (hammer, doji, small-range reversal) & then move away
This is one of Brian Shannon’s highest-probability setups (reclaim AVWAP → pullback → higher low → continuation)
Potential warning setup because trend deterioration begins with this move
Price closes below the ATH AVWAP
Then stays below it for multiple sessions
Slope begins to flatten or roll over
This would be your first objective sign that the trend is losing strength from an anchored-volume standpoint
The chart shows the exact 3 level anchored VWAP system that institutional traders use
A correction-low AVWAP (21 November)
A breakdown-event AVWAP (3 November)
A structural high AVWAP (ATH)
This lets you map out short-term trend control (blue), intermediate-term supply absorption (red) & higher-timeframe trend health (gray) & right now, all of them say the same thing
Price is in a state of repaired, orderly trend with all major AVWAPs providing support beneath
ATH AVWAP
Defines trend health at the highest timeframe visible on your chart
Swing traders, late buyers at the highs, trend-following algos
When price is above the ATH AVWAP then the uptrend is structurally intact
When price is below it then long-term players are underwater, trend is suspect
QQQ is above the ATH AVWAP (~$618)
This means that ATH buyers are profitable again
The first high-quality pullback often tags this line in early trend repair phases
A reclaim → retest → hold sequence is extremely bullish behavior
3 November breakdown AVWAP
Tracks sellers from major breakdowns or panic candles
Funds that sold into weakness, systematic risk-off flows
If price is above it then that entire selling cohort is underwater
These traders become forced buyers on pullbacks or breakouts
AVWAP ~$610
Price is above it then supply from that breakdown is absorbed
This AVWAP becomes support on deeper pullbacks
If price tags it then watch for immediate dip-buying
21 Nov AVWAP - capitulation
Tracks the cost basis of buyers who stepped in at the emotional low
Aggressive reversal traders, deep-value algos, CTA re-leveraging
This is the most important rising support line in the model
When price is above it, the reversal cohort is still in control
A close below it often signals trend exhaustion
AVWAP ~$605
Price is well above it & the slope is rising aggressively
As long as price respects this AVWAP, the recovery trend remains clean
If price pulls back to it then this is a high-odds rotation/continuation buy point
Long-Term AVWAP
This is the long rising AVWAP on your chart (~$592)
It acts as deep trend support
The line separating bull vs bear structure
The highest timeframe “fair value” of the entire trend leg
A tag here marks trend reset, not breakdown
A break below this layer shifts the market into caution
This long AVWAP is safely under price so the long-cycle trend remains intact
When all layers are stacked in ascending order like this, you get a fully aligned bull structure, clean pullback architecture, no overhead VWAP resistance, multi-cohort profit alignment & strong continuation behavior
This model is about control, not prediction & right now, the bullish alignment is simply a fact of structure
These levels come directly from how institutions trade AVWAPs
1. ATH AVWAP (~$618) is the light pullback, common after a fast push off a low
Signals to watch for include a hammer/doji at the AVWAP
Lower wick rejection
ATR contraction & reversal
Reclaim → hold → push
This is the first layer most swing traders buy
2. 3 November AVWAP (~$610)
This is the mid-depth pullback
It’s usually triggered when short-term longs trim
Expect a strong buyer reaction
1-2 days of stabilizing candles
Momentum traders stepping back in
This is a very strong continuation level in AVWAP systems
3. 21 November AVWAP (~$605)
This is the high-value dip
This line is VWAP traders’ favorite
It represents the true reversal cohort’s cost basis
It has been respected perfectly
It rises steadily each day
It marks the “line of trend continuation”
If price reaches this AVWAP, this is often the highest-probability buy in the entire structure
Rejecting here = trend continuation
Closing below = trend fatigue
4. Long-Term AVWAP (~$592)
This is the deep reset, not a casual dip
If price ever hits this momentum is gone, trend is resetting, higher timeframe traders reassess, hedge funds rotate & isk allocation shifts
This is not a breakdown, but it is a significant tone-change
You rarely see this tested unless markets enter a broader digestion phase
Given the current AVWAP spacing & slope
$618 (ATH AVWAP) is highly actionable
$610 (3 November AVWAP) is a strong level
$605 (21 November AVWAP) is an institutional-grade support
When price is above all 3, VWAP traders don’t look for tops - they monitor control transitions
QQQ: Price Action & Swing Analysis
Balance of buyers and sellers on the QQQ pair, that is best felt when all the timeframes are analyzed properly is shifting in favor of the sellers, therefore is it only natural that we go short on the pair.
Disclosure: I am part of Trade Nation's Influencer program and receive a monthly fee for using their TradingView charts in my analysis.
❤️ Please, support our work with like & comment! ❤️
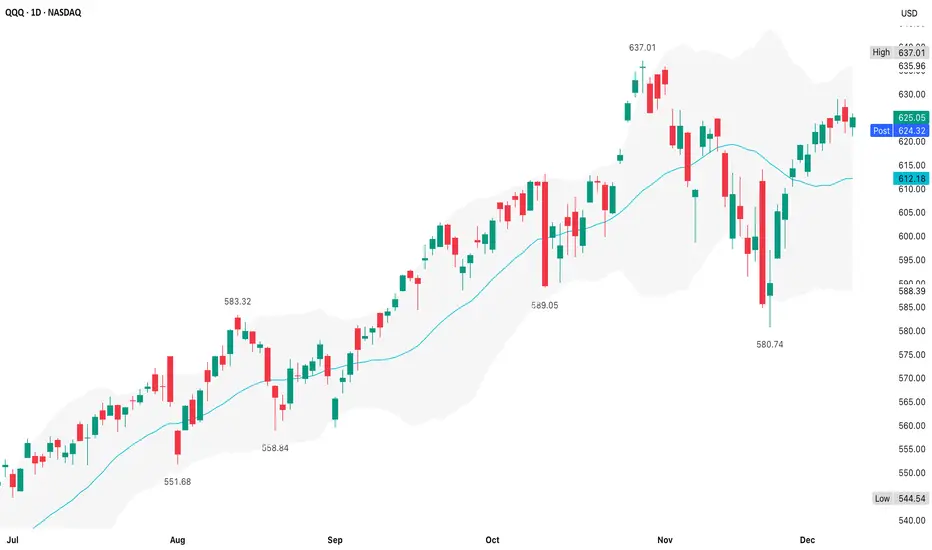
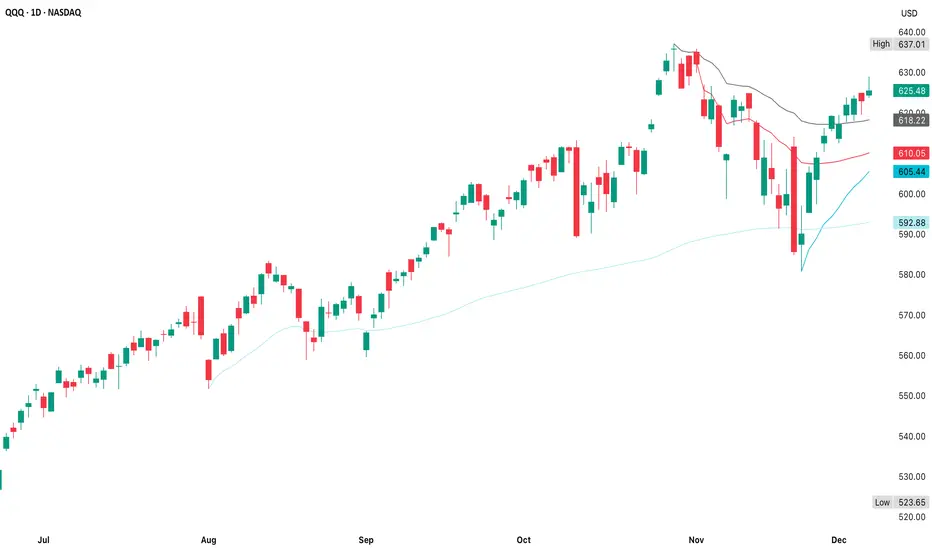
QQQ (5 December)When QQQ tops on the daily timeframe, you typically see upper-band overextension, multiple rejection wicks, bearish engulfing candles, a clear lower high formation, EMA breakdown & shrinking momentum + rising volatility, but the chart shows the opposite
Price bounced cleanly off the mid-band & is riding the upper half of the Bollinger channel
This is continuation behavior - not reversal structure
The daily trend is intact and healthy
No close below the mid-Bollinger (20d MA)
No sharp mean reversion
No violation of October low structure
Higher lows since the pivot around $589
This is an uptrend, with no technical evidence of topping
$637 is the ATH
QQQ rarely tops on the first retest
It either i) consolidates under resistance & then breaks, or ii) fakes a small dip & then breaks
The current setup shows controlled expansion, trending conditions, no volatility spike, smooth adherence to mid-band support & higher highs forming inside the bands
This is bullish
The last candle is green, closing near the upper band with solid volume & QQQ closed above $625 - a higher high vs last week, which suggests continuation, not distribution
1. Breakout attempt toward $630-$635
60%
Trend + position in band favors upside
2. Pullback to $620-$615 before breaking higher
30%
Standard retest of mid-band structure
3. Deep reversal toward $580
10%
No topping pattern; requires macro shock

QQQ Structured Bullish Scenario • Compression Into MA Support📌 Asset: QQQ — Invesco QQQ Trust Series 1 (NASDAQ ETF)
🔎 Style: Swing / Day-Trade Profit Playbook
🎨 Theme: Bullish Pullback Setup using Triangular Moving Average + Layered Entry Strategy
📈 Bullish Pullback Plan — “Thief Layering Strategy” Edition 🕵️♂️💰
QQQ is pulling back into a Triangular Moving Average zone, forming a clean bullish reaction area. Price behavior shows controlled momentum, healthy retracement, and a potential continuation toward the upper supply zone.
To keep it fun — Thief OG Style is included but in TradingView-permitted language and friendly terms.
🎯 Entry Plan (Layered Limit Entries — “Thief Style but TV-Friendly”)
Using a layered entry method (multiple limit orders placed at different levels to reduce average cost and control risk):
Buy Limit Layer 1: 605
Buy Limit Layer 2: 610
Buy Limit Layer 3: 615
Buy Limit Layer 4: 620
(Traders may increase or reduce the number of layers based on their own strategy and risk tolerance.)
🛑 Stop Loss (Risk Control Zone)
📍 Proposed Risk Level: 600
This is shared for educational insight only — every trader must select their own SL depending on risk appetite.
🎯 Target Zone (Resistance + Police Force Zone 🚓😆)
Projected upside target: 650
The resistance zone has strong reaction history + signs of overbought conditions + possible liquidity traps.
So take profit smartly and exit with gains before “police force” catches late buyers.
(Again: this TP is optional — traders should decide their own TP levels.)
📚 Market Context & Correlation Watchlist 🔍🌐
QQQ is heavily correlated with major US tech indices & megacap tech stocks. Watching related pairs helps understand volatility, liquidity shifts, market strength, and trend momentum.
🔗 Related Pairs to Watch (Cross-Checks & Correlation Insight)
💠 NASDAQ:NDX / PEPPERSTONE:NAS100
Direct parent index of QQQ
Moves almost identically
Great for trend confirmation
💠 SP:SPX / AMEX:SPY
Broader market risk sentiment
If SPY + QQQ align in bullish direction → strength confirmed
💠 TVC:VIX
Volatility meter
Lower VIX supports bullish continuation
💠 NASDAQ:AAPL , NASDAQ:MSFT , NASDAQ:NVDA , NASDAQ:AMZN , NASDAQ:GOOGL
These top components control majority of QQQ weighting
Bullish tech megacaps = higher probability QQQ reaches target
💠 TVC:DXY (Dollar Index)
Strong USD = pressure on equities
Weak USD = supportive for QQQ rallies
💠 NASDAQ:TLT / US10Y
Bond yields inverse to growth stocks
Falling yields can provide additional bullish fuel for QQQ
🧠 Key Technical Points 🛠️🔥
Triangular MA acting as dynamic support
Healthy pullback with controlled selling
Layering entries reduces average cost & improves RR
Resistance zone at 650 aligns with prior structure
Megacaps still holding bullish bias
Volatility decreasing → favorable for continuation
✨ “If you find value in my analysis, a 👍 and 🚀 boost is much appreciated — it helps me share more setups with the community!”
⚠️ Disclaimer
This is a thief-style trading strategy just for fun.
#QQQ #NASDAQ #ETF #SwingTrade #DayTrading #TechnicalAnalysis #TriangularMA #LayeringStrategy #LimitOrders #MarketAnalysis #TradingPlaybook #USMarkets #Stocks #TraderLifestyle #Investing #BullishSetup #TrendContinuation #RiskManagement #ChartAnalysis
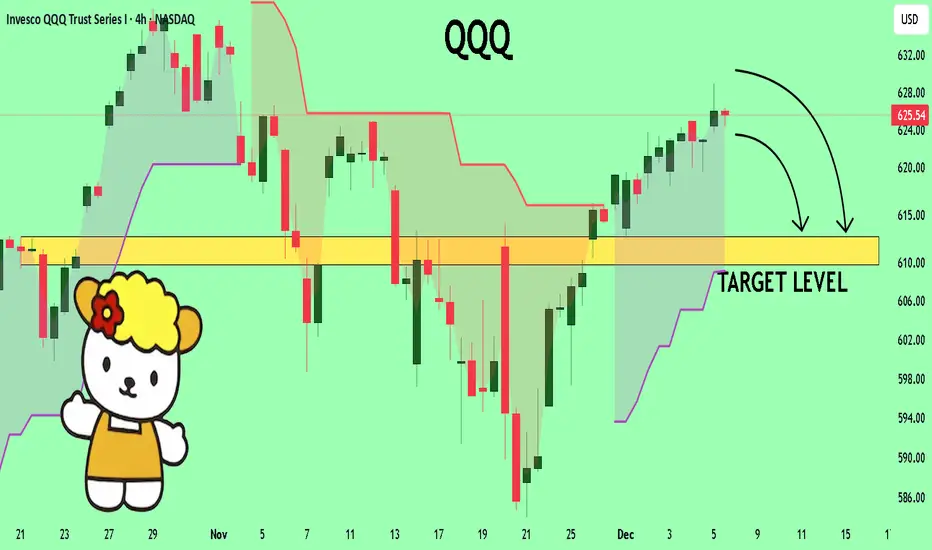
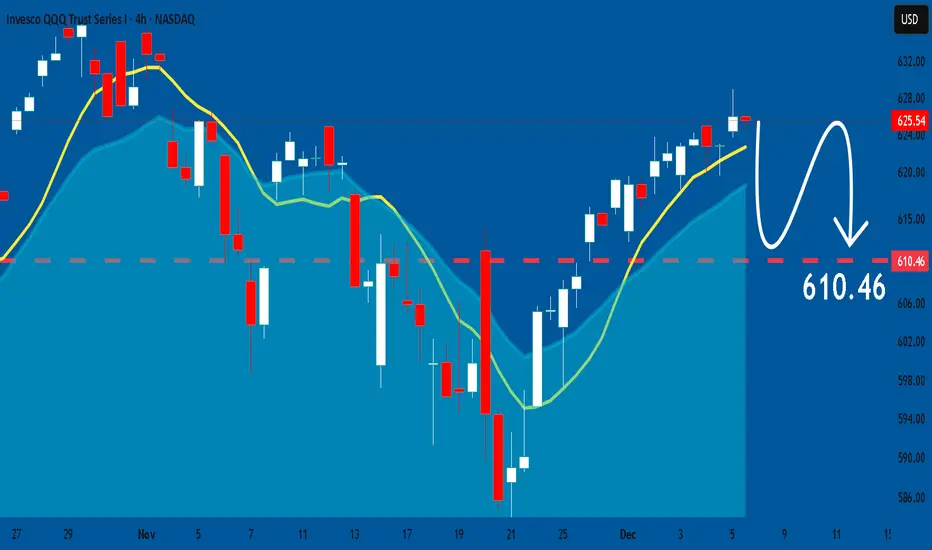
QQQ Is QQQ topping?The 4H chart shows a clean breakout retest attempt as price is now testing the $625 resistance, the same area that previously rejected multiple times, but this time the backdrop is different
RSI shows no bearish divergence & sits at ~63 (bullish, but not overbought) which supports continuation upward, not rejection
Stoch is overbought, but embedded (staying >80) - typical of trending moves & this usually precedes a breakout, not a reversal
MACD shows a bullish cross with an expanding histogram while the MACD line is curling upward, not flattening
Price structure strongly favors an upside push into $630-$637
The 4H candles show higher lows, higher highs, strong impulsive green sequences & controlled pullbacks with shallow retracements
This is not corrective price action - it’s impulsive
Immediate resistance is $625.50 so a break and 4H close above = $630 test likely within 1-2 sessions
Bullish thesis remains intact unless $618 (primary support) breaks
Ultimately, $605-$607 must hold for a broader uptrend above the recent highs to +$640
Right now price sits at $622-$625, well above these key levels
A breakout attempt is coming with an immediate targets of $630 & $637
We have an expected inline PCE today, FOMC next week (likely signaling 2025 cuts) & seasonality (December is historically bullish)
This is when a rally should ignite
As long as QQQ trades above $618 and especially above $611, bulls remain in control
Probability of testing $630-$637 before 19 December is higher than failing $618 (~55%)
A daily close above $637 invalidates the a-b-c bearish path & confirms wave (5) is underway
Upside targets are $692 (Fib 123.6%) & $726 (Fib 138.2%)
These align with historical QQQ extensions during Fed pivots
This is the scenario the current macro narrative supports with PCE likely inline, Fed likely signals rate cuts for 2026, yields easing & seasonality strong
The current bounce is wave (b) with wave (c) next only if wave (4) is not complete
If that happens, downside targets cluster include $586 (Fib 78.6%), $560 (Fib 100%) & $547 (Fib 61.8% of entire rally)
Probability of deeper a-b-c correction is ~45%, lower if Fed confirms a pivot next week
QQQ is between bullish continuation vs bearish retrace for max frustration
1. Bullish wave (5)
55%
$637-$650+
Highly favorable
2. Sideways/Chop
15%
$615-$625
Theta pain, but not dead
3. Bearish wave (c)
30-35%
$586-$560
Call loses value
Because we haven’t broken $618 & macro is supportive, wave 5 has the edge right now
QQQ is riding the middle Bollinger band upward
Rejected the lower band (18-21 November)
Reclaimed the 20d MA
Is now trending upward along the mid-band
This is a post-pullback continuation trend, not a topping structure & is bullish until the middle band is lost
Price is likely to push toward the upper band, which right now aligns with $632-$637
Before the November drop bands were wide, volatility high, contraction & a trend shift, but now, bands are narrowing slightly, but the upper band is tilting upward, not flat
Flat upper band = consolidation
Rising upper band = trend continuation
The chart shows rising upper band or bullish drift with breakout potential
QQQ is currently not touching the upper band, not forming topping wicks, not showing distribution volume, so this means no exhaustion, room for upside & momentum still building
f price were already slamming the upper band repeatedly, that'd be a warning, but it’s sitting comfortably between the bands & trending upward without overheating
Everything on this daily chart supports continuation into $630+ over the next 5-10 sessions
